Abstract
The role of mesenchymal stromal cells (MSCs) in the pathogenesis of myelodysplastic syndromes (MDS) has been increasingly addressed, but has yet to be clearly elucidated. In this investigation, we found that MDS cells proliferated to a greater extent on MDS-derived MSCs compared to normal MSCs. Matrix metalloproteinase 1(MMP1), which was downregulated in MDS-MSCs, was identified as an inhibitory factor of MDS cell proliferation, given that treatment with an MMP1 inhibitor or knock-down of MMP1 in normal MSCs resulted in increased MDS cell proliferation. Further investigations indicated that MMP1 induced apoptosis of MDS cells by interacting with PAR1 and further activating the p38 MAPK pathway. Inhibition of either PAR1 or p38 MAPK can reverse the apoptosis-inducing effect of MMP1. Taken together, these data indicate that downregulation of MMP1 in MSCs of MDS patients may contribute to the reduced capacity of MSCs to restrict MDS cell proliferation, which may account for the malignant proliferation of MDS cells.
Myelodysplastic syndrome (MDS) is a heterogeneous group of clonal disorders derived from hematopoietic stem and progenitor cells(HSPC), and is characterized by ineffective bone marrow haematopoiesis, peripheral blood cytopaenias and a risk of progression to acute myeloid leukaemia1. The bone marrow in low-grade MDS is characterized by increased apoptosis, whereas high-grade patients are characterized by accumulation of blasts. The aetiology of MDS has been mainly ascribed to molecular alterations of CD34 + HSPC2,3. However, the bone marrow (BM) microenvironment may also contribute to the pathogenesis of MDS4,5.
Mesenchymal stromal cells (MSCs) are key components of the BM microenvironment and play a crucial role in supporting and regulating HSPC6,7. In addition to their supportive effects, stromal cells may also facilitate apoptosis of hematopoietic cells in some pathological circumstances8,9. Mhyre et al. demonstrated that co-culture with stromal cells enhances apoptosis susceptibility and upregulates various genes involved in apoptosis in MDS hematopoietic cells and leukaemia cell lines8. Distinct genetic abnormalities have been identified in a portion of MDS-derived MSCs10,11. In addition, several cytokines, adhesion molecules and transcription factors have also been reported to be altered in MSCs of MDS patients12,13,14. However, whether and how these abnormalities are associated with the pathogenesis of MDS have not been clearly elucidated.
Among the mediators released from MSCs, matrix metalloproteinases (MMPs) are important regulators of the tumour microenvironment15,16. MMPs can affect multiple signalling pathways that modulate the biology of cells, thus exhibiting tumour-promoting or -suppressing effects in different circumstances17,18,19,20. We performed mRNA expression profiling of the MMP family in MSCs, and found that only matrix metalloproteinase 1 (MMP1) was downregulated in MDS-derived MSCs compared with normal control MSCs (Supplementary Fig. S1). Thus, MMP1 was chosen for use in subsequent studies. MMP1 has been reported to target protease-activated receptor 1 (PAR1) on the tumour cell surface and promote invasion and metastasis in breast cancer21,22. By targeting PAR1, MMP1 activates intracellular G proteins and downstream signaling, such as Gα12/13-Rho, p38 MAPK and ERK, thus potentially altering the biological activity of tumour cells23,24,25,26.
In the present study, the role of MMP1 in the interaction of MSCs and MDS cells was evaluated. MMP1 secreted from MSCs inhibits the growth and induces apoptosis of SKM-1cells and primary CD34 + cells from MDS patients through interaction with PAR1, which further activates p38 MAPK and downstream genes. Thus, downregulation of MMP1 in MDS-derived MSCs is associated with increased MDS cell proliferation.
Results
MDS cells proliferate to a greater extent on MDS-MSCs compared with normal control MSCs
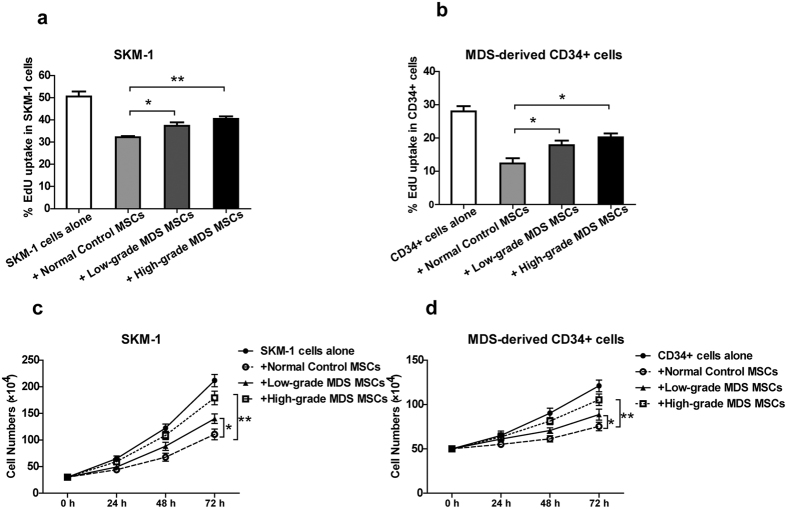
SKM-1 cells and MDS-derived CD34 + cells were cultivated alone or in the presence of normal MSCs or MDS-MSCs at a ratio of 5:2 and were tested for their proliferative activity after 72 h of culture by the EdU assay. In addition, cell numbers were counted using a haemocytometer at 24 h, 48 h and 72 h of culture. Co-culture with both normal MSCs and MDS-MSCs suppressed the proliferation activity of MDS cells compared with MDS cells cultured alone. Importantly, both the EdU assay and cell counting indicated that MDS cells proliferated to a greater extent on MDS-MSCs compared with normal control MSCs (Fig. 1).
Figure 1. MDS cells proliferate to a greater extent on MDS-MSCs compared with normal control MSCs.
SKM-1 cells (a and c) and MDS-derived CD34 + cells (b and d) were co-cultured with normal MSCs or MDS-MSCs or cultured alone. (a and b) The percentage of S phase cells was evaluated by the EdU assay after 72 h of culture. (c and d) Cells were counted with a haemocytometer at 24 h, 48 h and 72 h of culture. Normal MSCs and MDS-MSCs inhibited MDS cell proliferation. Both low-grade and high-grade MDS-MSCs exhibited reduced capacities to restrict the proliferation of MDS cells compared with normal MSCs. (Data represent the mean ± SEM from at least three independent experiments. *P < 0.05).
MMP1 as an inhibitory factor of MDS cell proliferation
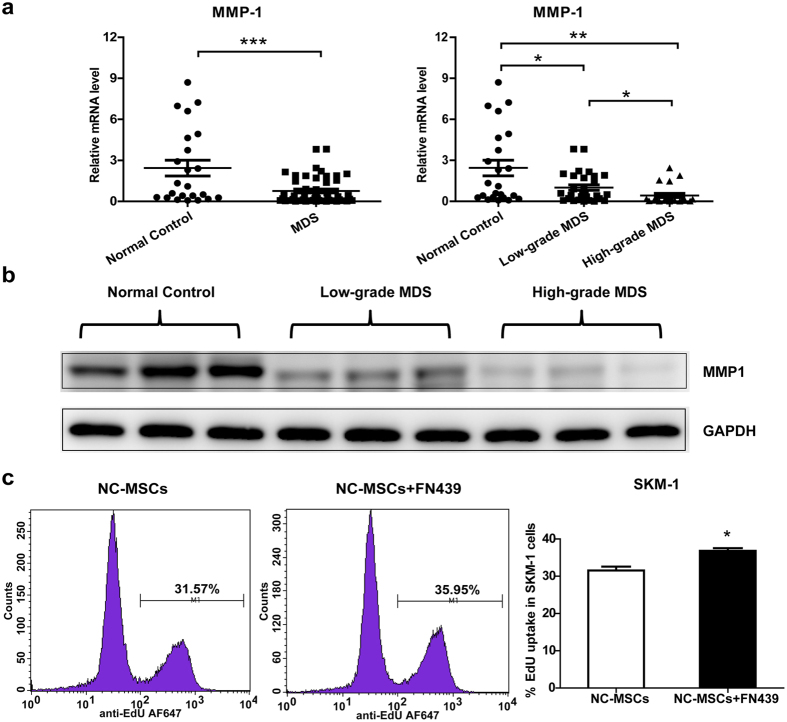
MMPs secreted from stroma cells are important regulators of the tumour microenvironment. We performed mRNA expression profiling of MMP families (MMP1, MMP2, MMP3, MMP7, MMP8, MMP9, MMP11 and MMP12) in MSCs, and found that MMP1 was decreased in MDS-derived MSCs compared with normal MSCs (Supplementary Fig. S1 and Fig. 2a). In addition, high-grade MDS patients possessed lower levels of MMP1 than low-grade MDS patients. MMP1 mRNA expression was further confirmed through a comparison with another house-keeper gene (Supplementary Fig. S2a). The MMP1 protein levels were also decreased in MDS-derived MSCs, which is consistent with MMP1 mRNA expression (Fig. 2b). To test whether MMP1 is involved in the reduced capacity of MDS-MSCs to restrict the proliferation of MDS cells, we added the MMP1 inhibitor FN439 (5 μM) to normal MSCs and SKM-1 in co-culture. The addition of FN439 significantly increased the proportion of SKM-1 cells in the S phase (Fig. 2c). However, in the absence of MSCs, FN439 did not show any effects on MDS cell proliferation (Supplementary Fig. S2b). The above results suggest that MMP1 plays an important role in suppressing MDS cell proliferation in MSCs and MDS cells in co-culture.
Figure 2. MMP1 is an inhibitory factor of MDS cell proliferation.
(a) MMP1 mRNA expression in MDS-MSCs (n = 50; further classified as low-grade MDS (n = 29) and high-grade MDS (n = 21)) and normal control MSCs (n = 23) was measured by qPCR and compared with GAPDH. (b) MMP1 protein expression (54 kDa) in MDS-MSCs and normal control MSCs. (c)Addition of MMP1 inhibitor FN439 (5 μM) to normal control (NC) MSCs and SKM-1 co-culture increased the proportion of proliferating SKM-1 cells, as presented as flow cytometry plots (left) and a statistical figure (right). (Data represent the mean ± SEM from at least three independent experiments. *P < 0.05; **P < 0.01; ***P < 0.001).
The inhibitory effect of MSCs on MDS cell proliferation is decreased when MMP1 is knocked down
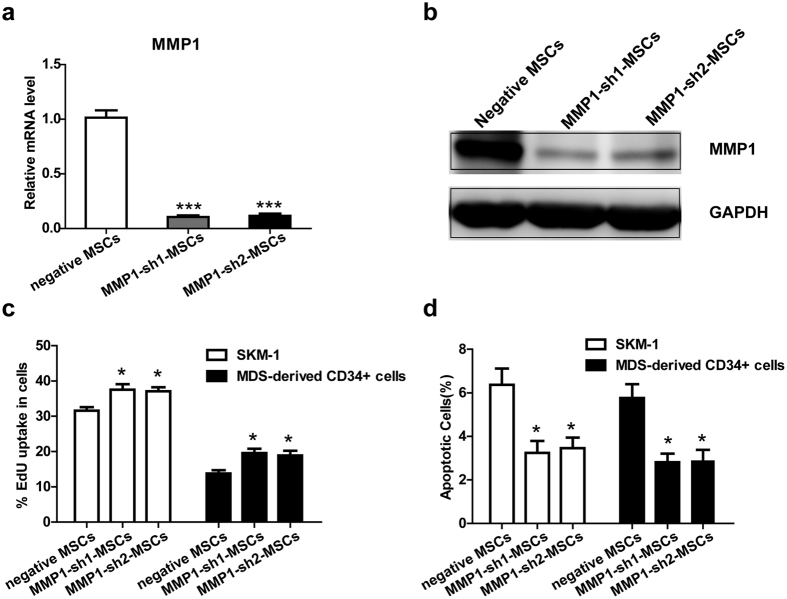
To further confirm that MMP1 is an important factor involved in the inhibitory effect of MSCs on cell proliferation, we constructed 2 retrovirus-based RNAi vectors that transfect MSCs with high efficiency. Normal MSCs were infected with the retroviral supernatant containing shRNA specific to human MMP1. On average, MMP1 was reduced by approximately 90%, as evaluated by real-time RT-PCR (Fig. 3a) and western blotting (Fig. 3b). We then evaluated the overall proliferation rate of MDS cells in the MMP1-knockdown (KD) group and negative control group. Similar to the results obtained from the MMP1 inhibitor assay, the proportion of MDS cells in the S phase was increased in the MMP1-KD group compared with the negative control group (Fig. 3c). In addition, co-culture with MMP1-KD MSCs resulted in decreased numbers of apoptotic MDS cells compared with negative control MSCs (Fig. 3d). Also, the proliferative proportion of CD34 + cells from healthy donors was increased and the apoptotic proportion was slightly decreased in the MMP1-KD group compared with negative control group (Supplementary Fig. S3a and b). In summary, the growth inhibition and apoptosis induction effects of MSCs on MDS cells were reduced when MMP1 was knocked down.
Figure 3. The inhibitory effect of MSCs on MDS cell proliferation is decreased when MMP1 is knocked down.
The RNAi efficiency of MMP1 in MSCs was assayed by (a) qPCR and (b) western blotting before co-culture with MDS cells. MMP1 shRNA (both sh1 and sh2) decreased MMP1 expression of MSCs. (c) The percentage of MDS cells in S phase was evaluated by the EdU assay after co-culture with MMP1-KD MSCs (MMP1-sh1 MSCs and MMP1-sh2 MSCs) or negative MSCs (transfected with control lentiviruses) for 72 h. (d) The percentage of apoptotic MDS cells was assayed by Annexin V/PI dual staining after co-culture with MMP1-KD MSCs or negative MSCs for 72 h. (Data represent the mean ± SEM from at least three independent experiments. *P < 0.05; **P < 0.01; ***P < 0.001).
MMP1 affects MDS cell proliferation and apoptosis through interaction with PAR1
PAR1 has been reported to be the target of MMP1. The proliferation of MDS cells was suppressed when exogenous activated MMP1 was added to MDS-MSCs and MDS cells in co-culture (Fig. 4a). Importantly, the proportion of apoptotic MDS cells, as measured by Annexin-V and PI staining, was significantly increased (Fig. 4b). To explore whether the growth suppressing and apoptosis inducing effects of MMP1 were mediated via PAR1, the PAR1 antagonist RWJ56110 was introduced prior to MMP1 addition. MMP1-induced growth inhibition and apoptosis was blocked by the PAR1 antagonist (Fig. 4a and b), thereby demonstrating that the effect of MMP1 on MDS cells was PAR1 dependent.
Figure 4. MMP1 affects proliferation and apoptosis of MDS cells through interaction with PAR1.
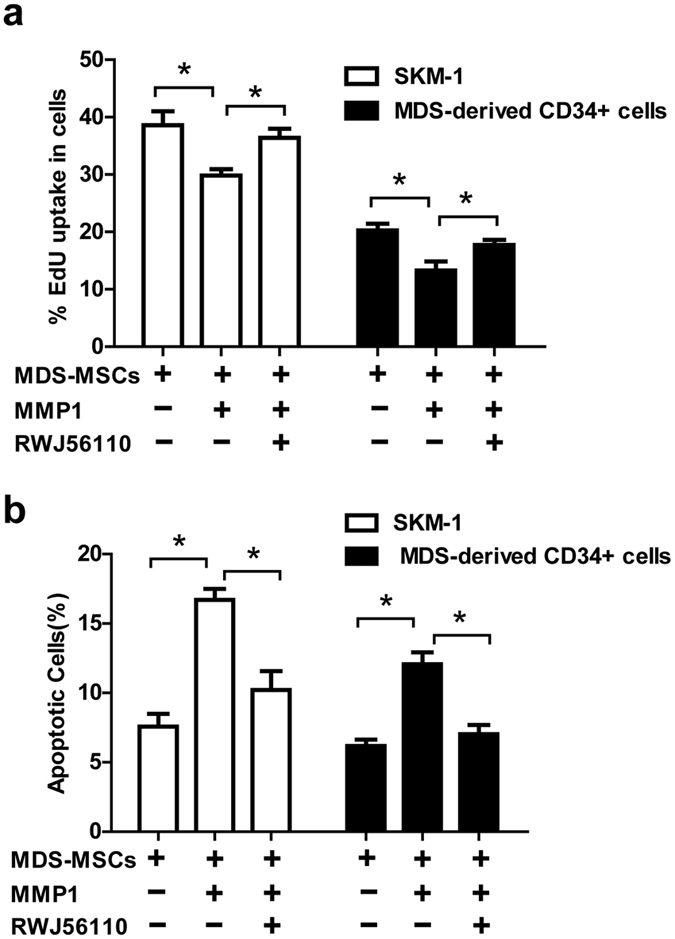
In the MDS-MSC and MDS cells co-culture system, 1 nM exogenous activated MMP1 was added with or without pre-administration of RWJ56110 (5 μM). The percentage of proliferating MDS cells and apoptotic MDS cells was assessed by the EdU assay (a) and Annexin V/PI dual staining (b). (Data represent the mean ± SEM from at least three independent experiments. *P < 0.05).
MMP1/PAR1 exerts an apoptotic effect on MDS cells through the p38 MAPK pathway
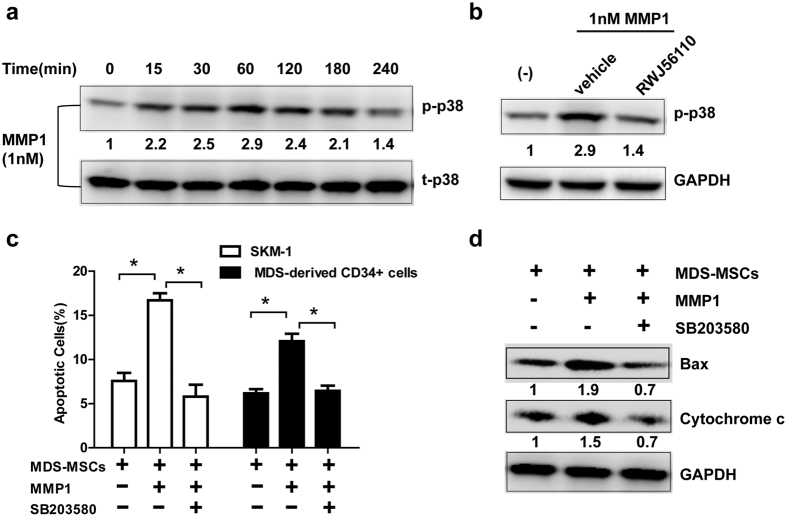
MAPKs have been established as downstream components of the MMP1-PAR1-G protein axis, and the phosphorylation of MAPKs in response to MMP1 has been shown to occur in platelets23. Therefore, we hypothesized that MMP1 can regulate apoptosis by activating the MAPK pathways upon interaction with PAR1. As predicted, treatment of SKM-1 cells with activated MMP1 caused a rapid and robust induction of p38 MAPK phosphorylation which peaked at 1 h upon stimulation and subsided by 4 h (Fig. 5a). RWJ-56110 inhibited the phosphorylation of p38 MAPK induced by MMP1 (Fig. 5b).
Figure 5. MMP1/PAR1 exerts apoptotic effect on MDS cells through the p38 MAPK pathway.
(a) SKM-1 cells were starved overnight in serum free medium and stimulated with 1 nM MMP-1 over a period of 4 hours. Cell lysates were immunoblotted with anti-phospho-p38. Total p38 was used as the loading controls. Numbers below the band of p-p38 represented the relative expression levels of p-p38 at each time point compared with control according to gray scale analysis. (b) SKM-1 cells were pre-treated with 5 μM RWJ56110 and subsequently stimulated with 1 nM MMP-1. Cell lysates were immunoblotted with anti-phospho-p38. GAPDH was used as the loading control. Numbers below the band of p-p38 represented the relative expression levels of p-p38 of each group compared with control according to gray scale analysis. (c) In the MDS-MSCs and MDS cells co-culture system, 1 nM MMP1 was added with or without pre-treatment of p38 inhibitor SB203580 (10 μM). The percentage of apoptotic MDS cells was assessed by Annexin V/PI dual staining. (d) In the MDS-MSCs and SKM-1 cells co-culture system, 1 nM MMP1 was added with or without pre-treatment of the p38 inhibitor SB203580 (10 μM). Cell lysates of SKM-1 were immunoblotted with anti-Bax and anti-Cytochrome c. GAPDH was used as the loading control. Numbers below the band of Bax and cytochrome c represented the relative expression levels of Bax and cytochrome c of each group compared with control according to gray scale analysis. (Data represent the mean ± SEM from at least three independent experiments. *P < 0.05).
Next, we explored the significance of p38 MAPK signalling in the context of MMP1-induced apoptosis. We observed that the p38 inhibitor SB203580 completely reversed the proportion of apoptotic cells induced by MMP1 (Fig. 5c). In addition, the expression of pro-apoptotic proteins, such as Bax and cytochrome c which were increased in response to MMP1, were also blocked by SB203580 (Fig. 5d). These results strongly suggest that MMP1 confers cytotoxicity by activating the PAR1-p38 MAPK pathway. Thus, downregulation of MMP1 in MDS-derived MSCs leads to reduced apoptosis which may result in increased MDS cell proliferation (Fig. 6).
Figure 6. Model of MMP1/PAR1 interaction and subsequent activation of p38 MAPK signalling.
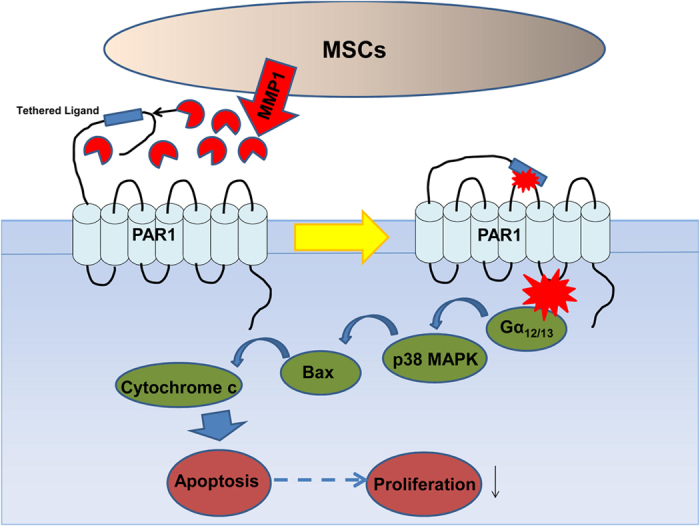
MMP1 which is secreted by MSCs binds to and cleaves the extracellular N terminus of PAR1 to release a tethered ligand. Upon binding to the second extracellular loop, the ligand activates intracellular G proteins (Gα12/13) across the membrane and initiates activation of the p38 MAPK pathway, including the translocation of Bax and release of cytochrome c from the mitochondria, resulting in apoptosis and growth suppression. Therefore, downregulation of MMP1 in MDS-MSCs leads to reduced apoptosis resulting in increased MDS cell proliferation.
Discussion
In this study, we demonstrated that MDS cells proliferated to a greater extent on MDS-MSCs compared with normal control MSCs. Downregulation of MMP1 of MDS-MSCs may partly account for this phenomenon. Either inhibition or knock-down of MMP1 in normal MSCs leads to increased MDS cell growth. MMP1 confers cytotoxicity by activating the PAR1-p38 MAPK pathway.
Recently, studies on MDS-derived MSCs mainly focused on their biological characteristics and hematopoietic support capacities. However, the interactions between MSCs and MDS cells are rarely reported. MSCs have been shown to suppress the proliferation of tumour cells by many researchers27. We demonstrated that MDS cells proliferated to a greater extent on MDS-MSCs compared with normal control MSCs, which may explain the possible pathogenesis of MDS.
Among the mediators released from MSCs, MMPs have been shown to be important regulators of the tumour microenvironment and various tumour-related processes, such as tumour growth, apoptosis, angiogenesis, invasion and metastasis15. MMP1 has been widely reported to be involved in tumour invasion; however, its regulation of cell apoptosis and proliferation has not been well covered in the literature. In this study, we demonstrated that MMP1 played an important role in apoptosis and that downregulation of MMP1 in MDS-MSCs may account for the reduced capacity to restrict proliferation and induce apoptosis of MDS cells. Consistently, Kittang et al.28 also observed decreased levels of MMP1 in high-grade MDS patients compared with low-grade MDS patients, which may support our findings given that high-grade MDS is characterized by the accumulation of blasts.
PAR1 is a G protein coupled receptor that is classically activated by thrombin29. Recently, MMP1 has been discovered to cleave and activate PAR1 at a non-canonical site, triggering Gα12/13-MAPK24. Our results demonstrate that a PAR1 antagonist is able to reverse the growth inhibition and apoptosis effects induced by MMP1, confirming the role of PAR1 in this process. Moreover, p38 MAPK was activated when MDS cells were treated with MMP1. Consistent with our data, Trivedi et al. also showed that exogenously added MMP-1 activated p38 MAPK and its substrate, MAPK-activated protein kinase-2 (MAPKAP-K2), in platelets23.
The role of p38 MAPK in apoptosis depends on the cell type and stimuli30. In some cell types, p38 MAPK has pro-apoptotic effects31,32. The possible mechanisms may involve the translocation or phosphorylation of Bcl-2 family proteins, resulting in the release of cytochrome c from the mitochondria33,34,35, caspase-8 activation induced by transforming growth factor-β36 and modulation of membrane blebbing and nuclear condensation37. In addition, growth arrest and DNA damage (GADD)-inducible genes also mediate the pro-apoptotic effects of p38 MAPK38. In this study, we found that inhibition of p38 MAPK reversed cell apoptosis induced by MMP1, indicating that the apoptosis effect induced by MMP1 was mediated by p38 MAPK. Furthermore, the Bax and cytochrome c protein levels, which were increased by MMP1, were also reversed by p38 MAPK inhibition, suggesting that the Bcl-2 family and cytochrome c may be involved in the mechanism of MMP1-PAR1-p38 MAPK-induced apoptosis.
In summary, our results demonstrate that MMP1 secreted from MSCs exhibits growth inhibition and apoptosis induction effects on SKM-1 cells and MDS-derived CD34 + cells by interacting with PAR1, which further activates p38 MAPK and downstream genes. Thus, reduced expression of MMP1 in MSCs from MDS patients had a decreased capacity to restrict the proliferation of MDS cells, which may account for the malignant proliferation of MDS cells.
Materials and Methods
Ethics Statement
The Ethics Committee of Shanghai Jiao Tong University Affiliated Sixth People’s Hospital approved all of the experimental protocols and methods described here. The study was performed according to the Declaration of Helsinki and the relevant ethical guidelines for research on humans. Informed consent was obtained from all subjects.
Patients and control samples
Patients were diagnosed as MDS in accordance with the minimum diagnostic criteria established by the Conference on MDS39. A total of 50 patients with MDS were included in this study. Their characteristics are detailed in Table 1. Patients were classified for the study as “low-grade” (International Prognostic Scoring System (IPSS)-low/int-1) or “high-grade” (IPSS-int-2/high)40. A total of 23 healthy volunteers were used as controls and were matched by gender and age.
Table 1. Clinical characteristics of MDS patients.
| Parameter | ||
|---|---|---|
| Sex (median value) | Male | 30 |
| Female | 20 | |
| Age (median value) | 61 (21–85) | |
| WHO classification | RA | 2 |
| RARS | 6 | |
| RCMD | 17 | |
| RAEB-1 | 12 | |
| RAEB-2 | 9 | |
| MDS-U | 2 | |
| 5q- MDS | 2 | |
| IPSS | <=1 | 29 |
| >1 | 21 |
Isolation and culture of BM-MSCs
Mononuclear cells (MNCs) were isolated from fresh BM aspirates and separated by a Ficoll-Paque Plus (GE Healthcare, Uppsala, Sweden). MNCs were seeded at an initial concentration of 1 * 106 cells/mL and cultured in Human Mesenchymal Stem Cell Growth Medium (Cyagen Biosciences Inc., Guangzhou, China) supplemented with 10% foetal bovine serum (FBS), glutamine, and 100 U/mL Penicillin-Streptomycin at 37 °C with 5% CO2 in a fully humidified atmosphere. After 72 h, the culture medium was replaced and non-adherent cells were removed. Thereafter, medium was replaced every 3 to 4 d. Upon achieving greater than 80 to 90% confluency, cells were detached with 0.25% trypsin–EDTA (Gibco, Grand Island, NY, USA). At the third passage (P3), adherent BMMSCs were harvested and utilized for experimental analysis. BMMSCs were evaluated by cytometry for the absence of CD34 and CD45 antigens and the presence of CD73, CD90, CD105 and CD166.
Isolation of CD34 + cells
CD34 + cells were isolated by Human CD34 Positive Selection Kit (StemCell Technologies, Vancouver, Canada) from BMMNCs according to manufacturer’s protocol. CD34+ cells purity was evaluated with Fluorescence Activated Cell Sorting (FACS) (BD Biosciences, Franklin Lakes, NJ, USA) and was >90%.
Cell lines and culture
MDS cell line SKM-1 cells were gifted from Prof. Nakagawa. Cell lines were maintained in RPMI-1640 with 10% foetal bovine serum and penicillin(100 units/ml)/streptomycin(100 μg/ml). All cells were maintained in humidified air containing 5% CO2 at 37 °C.
Reagents
Pro-MMP-1 and MMP inhibitor I (FN439) were obtained from Calbiochem (Darmstadt, Germany). Activation of pro-MMP-1 with APMA was performed as described previously21,41. The PAR1 antagonist RWJ-56110 was purchased from Tocris Bioscience (Bristol, UK). The p38 MAPK inhibitor SB203580 was purchased from Selleck Chemicals (Huston, USA).
Proliferation assay
The cell proliferation rates were detected by EdU Flow Cytometry Assay Kits purchased from Life Technologies (Carlsbad, CA, USA). SKM-1 cells or primary CD34 + cells were treated with 10 μM EdU for 1 h and assessed according to the recommended staining protocol. Cells labelled with Alexa Fluor® 647 azide were analysed on a flow cytometer using 633 nm excitation and a 660/20 nm bandpass emission filter.
Cells were counted using a haemocytometer. MDS cells from different time points were collected and resuspended in 1 ml of PBS. One part of 0.4% trypan blue and one part of cell suspension were mixed. A drop of the trypan blue/cell mixture was applied to a haemocytometer. The unstained (viable) cells were counted under a microscope in four 1 × 1-mm squares of one chamber, and the average number of cells per square was determined. The cell count was determined as follows: average cell count per square × dilution factor × 10 ^ 4 = cell count per ml.
Apoptosis assay
The proportion of apoptotic cells was quantified by Alexa Fluor 488 Annexin V/propidium iodide (PI) dual staining (Invitrogen, Carlsbad, CA, USA). Cells were harvested, washed with phosphate-buffered saline (PBS), and re-suspended in 100 μL of binding buffer. Then cells were incubated with 5 μL of Annexin V and 1 μL of PI for 15 minutes in the dark at room temperature. The stained cells were analysed by flow cytometry as soon as possible.
Real-time PCR
Total RNA was extracted using the RNeasy Mini Kit (QIAGEN, Hilden, Germany) following the manufacturer’s instructions. cDNA was synthesized using the Revert Aid TM First Strand cDNA Synthesis Kit (Fermentas, Burlington, Canada) according to the manufacturer’s protocol. PCR was performed with Real Master Mix (Takara, Dalian, China) on an ABI 7500 real-time PCR machine (Applied Biosystems, Foster, CA, USA). The primer sequences are listed in Table 2.
Table 2. Primer sequences for quantitative real-time PCR.
| Genes | Primer sequences(5′ to 3′) |
|---|---|
| MMP1 | Forward primer AAAATTACACGCCAGATTTGCC |
| Reverse primer GGTGTGACATTACTCCAGAGTTG | |
| MMP2 | Forward primer CCCACTGCGGTTTTCTCGAAT |
| Reverse primer CAAAGGGGTATCCATCGCCAT | |
| MMP3 | Forward primer CTGGACTCCGACACTCTGGA |
| Reverse primer CAGGAAAGGTTCTGAAGTGACC | |
| MMP7 | Forward primer GAGTGAGCTACAGTGGGAACA |
| Reverse primer CTATGACGCGGGAGTTTAACAT | |
| MMP8 | Forward primer TGCTCTTACTCCATGTGCAGA |
| Reverse primer TCCAGGTAGTCCTGAACAGTTT | |
| MMP9 | Forward primer TGTACCGCTATGGTTACACTCG |
| Reverse primer GGCAGGGACAGTTGCTTCT | |
| MMP11 | Forward primer CCGCAACCGACAGAAGAGG |
| Reverse primer ATCGCTCCATACCTTTAGGGC | |
| MMP12 | Forward primer GATCCAAAGGCCGTAATGTTCC |
| Reverse primer TGAATGCCACGTATGTCATCAG | |
| GAPDH | Forward primer GCACCGTCAAGGCTGAGAAC |
| Reverse primer GTGGTGAAGACGCCAGTGGA | |
| β-actin | Forward primer ATGTGGCCGAGGACTTGATTGC |
| Reverse primer AGGATGGCAAGGGACTTCCTGTAA |
Western blot analysis
Equal quantities of protein were analysed via 8 to 15% sodium dodecyl sulfate-polyacrylamide gel electrophoresis (SDS-PAGE) and transferred to poly (vinylidene difluoride) membranes. After incubation at 4 °C with primary antibodies against MMP1 (Proteintech Group, Rosemont, IL, USA), p-p38, p38, Bax, Cytochrome c and GAPDH (Cell Signalling Technologies, Boston, MA, USA) overnight, the blots were washed, exposed to corresponding HRP-conjugated secondary antibodies for 1 h, and finally detected by chemiluminescence reagents (Millipore, Billerica, MA, USA).
MMP1 shRNA and cell transductions
Two pLenti X1 Puro-shDicer1-eGFP vectors and plenty X1 puro-shcontrol (negative vector) were constructed by Genechem Company (Shanghai, China). The target sequences against MMP1 were (5′-TTGTGGCTTATGGATTCAT-3′) and (5′-AAGATGAAAGGTGGACCAA-3′). The sequence inserted in the negative control was (5′- TTCTCCGAACGTGTCACGT-3′). The transfection was performed according to the manufacturer’s protocol. MSCs with different genes knocked down were named MMP1-KD MSCs and negative MSCs.
Statistical analysis
All statistical analyses were performed using the SPSS 21.0 System (SPSS Inc., Chicago, IL, USA). Two independent samples were compared using Student’s t test. Multiple pairwise comparisons were performed using one-way analysis of variance (ANOVA). P < 0.05 was considered to be statistically significant.
Additional Information
How to cite this article: Zhao, S. et al. Downregulation of MMP1 in MDS-derived mesenchymal stromal cells reduces the capacity to restrict MDS cell proliferation. Sci. Rep. 7, 43849; doi: 10.1038/srep43849 (2017).
Publisher's note: Springer Nature remains neutral with regard to jurisdictional claims in published maps and institutional affiliations.
Supplementary Material
Acknowledgments
This study was supported in part by the National Natural Science Foundation of China (NNSFC81570108; NNSFC81170463; NNSFC 81400090).
Footnotes
The authors declare no competing financial interests.
Author Contributions Z.S.D., Z.Y.S. and C.C.K. designed this study and wrote this manuscript. Z.S.D., Z.Y.S. and G.J. performed experiments. F.C.M. and Z.Q.Q. analysed the data. L.X. and C.C.K. managed patients and collected clinical samples. All authors reviewed the manuscript.
References
- Malcovati L. et al. Prognostic factors and life expectancy in myelodysplastic syndromes classified according to WHO criteria: a basis for clinical decision making. J Clin Oncol 23, 7594–7603 (2005). [DOI] [PubMed] [Google Scholar]
- Pang W. W. et al. Hematopoietic stem cell and progenitor cell mechanisms in myelodysplastic syndromes. Proc Natl Acad Sci USA 110, 3011–3016 (2013). [DOI] [PMC free article] [PubMed] [Google Scholar]
- Will B. et al. Stem and progenitor cells in myelodysplastic syndromes show aberrant stage-specific expansion and harbor genetic and epigenetic alterations. Blood 120, 2076–2086 (2012). [DOI] [PMC free article] [PubMed] [Google Scholar]
- Raaijmakers M. H. Myelodysplastic syndromes: revisiting the role of the bone marrow microenvironment in disease pathogenesis. Int J Hematol 95, 17–25 (2012). [DOI] [PubMed] [Google Scholar]
- Geyh S. et al. Insufficient stromal support in MDS results from molecular and functional deficits of mesenchymal stromal cells. Leukemia 27, 1841–1851 (2013). [DOI] [PubMed] [Google Scholar]
- Mendez-Ferrer S. et al. Mesenchymal and haematopoietic stem cells form a unique bone marrow niche. Nature 466, 829–834 (2010). [DOI] [PMC free article] [PubMed] [Google Scholar]
- Shiozawa Y., Havens A. M., Pienta K. J. & Taichman R. S. The bone marrow niche: habitat to hematopoietic and mesenchymal stem cells, and unwitting host to molecular parasites. Leukemia 22, 941–950 (2008). [DOI] [PMC free article] [PubMed] [Google Scholar]
- Mhyre A. J., Marcondes A. M., Spaulding E. Y. & Deeg H. J. Stroma-dependent apoptosis in clonal hematopoietic precursors correlates with expression of PYCARD. Blood 113, 649–658 (2009). [DOI] [PMC free article] [PubMed] [Google Scholar]
- Stirewalt D. L. et al. Tumour necrosis factor-induced gene expression in human marrow stroma: clues to the pathophysiology of MDS? Br J Haematol 140, 444–453 (2008). [DOI] [PubMed] [Google Scholar]
- Blau O. et al. Mesenchymal stromal cells of myelodysplastic syndrome and acute myeloid leukemia patients have distinct genetic abnormalities compared with leukemic blasts. Blood 118, 5583–5592 (2011). [DOI] [PMC free article] [PubMed] [Google Scholar]
- Lopez-Villar O. et al. Both expanded and uncultured mesenchymal stem cells from MDS patients are genomically abnormal, showing a specific genetic profile for the 5q- syndrome. Leukemia 23, 664–672 (2009). [DOI] [PubMed] [Google Scholar]
- Li X., Marcondes A. M., Gooley T. A. & Deeg H. J. The helix-loop-helix transcription factor TWIST is dysregulated in myelodysplastic syndromes. Blood 116, 2304–2314 (2010). [DOI] [PMC free article] [PubMed] [Google Scholar]
- Flores-Figueroa E. et al. Functional analysis of myelodysplastic syndromes-derived mesenchymal stem cells. Leuk Res 32, 1407–1416 (2008). [DOI] [PubMed] [Google Scholar]
- Aanei C. M. et al. Focal adhesion protein abnormalities in myelodysplastic mesenchymal stromal cells. Exp Cell Res 317, 2616–2629 (2011). [DOI] [PubMed] [Google Scholar]
- Kessenbrock K., Plaks V. & Werb Z. Matrix metalloproteinases: regulators of the tumor microenvironment. Cell 141, 52–67 (2010). [DOI] [PMC free article] [PubMed] [Google Scholar]
- Ho I. A. et al. Matrix metalloproteinase 1 is necessary for the migration of human bone marrow-derived mesenchymal stem cells toward human glioma. Stem Cells 27, 1366–1375 (2009). [DOI] [PMC free article] [PubMed] [Google Scholar]
- Yu Q. & Stamenkovic I. Cell surface-localized matrix metalloproteinase-9 proteolytically activates TGF-beta and promotes tumor invasion and angiogenesis. Genes Dev 14, 163–176 (2000). [PMC free article] [PubMed] [Google Scholar]
- Mu D. et al. The integrin alpha(v)beta8 mediates epithelial homeostasis through MT1-MMP-dependent activation of TGF-beta1. J Cell Biol 157, 493–507 (2002). [DOI] [PMC free article] [PubMed] [Google Scholar]
- Lopez-Otin C. & Matrisian L. M. Emerging roles of proteases in tumour suppression. Nat Rev Cancer 7, 800–808 (2007). [DOI] [PubMed] [Google Scholar]
- Lopez-Otin C., Palavalli L. H. & Samuels Y. Protective roles of matrix metalloproteinases: from mouse models to human cancer. Cell Cycle 8, 3657–3662 (2009). [DOI] [PMC free article] [PubMed] [Google Scholar]
- Boire A. et al. PAR1 is a matrix metalloprotease-1 receptor that promotes invasion and tumorigenesis of breast cancer cells. Cell 120, 303–313 (2005). [DOI] [PubMed] [Google Scholar]
- Yang E. et al. Blockade of PAR1 signaling with cell-penetrating pepducins inhibits Akt survival pathways in breast cancer cells and suppresses tumor survival and metastasis. Cancer Res 69, 6223–6231 (2009). [DOI] [PMC free article] [PubMed] [Google Scholar]
- Trivedi V. et al. Platelet matrix metalloprotease-1 mediates thrombogenesis by activating PAR1 at a cryptic ligand site. Cell 137, 332–343 (2009). [DOI] [PMC free article] [PubMed] [Google Scholar]
- Hollenberg M. D. et al. Biased signalling and proteinase-activated receptors (PARs): targeting inflammatory disease. Br J Pharmacol 171, 1180–1194 (2014). [DOI] [PMC free article] [PubMed] [Google Scholar]
- Tressel S. L. et al. A matrix metalloprotease-PAR1 system regulates vascular integrity, systemic inflammation and death in sepsis. EMBO Mol Med 3, 370–384 (2011). [DOI] [PMC free article] [PubMed] [Google Scholar]
- Austin K. M., Nguyen N., Javid G., Covic L. & Kuliopulos A. Noncanonical matrix metalloprotease-1-protease-activated receptor-1 signaling triggers vascular smooth muscle cell dedifferentiation and arterial stenosis. J Biol Chem 288, 23105–23115 (2013). [DOI] [PMC free article] [PubMed] [Google Scholar]
- Ramasamy R. et al. Mesenchymal stem cells inhibit proliferation and apoptosis of tumor cells: impact on in vivo tumor growth. Leukemia 21, 304–310 (2007). [DOI] [PubMed] [Google Scholar]
- Kittang A. O., Sand K., Brenner A. K., Rye K. P. & Bruserud O. The Systemic Profile of Soluble Immune Mediators in Patients with Myelodysplastic Syndromes. Int J Mol Sci 17 (2016). [DOI] [PMC free article] [PubMed] [Google Scholar]
- Coughlin S. R. Thrombin signalling and protease-activated receptors. Nature 407, 258–264 (2000). [DOI] [PubMed] [Google Scholar]
- Nebreda A. R. & Porras A. p38 MAP kinases: beyond the stress response. Trends Biochem Sci 25, 257–260 (2000). [DOI] [PubMed] [Google Scholar]
- Valladares A. et al. p38 mitogen-activated protein kinase mediates tumor necrosis factor-alpha-induced apoptosis in rat fetal brown adipocytes. Endocrinology 141, 4383–4395 (2000). [DOI] [PubMed] [Google Scholar]
- Edlund S. et al. Transforming growth factor-beta1 (TGF-beta)-induced apoptosis of prostate cancer cells involves Smad7-dependent activation of p38 by TGF-beta-activated kinase 1 and mitogen-activated protein kinase kinase 3. Mol Biol Cell 14, 529–544 (2003). [DOI] [PMC free article] [PubMed] [Google Scholar]
- Ghatan S. et al. p38 MAP kinase mediates bax translocation in nitric oxide-induced apoptosis in neurons. J Cell Biol 150, 335–347 (2000). [DOI] [PMC free article] [PubMed] [Google Scholar]
- Zhuang S., Demirs J. T. & Kochevar I. E. p38 mitogen-activated protein kinase mediates bid cleavage, mitochondrial dysfunction, and caspase-3 activation during apoptosis induced by singlet oxygen but not by hydrogen peroxide. J Biol Chem 275, 25939–25948 (2000). [DOI] [PubMed] [Google Scholar]
- Torcia M. et al. Nerve growth factor inhibits apoptosis in memory B lymphocytes via inactivation of p38 MAPK, prevention of Bcl-2 phosphorylation, and cytochrome c release. J Biol Chem 276, 39027–39036 (2001). [DOI] [PubMed] [Google Scholar]
- Schrantz N. et al. p38-mediated regulation of an Fas-associated death domain protein-independent pathway leading to caspase-8 activation during TGFbeta-induced apoptosis in human Burkitt lymphoma B cells BL41. Mol Biol Cell 12, 3139–3151 (2001). [DOI] [PMC free article] [PubMed] [Google Scholar]
- Deschesnes R. G., Huot J., Valerie K. & Landry J. Involvement of p38 in apoptosis-associated membrane blebbing and nuclear condensation. Mol Biol Cell 12, 1569–1582 (2001). [DOI] [PMC free article] [PubMed] [Google Scholar]
- Sarkar D. et al. mda-7 (IL-24) Mediates selective apoptosis in human melanoma cells by inducing the coordinated overexpression of the GADD family of genes by means of p38 MAPK. Proc Natl Acad Sci USA 99, 10054–10059 (2002). [DOI] [PMC free article] [PubMed] [Google Scholar]
- Valent P. et al. Definitions and standards in the diagnosis and treatment of the myelodysplastic syndromes: Consensus statements and report from a working conference. Leuk Res 31, 727–736 (2007). [DOI] [PubMed] [Google Scholar]
- Greenberg P. et al. International scoring system for evaluating prognosis in myelodysplastic syndromes. Blood 89, 2079–2088 (1997). [PubMed] [Google Scholar]
- Agarwal A. et al. Targeting a metalloprotease-PAR1 signaling system with cell-penetrating pepducins inhibits angiogenesis, ascites, and progression of ovarian cancer. Mol Cancer Ther 7, 2746–2757 (2008). [DOI] [PMC free article] [PubMed] [Google Scholar]
Associated Data
This section collects any data citations, data availability statements, or supplementary materials included in this article.


