Significance
In many parts of the world, especially in low- and middle-income countries, severe neonatal hyperbilirubinemia (SNH) is associated with substantial mortality and long-term morbidities. Although the immediate and rapid rise in total serum bilirubin (TSB) originating from lysis of red blood cells has been linked to genetic predisposition, preterm births, and blood type incompatibilities, the inability to efficiently metabolize bilirubin results from delayed expression of UDP-glucuronosyltransferase 1A1 (UGT1A1). In this study, the mechanism associated with delayed expression of the human UGT1A1 gene in neonatal mice that are humanized for the UGT1 locus is described. Neonatal humanized UGT1 (hUGT1) mice develop SNH and control TSB levels by nuclear receptor corepressor 1 (NCoR1)-directed repression of intestinal epithelial cell maturation, an event linked to expression of the UGT1A1 gene.
Keywords: humanized UGT1 mice, UDP-glucuronosyltransferase 1A1, IKKβ, kernicterus, encephalopathy
Abstract
Severe neonatal hyperbilirubinemia (SNH) and the onset of bilirubin encephalopathy and kernicterus result in part from delayed expression of UDP-glucuronosyltransferase 1A1 (UGT1A1) and the inability to metabolize bilirubin. Although there is a good understanding of the early events after birth that lead to the rapid increase in serum bilirubin, the events that control delayed expression of UGT1A1 during development remain a mystery. Humanized UGT1 (hUGT1) mice develop SNH spontaneously, which is linked to repression of both liver and intestinal UGT1A1. In this study, we report that deletion of intestinal nuclear receptor corepressor 1 (NCoR1) completely diminishes hyperbilirubinemia in hUGT1 neonates because of intestinal UGT1A1 gene derepression. Transcriptomic studies and immunohistochemistry analysis demonstrate that NCoR1 plays a major role in repressing developmental maturation of the intestines. Derepression is marked by accelerated metabolic and oxidative phosphorylation, drug metabolism, fatty acid metabolism, and intestinal maturation, events that are controlled predominantly by H3K27 acetylation. The control of NCoR1 function and derepression is linked to IKKβ function, as validated in hUGT1 mice with targeted deletion of intestinal IKKβ. Physiological events during neonatal development that target activation of an IKKβ/NCoR1 loop in intestinal epithelial cells lead to derepression of genes involved in intestinal maturation and bilirubin detoxification. These findings provide a mechanism of NCoR1 in intestinal homeostasis during development and provide a key link to those events that control developmental repression of UGT1A1 and hyperbilirubinemia.
UDP-glucuronosyltransferase 1A1 (UGT1A1), the only transferase capable of conjugating bilirubin (1), is developmentally delayed in newborn children (2). Thus, ∼80% of newborns have some form of hyperbilirubinemia (3, 4). Most cases have a benign outcome except in situations when the rapid onset of severe neonatal hyperbilirubinemia (SNH) is not monitored nor prevented. Shortly after birth, an increase in red blood cell turnover occurs where heme is released from hemoglobin and further degraded by heme oxygenase to carbon monoxide and biliverdin, which is further reduced by biliverdin reductase to bilirubin (5). Once in the circulation, bilirubin is absorbed into tissues such as the liver. Hyperbilirubinemia develops when a rise in total serum bilirubin (TSB) levels exceeds the capacity of hepatic UGT1A1 to drive bilirubin conjugation, an event that leads to the excretion of the glucuronide by MRP2 (6) into the biliary channels for deposit in the gastrointestinal tract. Thus, bilirubin glucuronidation is the rate-limiting step in bilirubin excretion. Major risk factors that lead to the onset of SNH include accelerated hemolysis (7) brought on by Rhesus disease and ABO incompatibility, glucose-6-phoshpate dehydrogenase (G6PD) deficiency, infections, in addition to breast feeding and premature birth (7–11). Extreme levels of TSB can lead to early or acute bilirubin encephalopathy (ABE) (12), presented early as lethargy and poor feeding, but can progress to hypo- and hypertonia, high-pitched crying, muscle spasms, opisthotonus, seizures, and even death (13). The more chronic form, which proceeds ABE, is termed kernicterus (14). Affected individuals are characterized by choreoathetoid cerebral palsy; display dystonic/athetoid movement disorders, hearing loss, ocular motor defects, hypotonia, and ataxia; and have been linked to cerebellar involvement (5, 13–15). Severe hyperbilirubinemia, which leads to ABE and kernicterus, has been observed world wide (14), with the highest incidences being recorded in sub-Saharan Africa and South Asia (10, 16). A report from the Nigerian Society of Neonatal Medicine suggests that extreme hyperbilirubinemia accounts for at least 5% of all neonatal mortalities in Nigeria (16). Recent evidence shows that SNH, estimated to impact over 1 million children every year, is associated with substantial mortality and permanent morbidities (10). Although conventional therapies entail aggressive light therapy or blood transfusions once SNH has been diagnosed (5), the inability to effectively conjugate bilirubin resulting from development delay in expression of UGT1A1 ultimately leads to bilirubin-induced neurological toxicity. Although genetic predisposition and environmental influences play key roles in driving TSB levels to potentially toxic levels, an understanding of the developmental events that regulate UGT1A1 expression have remained a mystery.
Humanized UGT1 locus (hUGT1) mice, which express all nine UGT1A genes including UGT1A1, develop SNH (17). It is well established that the UGT1A1 gene contains a series of nuclear receptor (NR) binding sequences recognized by the pregnane X receptor (PXR) (18, 19), the constitutive androstane receptor (CAR) (18, 20), and the peroxisome proliferator–activator receptor (PPARα) (21). Thus, activation of these receptors by chemical ligands during the neonatal period leads to derepression of UGT1A1 and clearance of TSB. Although the function of these receptors in control of UGT1A1 expression is not entirely clear, we recently linked delayed expression of hepatic UGT1A1 during the developmental stage to PXR-mediated transcriptional silencing (19). When the Pxr gene was deleted in hUGT1 mice, newborn hUGT1/Pxr−/− mice showed elevated hepatic UGT1A1 and reduced TSB levels, demonstrating that PXR participated in developmental repression of the UGT1A1 gene. Transcriptional silencing or repression is largely achieved by two prototypical NR corepressors, silencing mediator of retinoid and thyroid hormone receptors (SMRT) and nuclear receptor corepressor 1 (NCoR1), suggesting that NCoR1/SMRT played a role in control of UGT1A1 expression.
NCoR1 interacts with NRs and collectively controls gene expression patterns by recruiting chromatin-modifying enzymes to limit nucleosomal DNA accessibility and transcriptional activation (22, 23). Upon ligand binding, NRs release NCoR1 and recruit additional coactivators that cooperate with a different set of chromatin-modifying enzymes to promote transcription activation (23). Although global NCoR1 knockout is embryonic lethal (24), studies with tissue-specific knockout mice lacking NCoR1 in liver (25, 26), muscle (27), adipocyte (28), or macrophage (29) have uncovered its role in repression of a set of NRs including the thyroid receptor (TR), retinoic acid receptor (RAR), PPARs (30, 31), estrogen related receptor α (ERRα) (32), and liver X receptor (LXR) (33, 34). These receptors and NCoR1 control numerous biological pathways involving thyroid hormone signaling, lipid homeostasis, muscle endurance, and developmental regulation.
An important role for NCoR1 in regulating UGT1A1 gene expression in neonates has emerged as we initially discovered that loss of NCoR1 in the intestine, but not the liver, ameliorates neonatal hyperbilirubinemia in hUGT1 mice. Here, we document that NCoR1 mediates repression of UGT1A1 and other genes associated with multiple signaling pathways, biological processes, and intestinal maturation. By integrating transcriptome data, genome-wide maps of histone marks, and biochemical characterization of intestinal tissue, our results show that NCoR1 orchestrates a sophisticated epigenetic regulatory scheme from which complex and dynamic biological processes take place, all of which are followed by dramatic reduction in neonatal hyperbilirubinemia.
Results
Intestinal-Specific NCoR1 Deletion Ameliorates Neonatal Hyperbilirubinemia in Mice with a hUGT1 Background.
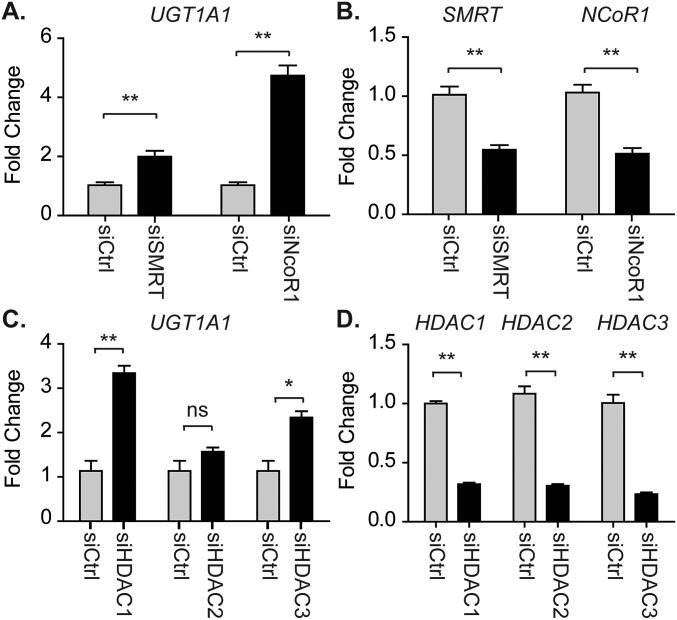
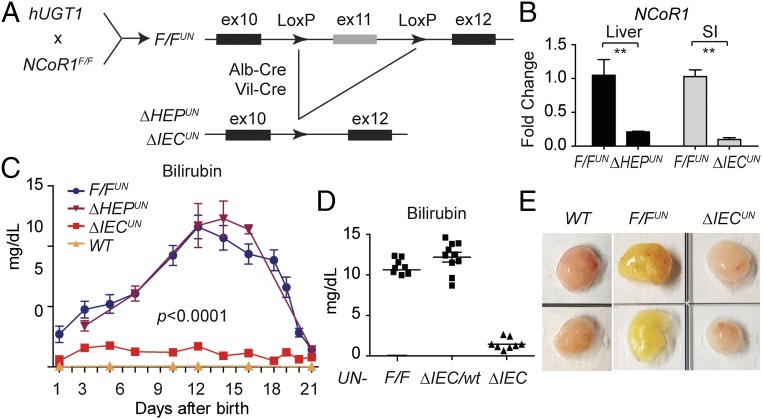
Humanized mice harboring the UGT1 locus encoding nine functional UGT1A proteins—including UGT1A1—in a Ugt1-null background, termed hUGT1 mice, develop neonatal hyperbilirubinemia (17, 35) because of delayed UGT1A1 expression in both the liver and GI tract. We demonstrated that knockdown of SMRT and NCoR1 in primary neonatal hepatocytes by siRNA leads to derepression of UGT1A1 (Fig. S1 A and B). Similar effects are seen after HDAC1 or HDAC3 ablation (Fig. S1 C and D). These findings implicate NCoR1 along with HDAC1/3 in controlling UGT1A1 gene expression. We first generated floxed NCoR1 mice under a hUGT1 background (TgUGT1/Ugt1−/−/NCoR1F/F), named as F/FUN, and then further knocked out NCoR1 in liver (ΔHEPUN mice) and intestinal tissue (ΔIECUN mice) of hUGT1 mice (Fig. 1 A and B). When we examined TSB levels in neonatal mice, we found that wild-type F/FUN and ΔHEPUN mice exhibited a similar pattern of neonatal hyperbilirubinemia as hUGT1 mice (Fig. 1C). Bilirubin accumulation in these mice was observed as early as postnatal day 1 (P1). TSB levels gradually increased, reaching ∼12 mg/dL at P14, then declined rapidly after P18 and eventually returned to a normal range (less than 2 mg/dL) at P21. Strikingly, following intestinal-specific deletion of NCoR1, the development of neonatal hyperbilirubinemia was completely diminished in ΔIECUN mice (Fig. 1C). The reduction of TSB levels in ΔIECUN mice was exclusively the result of the NCoR1 intestinal deletion, as hUGT1/NCoR1ΔIEC/wt mice still exhibited high levels of TSB (Fig. 1D). The resulting bilirubin clearance in ΔIECUN mice also had a significant effect on its accumulation in fat tissue compared with that in control F/FUN mice (Fig. 1E).
Fig. S1.
Gene siRNA knockdown in hepatocytes isolated from hUGT1 neonates at D12. (A–D) Primary hepatocytes were isolated from hUGT1 neonates at D12 and then treated with gene-specific siRNA. Forty-eight hours later, RNA was isolated for RT-QPCR analyses. Data were analyzed using Student’s t test and are expressed as mean ± SEM (n = 3); ns, no significance; *P < 0.05; **P < 0.01.
Fig. 1.
Tissue-specific NCoR1 deletion in hUGT1 mice. (A) Scheme for the generation of tissue-specific NCoR1 deletion in hUGT1 mice (hepatocytes, ΔHEPUN or intestinal epithelial cells, ΔIECUN). (B) RT-QPCR of NCoR1 in livers from F/FUN and ΔHEPUN mice or intestines from F/FUN and ΔIECUN mice (n = 5). **P < 0.01 (Student’s t test). (C) TSB levels during neonatal development. Data are expressed as mean ± SEM (n = 4–10). Two-way ANOVA analysis for ΔIECUN versus F/FUN, P < 0.0001. (D) TSB levels from mice at P12. (E) Fat tissue collected from mice at day 12; yellow staining depicts bilirubin accumulation.
Developmental Stage-Dependent Derepression of UGT1A1 Expression Resulting from Intestinal NCoR1 Deletion.
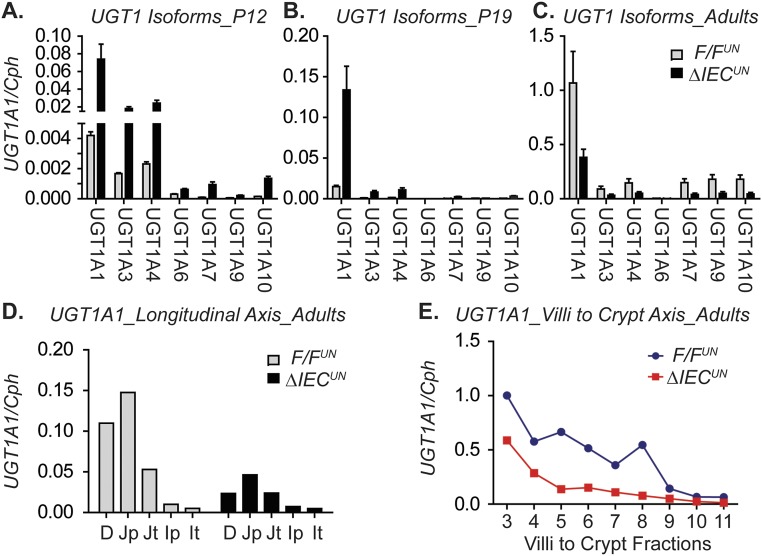
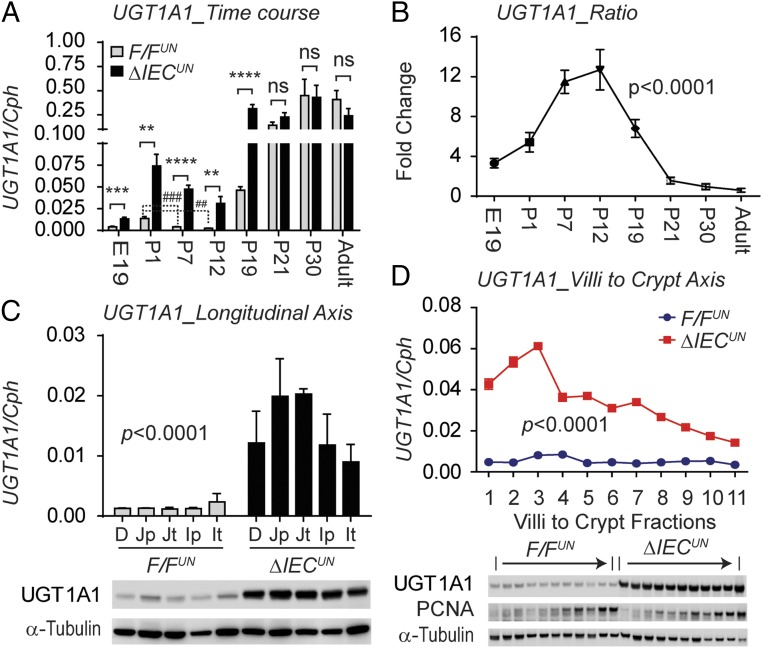
Up-regulation of the intestinal UGT1A genes in ΔIECUN neonates in comparison with the F/FUN littermate controls as determined by reverse transcription-quantitative polymerase chain reaction (RT-QPCR) analysis suggests the occurrence of transcriptional derepression of the UGT1A locus in ΔIECUN intestines (Fig. S2 A and B). In particular, the induction of intestinal UGT1A1 in ΔIECUN mice is most prominent throughout the developmental stage, starting at embryonic day 19 (E19) and continuing through to P19 (Fig. 2 A and B). The prominent derepression of the UGT1A1 gene in ΔIECUN neonates at P12 is clearly demonstrated in both the longitudinal axis and the crypt–villi axis (CVA) (Fig. 2 C and D). However, derepression of UGT1A1 expression in the absence of NCoR1 did not occur after weaning or in adulthood (Fig. 2 A and B and Fig. S2 C–E). Eventually, the UGT1A1 gene was expressed even in NCoR1-positive mice, suggesting that derepression of intestinal UGT1A1 following NCoR1 deletion is age-dependent, only taking place in the embryonic and suckling periods and having a direct impact on bilirubin glucuronidation in ΔIECUN neonates.
Fig. S2.
Intestinal expression of UGT1A and NCoR1 genes. (A–C) Gene expression of human UGT1 isoforms in SI from F/FUN and ΔIECUN neonates at P12 and P19 and in adult mice. (D and E) Intestinal UGT1A1 gene expression along the longitudinal axis and along the CVA in adult mice (three mice of each strain, pooled).
Fig. 2.
Developmental stage-dependent derepression of the UGT1A1 gene resulting from intestinal NCoR1 deletion. (A) RT-QPCR of human UGT1A1 gene expression in SI at E19 and IECs of mice at P1, P7, P12, P19, P21, P30, and week 10 (n = 4–10, Student’s t test). ns, nonsignificant; **P < 0.01; ***P < 0.001; ****P < 0.0001; ##P < 0.01; ###P < 0.001. (B) UGT1A1 fold of change (one-way ANOVA, P < 0.0001). (C) IECs isolated from different SI sections, including duodenum (D), proximal and terminal jejunum (Jp and Jt), and ileum (Ip and It) (n = 3). Shown are RT-QPCR of human UGT1A1 gene (two-way ANOVA analysis, P < 0.0001) and Western blots of UGT1A1 and α-tubulin. (D) IECs were isolated sequentially along the CVA from neonatal mice at P12. Shown are RT-QPCR of human UGT1A1 gene (two-way ANOVA analysis, n = 3) and Western blots.
NCoR1 Deletion Alters Lipid and Energy Metabolism in ΔIECUN Neonates, Primarily Through Modification of Histone Acetylation.
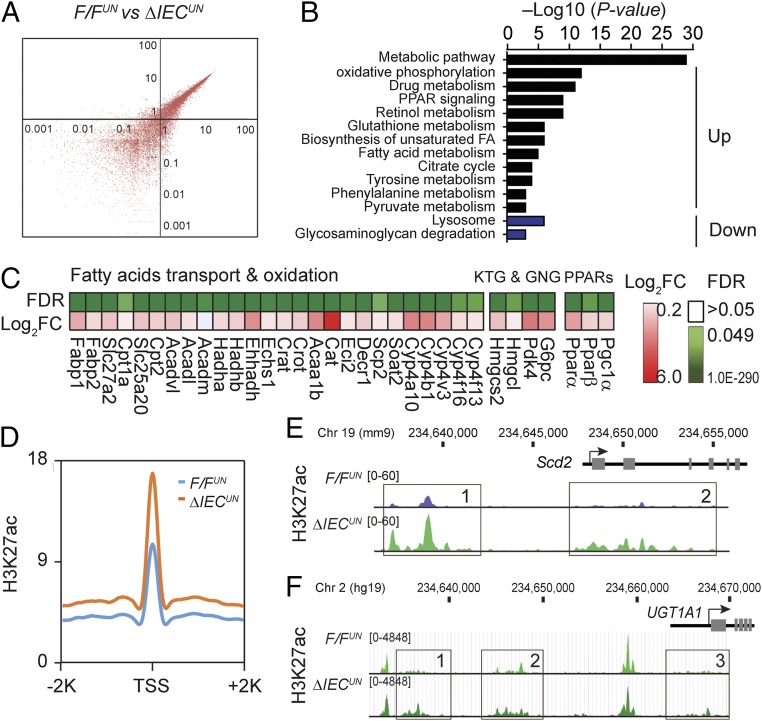
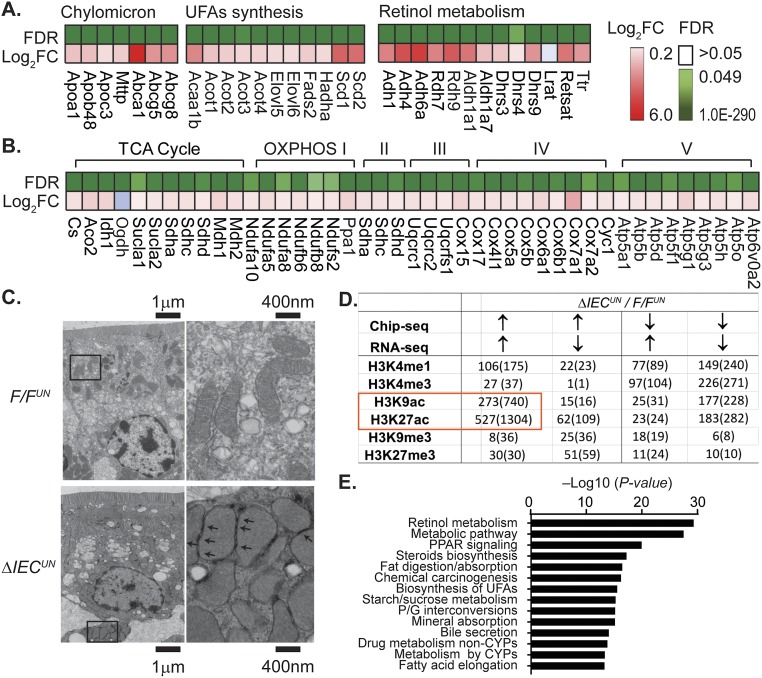
To explore the molecular events following deletion of NCoR1 in intestinal tissue, we performed global transcriptional profiling in F/FUN and ΔIECUN mice using RNA-sequencing (RNA-seq) technology. The scatter plot (Fig. 3A) showed considerable variability in gene expression between F/FUN and ΔIECUN mice. With a false discovery rate (FDR) of <0.05, 1,023 genes were up-regulated and 830 genes were down-regulated (n = 3). Gene ontology analysis identified that the metabolic pathway was the most significantly altered pathway in ΔIECUN mice, followed by oxidative phosphorylation (OXPHOS) and drug metabolism (Fig. 3B). Deleting NCoR1 promotes expression of PPARα target genes but also enhances expression of Pparα, Pparβ, and their coactivator Pgc1α (Fig. 3C), which would have an extensive impact on FA and energy metabolism. Many other lipid metabolism-associated genes that are subject to LXRα regulation were also derepressed significantly in ΔIECUN intestines, such as cholesterol transport-related genes, and genes associated with unsaturated FA synthesis and lipogenesis (Fig. S3A); genes related to the retinol metabolism pathway are largely regulated through RAR following the deletion of NCoR1 (Fig. S3A). Messenger RNA levels of TCA cycle genes and OXPHOS genes were coordinately increased in ΔIECUN neonates (Fig. S3B). When we examined mitochondria by electron microscopy, mitochondria in IECs were tethered with adjacent mitochondria and displayed more compacted cristae than those in F/FUN IECs (Fig. S3C). The mitochondrial organization in IECs of ΔIECUN mice may structurally enhance the interactions between adjacent mitochondria to allow more efficient energy transfer and communication. The deletion of intestinal NCoR1 leads to derepression of genes related to lipid and energy metabolism, simultaneously boosting both FA metabolism and lipogenesis.
Fig. 3.
Global transcriptomic alterations of ΔIECUN neonates and ChIP-seq analysis. SI were collected from mice at P12 for RNA-seq. (A) Scatter plot analysis. (B) KEGG pathway enrichment analysis; expression heat map of a subset of key genes in the biological processes including (C) fatty acid transport and oxidation, ketogenesis (KTG), and glyconeogenesis (GNG). Pink color represents the Log2 fold of change (Log2FC), and the green color represents the FDR. (D–F) Chip-seq analysis on F/FUN and ΔIECUN neonates at P12. (D) Average profile of H3K27Ac near up-regulated genes. (E and F) Representative distribution of H3K27Ac at selected Scd2 gene against reference genome mm9 and human UGT1A1 gene against reference genome hg19.
Fig. S3.
Representative pathways of RNA-seq analysis and the correlation of RNA-seq with ChIP-seq. (A) Expression heat map from RNA-seq analysis, including a subset of key genes in the biological processes such as chylomicron and unsaturated FA (UFA) synthesis and retinol metabolism. (B) Citric acid (TCA) cycle and OXPHOS. (C) Electron microscope images of jejunum (arrows, mitochondria–mitochondria tethering). (D and E) IECs were isolated from the entire SI from F/FUN and ΔIECUN neonates at P12. Chip-seq analysis was carried out by using different histone marks. (D) Correlation analysis between Chip-seq and RNA-seq data of ΔIECUN neonates; data described as number of genes (number of identified peaks). (E) KEGG pathway analysis of the commonly up-regulated genes identified in H3K27ac ChIP-seq.
These global transcriptomic alterations were further confirmed when we carried out ChIP-sequencing (ChIP-seq) analyses in IECs isolated from F/FUN and ΔIECUN mice to assess histone modifications across the genome. We examined histone marks associated with active transcription toward acetylated H3K27ac and H3K9ac, methylated H3K4me3 and H3K4me1, as well as transcriptional repression through H3K9me3 and H3K27me3. The most significant changes resulting from NCoR1 deletion were revealed in H3K27ac levels with the identity of 527 genes and 1,304 elevated peaks generated across the genome (Fig. S3D), which are associated with transcriptional activation of over 50% of genes in ΔIECUN intestines identified by RNA-seq analyses and the similar KEGG analysis (Fig. S3E). The derepressions were significantly increased in transcription start site (TSS) regions of genes that were up-regulated in ΔIECUN mice (Fig. 3D). The increase in identified sequence is illustrated with the Scd2 gene and the human UGT1A1 gene (Fig. 3 E and F). These data collectively indicate that removing the corepressor NCoR1 changes the chromatin structure and promoter accessibility—primarily through acetylation modification—resulting in alteration in transcription activities of NCoR1-targeted genes.
Differential Gene Regulation in Neonatal Versus Adult ΔIECUN Mice.
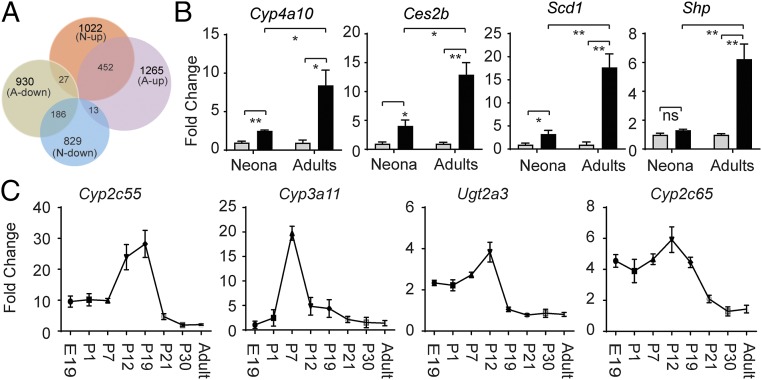
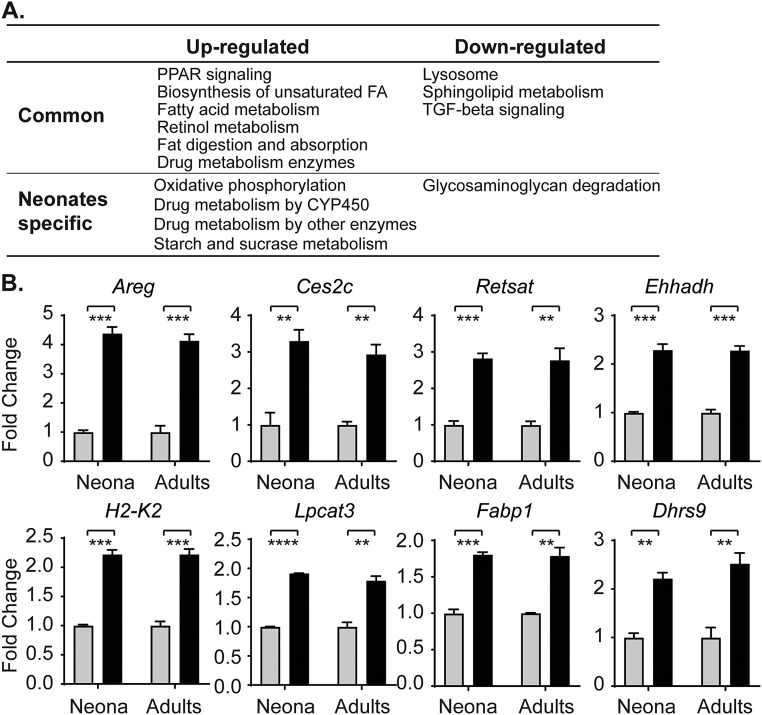
Although we have confirmed that UGT1A1 is also a target gene of PPARα and LXRα/β, we considered that the activation of these NRs may target the UGT1A1 gene and lead to its developmental-dependent derepression. To examine this possibility in greater detail, RNA-seq experiments were conducted using intestinal tissue from adult F/FUN and ΔIECUN mice. From the 1,022 genes up-regulated in neonatal tissue and the 1,265 genes up-regulated in adult tissue following NCoR1 deletion, there were 462 common genes (Fig. 4A), among which key biological processes involved in membrane synthesis, FA metabolism and transport, retinol synthesis, and PPAR signaling were shared between neonatal and adult tissue in NCoR1-deleted IECs (Fig. S4A), with some specific genes demonstrated in Fig. S4B. In contrast, other regulatory patterns as illustrated by the Cyp4a10 gene were enhanced in adult ΔIECUN mice (Fig. 4B). More interestingly, a host of genes encoding proteins linked to drug metabolism were highly derepressed in ΔIECUN neonates but much less affected in adult mice. When we analyzed the expression profiles of a few representative genes in this class (i.e., Cyp2c55, Cyp2c65, Cyp3a11, Ugt2a3) at various developmental stages, we found that the derepression of these genes, which peaked in the middle suckling period, was developmentally stage-dependent in ΔIECUN neonates, remarkably like the derepression pattern of UGT1A1 (Fig. 4C). These results suggest that NCoR1 expression impacts gene expression differentially between neonatal and adult mice.
Fig. 4.
Common and differential gene regulation of ΔIECUN mice following development. (A) Venn diagram to compare RNA-seq data from both neonatal mice (N) and adult mice (A). (B) RT-QPCR analysis demonstrated the progressive enhancement of gene regulation in neonatal versus adult mice (gray bar, F/FUN; black bar, ΔIECUN). ns, nonsignificant; *P < 0.05; **P < 0.01 (Student's t test). (C) Small intestines were collected and pulverized for total RNA extraction of mice at different developmental stages, followed by RT and QPCR analysis.
Fig. S4.
Neonatal to adult gene expression patterns. (A) KEGG pathway analysis of the commonly regulated genes and genes specifically regulated in neonates. (B) Mice were killed on day 12 (neonates) or week 10 (adults). Small intestines were collected and pulverized for total RNA extraction, followed by RT and QPCR analysis (n = 3). **P < 0.01, ***P < 0.001 (Student’s t test). Gray square, F/FUN; black square, ΔIECUN.
NCoR1 Deletion Accelerates IEC Migration and Cell Maturation.
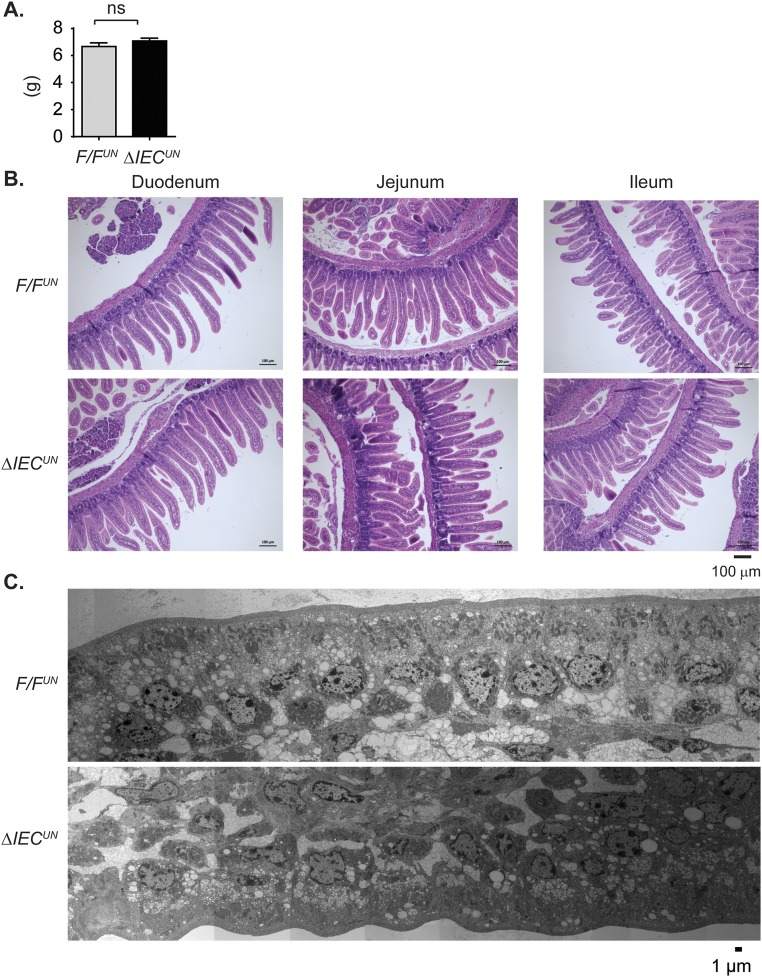
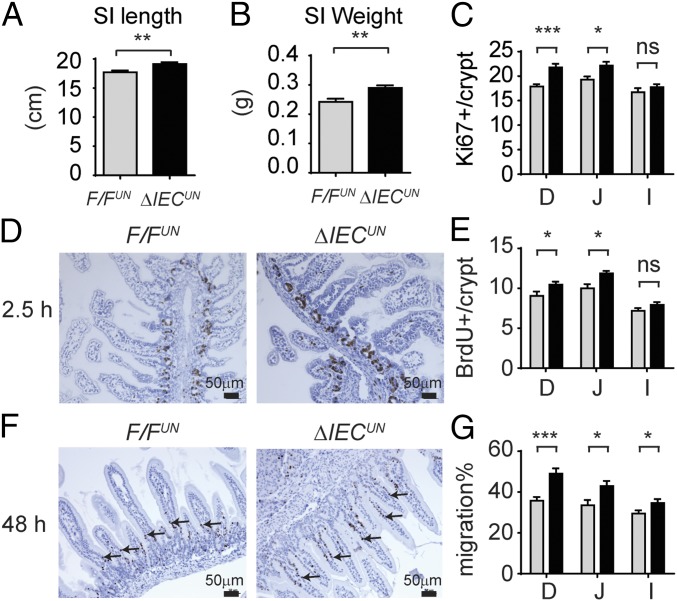
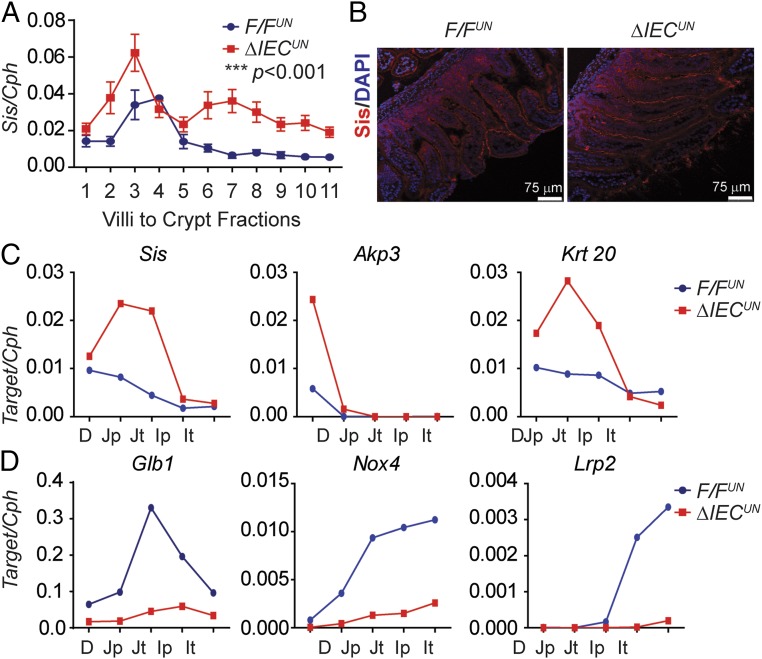
Analysis of gene expression profiles further enlightened our speculation that NCoR1 deletion led to precocious development of the intestines. There were no differences in total body weight between F/FUN and ΔIECUN littermates at P12 (n = 10, P > 0.05) (Fig. S5A); however, the average length of the small intestine was ∼8% longer (n = 10, P < 0.01) (Fig. 5A), and the average weight of the intestines ∼15% greater (n = 10, P < 0.01) in ΔIECUN (Fig. 5B). H&E-stained intestinal sections displayed similar morphological characteristics between F/FUN and ΔIECUN mice (Fig. S5B), and well-developed brush border and microvilli were visualized by electron microscopy (Fig. S5C). The effect of NCoR1 on cellular proliferation was evaluated by Ki-67 immunostaining and BrdU incorporation. Ki-67–positive proliferating cells were slightly increased in both duodenum and jejunum but not ileum of ΔIECUN mice, compared with those in F/FUN mice (Fig. 5C). After neonatal mice were exposed to BrdU for 2.5 h, the number of BrdU-positive cells had increased by 15.6% in duodenum and 18.7% in jejunum in ΔIECUN mice (n = 5, P < 0.05), with no significant difference being observed in ileum (Fig. 5 D and E). After 48 h BrdU exposure, BrdU-positive cells migrated a significantly greater length in duodenum, jejunum, and ileum of ΔIECUN mice than those of F/FUN mice (n = 4, P < 0.05) (Fig. 5 F and G). The results demonstrated that NCoR1 deletion accelerated cell proliferation and promoted epithelial cell migration in ΔIECUN mice. Sucrase isomaltase (Sis), a brush border glucosidase, only exists in differentiated duodenal and jejunal enterocytes and has been used as a marker of enterocyte maturation (36, 37). Sis gene expression along the CVA was up-regulated in ΔIECUN mice (Fig. 6 A and B). Elevated Sis expression was also observed longitudinally in both duodenum and jejunum in ΔIECUN (Fig. 6C). Up-regulation of other maturation markers in ΔIECUN, including the duodenal-specific Akp3 gene and jejunal-specific Krt20 gene (38–41), further supports the occurrence of cell maturation in the absence of NCoR1 (Fig. 6C). In addition, expression of Glb1, Nox4, and Lrp2, which is down-regulated at the suckling to weaning transition (38, 39), was also decreased in ΔIECUN (Fig. 6D). Altered expression of these genes is indicative of intestinal tissue maturation.
Fig. S5.
Impact of NCoR1 on body weight and intestinal tissue of mice at P12. (A) Body weight (n = 10). ns, nonsignificant. (B) H&E staining of the paraffin sections of duodenum, jejunum, and ileum. (C) Electron microscope images of jejunum (images were taken by Serial EM, then constructed and binned).
Fig. 5.
NCoR1 deletion accelerates migration of IECs. SI length (A) and weight (B) of F/FUN and ΔIECUN mice at P12 (n = 10). (C) Immunofluorescent stainings of Ki67 in frozen sections of duodenum (D), jejunum (J), and Ileum (I), and Ki67-positive cells were counted and described as averages ± SEM (n = 5). (D and E) F/FUN and ΔIECUN at P12 were treated with BrdU through i.p. injection at 0.5 mg/mice. After 2.5 h, sections of SI were prepared for paraffin embedding. Paraffin sections were stained with a BrdU antibody, and BrdU-positive cells were counted (n = 5, Student’s t test). (F and G) Mice at P10 were treated with BrdU. Forty-eight hours later, samples were prepared for BrdU staining. The migration of BrdU-positive cells was measured and described as a percentage of villi length (n = 5, Student’s t test analysis). ns, nonsignificant; *P < 0.05; **P < 0.01; ***P < 0.001.
Fig. 6.
NCoR1 deletion accelerates cell maturation of IECs. (A) IECs were isolated sequentially along the CVA in mice at P12, followed by RT-QPCR of Sis gene expression with two-way ANOVA analysis (n = 3). ***P < 0.001. (B) IF staining of Sis (red) in intestine frozen sections, counterstained with DAPI (blue). (C and D) IECs were isolated from different SI sections in mice at P12 (n = 3, samples were pooled). RT-QPCR analysis of Sis, Akp3, Krt20 (J), and Glb1, Nox4, Lrp2 (K) were carried out.
NCoR1 Expression Is Regulated by Activation of Intestinal Kinase Activity.
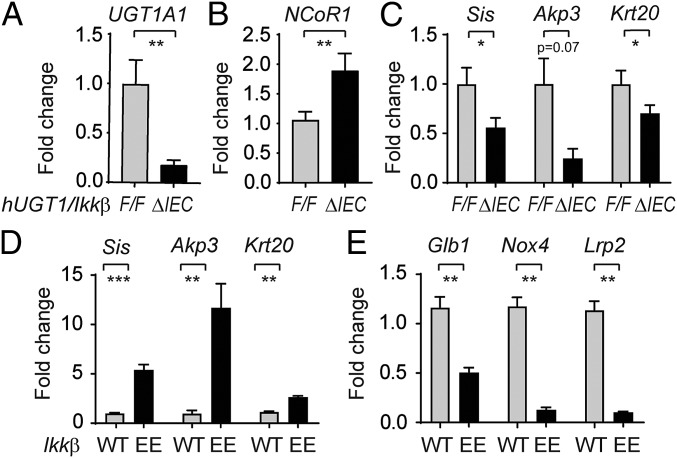
The linkage recently disclosed between the phosphorylation of NCoR1 by IKK leading to the cytoplasmic accumulation of NCoR1 (42) urged us to evaluate the potential involvement of NCoR1 in IKKβ deletion-induced UGT1A1 repression. We had previously demonstrated the targeted deletion of intestinal IKKβ in hUGT1/IkkβΔIEC mice leads to greater neonatal accumulation of TSB (43). The increase in TSB levels in neonatal hUGT1/IkkβΔIEC mice is a direct result of the reduction in intestinal UGT1A1 expression (Fig. 7A). RT-QPCR analysis demonstrated that following deletion of intestinal IKKβ in hUGT1/IkkβΔIEC mice, intestinal NCoR1 gene expression was significantly induced (Fig. 7B). Because of this change, superrepression initiated by NCoR1 was apparent in decreased gene expression of UGT1A1, along with other target genes, including Scd1, Scd2, Hmgcs2, Cpt1a, and Cyp4a10 (Fig. S6). Several of the small intestine maturation markers, including Sis, Akp3, and Krt20, were also significantly down-regulated in hUGT1/IkkβΔIEC mice (Fig. 7C). The absence of IKKβ in hUGT1/IkkβΔIEC mice reverses gene expression patterns that are observed in ΔIECUN mice, demonstrating that NCoR1 in hUGT1/IkkβΔIEC mice has enhanced transcriptional repressive properties.
Fig. 7.
Impact of IKKβ on the expressions of NCoR1 and intestinal maturation genes. (A–C) Intestine samples were collected from both 12-d-old control and hUGT1/IkkβΔIEC mice (n = 5). RT-QPCR was carried out to determine gene expression patterns of UGT1A1, NCoR1, and intestinal maturation markers. (D and E) SI were collected from mice carrying the constitutive active IKKβ (n = 6) at 12 d old. RT-QPCR was performed to determine the gene expressions of both up- and down-regulated intestinal maturation markers. *P < 0.05; **P < 0.01; ***P < 0.001 (Student's t test).
Fig. S6.
Gene expression in hUGT1/IkkβΔIEC mice. RT-QPCR of intestinal tissues collected from both hUGT1/IkkβF/F and hUGT1/IkkβΔIEC mice at 12 d old (n = 5). *P < 0.05 (Student’s t test).
A cDNA clone encoding a constitutively active variant of IKKβ was cloned into plasmid containing the 12.4-kb Villin promoter and used to generate IKKβ(EE)IEC transgenic mice that expressed constitutively active IKKβ in IECs (44). When we examined constitutively active intestinal IKKβ activity in IKKβ(EE)IEC neonates at P12, IEC maturation marker genes Sis, Akp3, and Krt20 were dramatically induced, and Glb1, Nox4, and Lrp2 genes are significantly reduced in IKKβ(EE)IEC mice compared with their wild-type littermates (Fig. 7 D and E), a pattern like that observed in ΔIECUN mice. These findings strongly implicate a role for IKKβ-directed phosphorylation in control of NCoR1 function during neonatal intestinal development.
Discussion
SNH is of significant clinical concern in many parts of the world and is associated with substantial mortality and morbidity in low- and middle-income countries (LMICs) (16). Recent comprehensive reviews that examined the burden of SNH in LMICs have shown very limited progress on the epidemiological profile since earlier reports over 55 y ago (16). For the most part, an understanding of the environmental and genetic parameters that lead to the rapid rise in TSB levels has been the primary focus in attempting to describe the mechanisms leading to hyperbilirubinemia, with limited insight on those events that developmentally limit expression of UGT1A1. An important inroad toward examining the cellular and molecular mechanisms that control the metabolism of bilirubin has been accomplished by the development of hUGT1 mice (17), an animal model that can be used to replicate SNH and characterize the events controlling UGT1A1 expression. It is now understood that delayed expression of hepatic UGT1A1 in neonatal hUGT1 mice is a controlled event, with the UGT1A1 gene being actively repressed through participation with PXR (19). We have previously reported that complete interruption of the hepatic Ugt1 locus through targeted knockout in Ugt1ΔHEP mice is not sufficient to induce SNH (45), implicating an important role for the metabolism and clearance of bilirubin by other tissues. Indeed, selective induction of only intestinal UGT1A1 in neonatal hUGT1 mice is sufficient to reverse SNH (35, 43). This finding, and others, provides evidence that intestinal UGT1A1 is repressed during development but can be successfully induced to alter bilirubin metabolism and reverse the development of hyperbilirubinemia.
The centerpiece in controlling intestinal UGT1A1 expression is regulation of NCoR1 function, which has a direct impact on UGT1A1 gene expression and IEC maturation. When NCoR1 is selectively deleted in IECs in ΔIECUN mice, newborns do not display the escalating TSB levels that are prominent in neonatal hUGT1 mice. In addition, they show significantly elevated levels of UGT1A1 throughout the longitudinal range of the SI in addition to the IECs ranging from the crypts to the ends of the villi. ChIP-seq experiments validated that deacetylated histone regions were prominent in NCoR1 binding, adding support that histone deacetylases, such as HDAC3, are associated with NCoR1 binding (46). RNA-seq studies demonstrated that the deletion of NCoR1 promotes activation of PPARα and LXRα/β target genes involved in lipid and energy metabolism, as evident by increases in metabolic pathways, OXPHOS, and FA metabolism. All of these steps are necessary for successful IEC maturation. The UGT1A1 gene can be actively induced in the presence of PPARα/γ and LXRα/β ligands, so the possibility exists that deletion of NCoR1 and activation of these NRs are underlying the induction of UGT1A1 in IECs. Additionally, NCoR1 controls large sets of genes that are differentially regulated during the neonatal period or once the mice become adults. An important class of developmentally regulated genes during the neonatal period are those involved in the transition of neonatal to adult intestinal epithelium, indicating that NCoR1 functions along with the transcriptional repressor B lymphocyte-induced maturation protein 1 (38) in events involved in IEC maturation and development. Because NCoR1 deletion leads to IEC proliferation in neonatal mice, an event that does not occur in adult tissue, the action of IEC proliferation may underlie UGT1A1 derepression. NCoR1 ChIP-seq analysis can markedly increase the novelty of this work in elucidating the mechanism of NCoR1 repression on UGT1A1 gene expression. However, none of the commercial antibodies available for this work were successful in ChIP-seq experiments using neonatal intestinal tissue. Similar limitations were also encountered when Yamamoto tried to address the function of NCoR1 as an important regulator of muscle mass and oxidative function (27). To minimize this antibody limitation, our work has included ChIP-seq data by using different methylation and acetylation histone marks. H3K27ac is the primary player in response to the removal of the corepressor NCoR1 and the changes in chromatin structure and promoter accessibility.
The functional ability of NCoR1 to promote its repressive properties with NRs as well as its potential to activate gene transcription have been linked to specific phosphorylation events (23, 26), with a host of different kinases implicated in NCoR1 regulation (47–49). The loss of nuclear NCoR1 in malignant melanoma was associated with IKK-dependent phosphorylation of specific NCoR1 serine resides (42). When we deleted IKKβ selectively from IECs in hUGT1/IkkβΔIEC mice, UGT1A1 gene expression was superrepressed along with other target genes involved in IEC maturation, followed by elevations in TSB levels. Interestingly, IEC maturation genes analyzed by RT-QPCR during neonatal development were expressed in a highly concordant pattern in intestinal tissue from IKKβ(EE)IEC mice, directly implicating a key role for IKKβ expression toward control of NCoR1 release from repressed genes, such as UGT1A1.
We are proposing that there is a link between intestinal IKK activity and events that lead to NCoR1 repression of intestinal UGT1A1 gene expression shortly after birth. Human breast milk (BM), especially colostrum, contains glycans that inhibit Toll-like receptors (TLRs) and prevent downstream mediated inflammation (50). Upon ligand binding by pathogen-associated molecular patterns (PAMPs), expressed by microflora (51), TLRs are activated and initiate intracellular signaling events resulting in regulation of genes activated by the IKK/NF-κB pathway (52). Relative to term infants or adults, preterm infants express higher concentrations of TLRs, which upon activation may increase the risk for neonatal sepsis or necrotizing enterocolitis (53) through the IKK/NF-κB–mediated inflammatory response. The components of BM block this response by inhibiting the TLRs. Based upon our findings, we hypothesize that components of BM attenuate IEC TLRs, limit PAMP-induced IKKβ activity and downstream phosphorylation events, and minimize UGT1A1 gene expression through an NCoR1-dependent mechanism. The delayed expression of the UGT1A1 gene can be reversed by agents that activate TLRs, such as LPS (35), or components of BM, such as FAs, which are ligands for activation of PPARα, a NR linked to NCoR1 repression and activation of the UGT1A1 gene (21). The oral administration of high concentrations of FAs, such as linoleic acid, oleic acid, and docosahexaenoic acid, to neonatal hUGT1 mice resulted in lowering of TSB levels (54). In addition, a diet of formula, as we have previously shown (35), lacking TLR-bound glycans, allows downstream activation of the IKK/NCoR1 loop and expression of the UGT1A1 gene.
In conclusion, we have demonstrated that the transition of intestinal epithelial tissue from its immature status shortly after birth to an advanced network of crypts and villi, as observed in adult mice, can be viewed as a carefully programmed event. Regulation of neonatal intestinal UGT1A1 and its impact toward the control and onset of hyperbilirubinemia is intimately tied with IEC maturation. The findings that we have outlined in this animal model, such as the linkage of IKK with the inhibition of NCoR1, may be of value in identifying chemicals, therapeutics, or dietary agents that would be useful in lowering TSB levels in children exhibiting SNH.
Methods
Animal Studies.
hUGT1 mice were previously generated by introducing a human UGT1 transgene into mice with a Ugt1-null background (17, 55, 56). We crossed hUGT1 with NCoR1F/F mice (26, 27) to generate hUGT1/NCoR1F/F (F/FUN) mice, which were further bred with Villin-Cre (57) or Albumin-Cre transgenic mice (Jackson laboratory) (58, 59) to obtain the compound mutants Vil-Cre/TgUGT1/Ugt1−/−/NCoR1F/F (ΔIECUN) and Alb-Cre/TgUGT1/Ugt1−/−/NCoR1F/F (ΔHEPUN). Generation of mouse strains hUGT1/IkkβΔIEC (43) and IKKβ(EE)IEC (44) have been previously described. All of the mouse strains were housed in a pathogen-free University of California, San Diego (UCSD) vivarium. All animal protocols were reviewed and approved by the UCSD Animal Care and Use Committee. Cre-negative mice (F/FUN) served as controls. Siblings were preferred for all of the experiments.
Intestinal Tissue Sections.
Entire small intestines were dissected from mice, sectioned, snap-frozen in liquid nitrogen, and stored at –80 °C. Frozen tissues were pulverized for further RNA and protein extraction. SI segments were sectioned as duodenum (D), proximal jejunum (Jp), terminal jejunum (Jt), proximal ileum (Ip), and terminal ileum (It). Markers specific for duodenum (Akp3), jejunum (Sis), and ileum (Nox4, Lrp2) were measured by RT-QPCR, and the results were consistent with a previous publication (41).
IEC Isolation and IEC Sequential Isolation Along CVA.
IECs were isolated with a modified method (60). Dissociated IECs were collected by centrifugation. The sequential isolation of IECs along the CVA was carried out according to a previous description (61). Briefly, jejunums were dissected and cut longitudinally. After washing briefly in buffer A (DPBS with 27 mM sodium citrate), tissue was incubated in buffer B (DPBS with 1.5 mM EDTA and 0.5 mM DTT) at 37 °C with very gentle shaking. Following a series of incubations (2, 2, 3, 4, 5, 7, 10, 15, 15, and 15 min), a total of 11 fractions of IECs were isolated, and the gradient of cells from villus tip to the lower villus and crypt area was confirmed by the protein expression pattern of PCNA. Cells isolated from three mice of each strain were pooled for analysis.
Total RNA Preparation, RT-QPCR, and RNA-Seq Analysis.
Total RNA from cell and tissue samples were prepared for RT by using the iScript cDNA synthesis kit (BioRad). Real-time (Q) PCR experiments were carried out on a CFX96 QPCR system (BioRad) by using Ssoadvanced SYBR Green reagent (BioRad). Primers were designed through mouse primer depot (https://mouseprimerdepot.nci.nih.gov/). Isoform-specific primers for hUGT1A are listed in Table S1. Intestine RNA was prepared from F/FUN and ΔIECUN mice at either 12 d old (neonates) or 10 wk old (adults) for RNA-seq. RNA from two mice were pooled, and a total three samples per strain were used for RNA-seq studies. Polyadenylated mRNA was purified with the Dynabeads mRNA purification kit (ThermoFisher). The mRNA libraries were prepared for strand-specific sequencing as previously described (62) and sequenced using an Illumina HiSeq 2500 by running 36 cycles. Image deconvolution, quality value calculation, and the mapping of exon reads and exon junctions were performed. Sequencing reads were aligned to the Mus musculus (UCSC mm9) genome. RNA-seq data have been deposited in the GEO database under accession no. GSE86927.
Table S1.
Primers used to identify the UGT1A gene products by RT-QPCR
| Targets | Sequence, 5′–3′ |
| UGT1A1-F | CCATCATGCCCAATATGGTT |
| UGT1A1-R | CCACAATTCCATGTTCTCCA |
| UGT1A3-F | TCAACTGTGCCAACAGGAAG |
| UGT1A3-R | CTGAGACCATTGATCCCAAAG |
| UGT1A4-F | CAACGGGAAGCCACTATCTC |
| UGT1A4-R | TGAGACCATTGATCCCAAAGA |
| UGT1A6-F | TGCTTGAATATCCTAGGCCG |
| UGT1A6-R | ACCACAATTCCATGTTCTCCA |
| UGT1A7-F | TGTCATCAGGGAAAGCCAGT |
| UGT1A7-R | TGAGACCATTGATCCCAAAGA |
| UGT1A9-F | GAACATTTATTATGCCACCG |
| UGT1A9-R | CAACAACCAAATTGATGTGTG |
| UGT1A10-F | TGATGCCCAACATGATCTTC |
| UGT1A10-R | CCACAATTCCATGTTCTCCA |
ChIP-Seq Analysis.
IECs were freshly isolated from both ΔIECUN and F/FUN neonates at P12 and were subjected to ChIP (MAGnify ChIP system, ThermoFisher). After reverse cross-linking, library preparation was carried out by using the MicroPlex Library Preparation Kit V2 (Diagenode, C05010012). Cluster generation and 50 cycles of single-end sequencing were carried out on an Illumina NextSeq 500. Sequence tags were aligned (mapped) to the unmasked mouse (mm9) or human (hg19) reference genome. The following antibodies were used: anti-H3K4me1 (Abcam, ab8895), anti-H3K4me3 (Abcam, ab8580), anti-H3K9me3 (Abcam, ab8898), anti-H3K27me3 (Active Motif, AM61017), anti-H3K9ac (Active Motif, AM39137), and anti-H3K27ac (Abcam, ab4729). ChIP-seq data have been deposited in the GEO database under accession no. GSE86996.
Histology, Immunohistochemistry (IHC), and Immunofluorescence (IF).
Paraffin-embedded sections were used for routine H&E staining. BrdU IHC was performed according to the manufacturer’s instructions (eBioscience, 8800–6599-45). Briefly, neonates at day 12 (BrdU exposure for 2.5 h) or at day 10 (BrdU exposure for 48 h) were treated with BrdU at 50 mg/kg by i.p. injection. Paraffin-embedded SI sections were applied for IHC staining and detected by the ABC detection system. Slides were examined under an upright Imager A2 microscope (Zeiss). Frozen sections were prepared in OCT compound for IF staining. After the overnight incubation with primary antibodies, slides were then washed and stained with Alexa-488–conjugated secondary antibodies (Life Technologies), alongside a DAPI counterstaining. Mounted slides were examined under Leica TCS SPE confocal microscopy. The following antibodies were used: anti-Ki67 (GeneTex, GTX16667), anti–β-catenin (Santa Cruz Biotechnology, sc-1496), and anti-sis (Santa Cruz Biotechnology, sc27603).
Protein Preparation and Western Blots.
Tissue or cell lysates were prepared in a RIPA buffer for gel electrophoresis [Nupage 4–12% (wt/vol) Bis-Tris gradient gel ThermoFisher]. Western blots were developed and imaged using a ChemiDoc Touch Imaging System (BioRad). The following antibodies were used: rabbit anti-human UGT1A1 (Abcam, ab170858), anti-PCNA (BD Pharmingen, 555566), and anti–α-Tubulin (Sigma, T9026).
Statistics.
All results were subjected to statistical analysis. Student’s t test analyses were performed for most of the studies unless specified otherwise. All statistics and graphs were generated by using GraphPad Prism software. Data are expressed as mean ± SEM, and P values smaller than 0.05 were considered as statistically significant: *P < 0.05, **P < 0.01, ***P < 0.001, ****P < 0.0001.
Electron microscope imaging and primary hepatocytes isolation are describe in SI Methods.
SI Methods
Transmission Electron Microscope.
Electron microscope imaging was performed at the National Center for Microscopy and Imaging Research (NCMIR) at UCSD according to modification of a method of Antonucci (63). Briefly described, ΔIECUN and F/FUN neonates were euthanized on day 12, and jejunums were dissected and fixed in a freshly made solution of 2% (wt/vol) paraformaldehyde, 2.5% (wt/vol) glutaraldehyde, and 0.15 M sodium cacodylate buffer overnight at 4 °C. Tissues were washed with ice-cold 0.15 M sodium cacodylate containing 2 mM CaCl2 and then postfixed with 1.5% (wt/vol) KFe(CN)3, 0.15 M cacodylate buffer, 2 mM CaCl2, and 2% (wt/vol) OsO4(aq). Tissues were washed with ice-cold water and stained with 1% uranyl acetate overnight at 4 °C. Tissues were dehydrated with graded ethanol solutions before embedding in Durcupan ACM resin (Fluka) for ultramicrotomy by using a Leica Ultracut UCT ultramicrotome. Sections were poststained with Sato Lead Solution before TEM imaging. Electron micrographs were taken on a FEI Technai 12 (Spirit) (120 kV) with a Teitz TemCam F224 2k by 2k CCD camera. Montages of intestinal villi were obtained using Serial EM software at 4,400× magnification in a 10 × 10 or 20 × 20 region of interest. Mosaics were constructed using the Blendmont feature in 3dmod (IMOD version 4.7, University of Colorado), and the resulting mosaics were binned.
Hepatocytes Isolation and SiRNA Treatment.
Primary hepatocytes were isolated from neonatal mouse livers and treated with gene-targeted siRNA as previously described (19, 56). Briefly, hepatocytes were dissociated through liver perfusion with Hanks buffer with liberase (Roche, 05401020001) and plated in six-well collagen-coated plates (BD). Four hours later, hepatocytes were transfected with Silencer select siRNA (ThermoFisher-Ambion) by using lipofectamine RNAiMAX reagent (ThermoFisher). The siRNA included siControl, siNCoR1, siSMRT, siHDAC1, siHDAC2, and siHDAC3. Cells were collected 48 h after transfection.
Acknowledgments
We thank Dr. Bing Ren and his laboratory for running the RNA-seq samples and DNA Link (San Diego) for assistance with ChIP-seq experiments. Electron micrographs of intestinal tissue was performed at the UCSD National Center for Microscopy and Imaging directed by Dr. Mark Ellisman, and Dr. Nissi Varki at the UCSD Cancer Center Histology Core was helpful with sectioning and staining of intestinal tissue. This work was supported in part by US Public Health Service Grants ES010337 (to M.K., R.M.E. and R.H.T.), GM086713 and GM100481 (to R.H.T.), R21ES024818 (to S.C.), and AI043477 (to M.K.) and Swiss National Science Foundation Grant 310030B-160318 (to J.A.). M.K. is an American Cancer Society Research Professor and holder of the Ben and Wanda Hildyard Chair for Mitochondrial and Metabolic Diseases. M.L. received a fellowship from the China Scholarship Council, which supported in part her research at UCSD.
Footnotes
The authors declare no conflict of interest.
Data deposition: The data reported in this paper have been deposited in the Gene Expression Omnibus (GEO) database, www.ncbi.nlm.nih.gov/geo (accession nos. GSE86927 and GSE86996).
This article contains supporting information online at www.pnas.org/lookup/suppl/doi:10.1073/pnas.1700232114/-/DCSupplemental.
References
- 1.Bosma PJ, et al. Bilirubin UDP-glucuronosyltransferase 1 is the only relevant bilirubin glucuronidating isoform in man. J Biol Chem. 1994;269(27):17960–17964. [PubMed] [Google Scholar]
- 2.Burchell B, et al. Development of human liver UDP-glucuronosyltransferases. Dev Pharmacol Ther. 1989;13(2-4):70–77. doi: 10.1159/000457587. [DOI] [PubMed] [Google Scholar]
- 3.Watchko JF. Identification of neonates at risk for hazardous hyperbilirubinemia: Emerging clinical insights. Pediatr Clin North Am. 2009;56(3):671–687. doi: 10.1016/j.pcl.2009.04.005. [DOI] [PubMed] [Google Scholar]
- 4.Maisels MJ. Managing the jaundiced newborn: A persistent challenge. CMAJ. 2015;187(5):335–343. doi: 10.1503/cmaj.122117. [DOI] [PMC free article] [PubMed] [Google Scholar]
- 5.Dennery PA, Seidman DS, Stevenson DK. Neonatal hyperbilirubinemia. N Engl J Med. 2001;344(8):581–590. doi: 10.1056/NEJM200102223440807. [DOI] [PubMed] [Google Scholar]
- 6.Kullak-Ublick GA, Beuers U, Paumgartner G. Hepatobiliary transport. J Hepatol. 2000;32(1) Suppl:3–18. doi: 10.1016/s0168-8278(00)80411-0. [DOI] [PubMed] [Google Scholar]
- 7.Wong RJ, Stevenson DK. Neonatal hemolysis and risk of bilirubin-induced neurologic dysfunction. Semin Fetal Neonatal Med. 2015;20(1):26–30. doi: 10.1016/j.siny.2014.12.005. [DOI] [PubMed] [Google Scholar]
- 8.Olusanya BO, Osibanjo FB, Slusher TM. Risk factors for severe neonatal hyperbilirubinemia in low and middle-income countries: A systematic review and meta-analysis. PLoS One. 2015;10(2):e0117229. doi: 10.1371/journal.pone.0117229. [DOI] [PMC free article] [PubMed] [Google Scholar]
- 9.Cunningham AD, Hwang S, Mochly-Rosen D. Glucose-6-phosphate dehydrogenase deficiency and the need for a novel treatment to prevent kernicterus. Clin Perinatol. 2016;43(2):341–354. doi: 10.1016/j.clp.2016.01.010. [DOI] [PMC free article] [PubMed] [Google Scholar]
- 10.Bhutani VK, et al. Neonatal hyperbilirubinemia and Rhesus disease of the newborn: Incidence and impairment estimates for 2010 at regional and global levels. Pediatr Res. 2013;74(Suppl 1):86–100. doi: 10.1038/pr.2013.208. [DOI] [PMC free article] [PubMed] [Google Scholar]
- 11.Maisels MJ, et al. The natural history of jaundice in predominantly breastfed infants. Pediatrics. 2014;134(2):e340–e345. doi: 10.1542/peds.2013-4299. [DOI] [PubMed] [Google Scholar]
- 12.Watchko JF. Bilirubin-induced neurotoxicity in the preterm neonate. Clin Perinatol. 2016;43(2):297–311. doi: 10.1016/j.clp.2016.01.007. [DOI] [PubMed] [Google Scholar]
- 13.Bhutani VK, Johnson-Hamerman L. The clinical syndrome of bilirubin-induced neurologic dysfunction. Semin Fetal Neonatal Med. 2015;20(1):6–13. doi: 10.1016/j.siny.2014.12.008. [DOI] [PubMed] [Google Scholar]
- 14.Kaplan M, Bromiker R, Hammerman C. Severe neonatal hyperbilirubinemia and kernicterus: Are these still problems in the third millennium? Neonatology. 2011;100(4):354–362. doi: 10.1159/000330055. [DOI] [PubMed] [Google Scholar]
- 15.Tabarki B, Khalifa M, Yacoub M, Tlili K, Essoussi AS. Cerebellar symptoms heralding bilirubin encephalopathy in Crigler-Najjar syndrome. Pediatr Neurol. 2002;27(3):234–236. doi: 10.1016/s0887-8994(02)00425-3. [DOI] [PubMed] [Google Scholar]
- 16.Olusanya BO, Osibanjo FB, Mabogunje CA, Slusher TM, Olowe SA. The burden and management of neonatal jaundice in Nigeria: A scoping review of the literature. Niger J Clin Pract. 2016;19(1):1–17. doi: 10.4103/1119-3077.173703. [DOI] [PubMed] [Google Scholar]
- 17.Fujiwara R, Nguyen N, Chen S, Tukey RH. Developmental hyperbilirubinemia and CNS toxicity in mice humanized with the UDP glucuronosyltransferase 1 (UGT1) locus. Proc Natl Acad Sci USA. 2010;107(11):5024–5029. doi: 10.1073/pnas.0913290107. [DOI] [PMC free article] [PubMed] [Google Scholar]
- 18.Xie W, et al. Control of steroid, heme, and carcinogen metabolism by nuclear pregnane X receptor and constitutive androstane receptor. Proc Natl Acad Sci USA. 2003;100(7):4150–4155. doi: 10.1073/pnas.0438010100. [DOI] [PMC free article] [PubMed] [Google Scholar]
- 19.Chen S, Yueh MF, Evans RM, Tukey RH. Pregnane-x-receptor controls hepatic glucuronidation during pregnancy and neonatal development in humanized UGT1 mice. Hepatology. 2012;56(2):658–667. doi: 10.1002/hep.25671. [DOI] [PMC free article] [PubMed] [Google Scholar]
- 20.Sugatani J, et al. Transcriptional regulation of human UGT1A1 gene expression: Activated glucocorticoid receptor enhances constitutive androstane receptor/pregnane X receptor-mediated UDP-glucuronosyltransferase 1A1 regulation with glucocorticoid receptor-interacting protein 1. Mol Pharmacol. 2005;67(3):845–855. doi: 10.1124/mol.104.007161. [DOI] [PubMed] [Google Scholar]
- 21.Senekeo-Effenberger K, et al. Expression of the human UGT1 locus in transgenic mice by 4-chloro-6-(2,3-xylidino)-2-pyrimidinylthioacetic acid (WY-14643) and implications on drug metabolism through peroxisome proliferator-activated receptor α activation. Drug Metab Dispos. 2007;35(3):419–427. doi: 10.1124/dmd.106.013243. [DOI] [PubMed] [Google Scholar]
- 22.Ishizuka T, Lazar MA. The N-CoR/histone deacetylase 3 complex is required for repression by thyroid hormone receptor. Mol Cell Biol. 2003;23(15):5122–5131. doi: 10.1128/MCB.23.15.5122-5131.2003. [DOI] [PMC free article] [PubMed] [Google Scholar]
- 23.Mottis A, Mouchiroud L, Auwerx J. Emerging roles of the corepressors NCoR1 and SMRT in homeostasis. Genes Dev. 2013;27(8):819–835. doi: 10.1101/gad.214023.113. [DOI] [PMC free article] [PubMed] [Google Scholar]
- 24.Jepsen K, et al. Combinatorial roles of the nuclear receptor corepressor in transcription and development. Cell. 2000;102(6):753–763. doi: 10.1016/s0092-8674(00)00064-7. [DOI] [PubMed] [Google Scholar]
- 25.Astapova I, et al. The nuclear corepressor, NCoR, regulates thyroid hormone action in vivo. Proc Natl Acad Sci USA. 2008;105(49):19544–19549. doi: 10.1073/pnas.0804604105. [DOI] [PMC free article] [PubMed] [Google Scholar]
- 26.Jo YS, et al. Phosphorylation of the nuclear receptor corepressor 1 by protein kinase B switches its corepressor targets in the liver in mice. Hepatology. 2015;62(5):1606–1618. doi: 10.1002/hep.27907. [DOI] [PMC free article] [PubMed] [Google Scholar]
- 27.Yamamoto H, et al. NCoR1 is a conserved physiological modulator of muscle mass and oxidative function. Cell. 2011;147(4):827–839. doi: 10.1016/j.cell.2011.10.017. [DOI] [PMC free article] [PubMed] [Google Scholar]
- 28.Li P, et al. Adipocyte NCoR knockout decreases PPARγ phosphorylation and enhances PPARγ activity and insulin sensitivity. Cell. 2011;147(4):815–826. doi: 10.1016/j.cell.2011.09.050. [DOI] [PMC free article] [PubMed] [Google Scholar]
- 29.Li P, et al. NCoR repression of LXRs restricts macrophage biosynthesis of insulin-sensitizing omega 3 fatty acids. Cell. 2013;155(1):200–214. doi: 10.1016/j.cell.2013.08.054. [DOI] [PMC free article] [PubMed] [Google Scholar]
- 30.Sengupta S, Peterson TR, Laplante M, Oh S, Sabatini DM. mTORC1 controls fasting-induced ketogenesis and its modulation by ageing. Nature. 2010;468(7327):1100–1104. doi: 10.1038/nature09584. [DOI] [PubMed] [Google Scholar]
- 31.Pascual G, et al. A SUMOylation-dependent pathway mediates transrepression of inflammatory response genes by PPAR-gamma. Nature. 2005;437(7059):759–763. doi: 10.1038/nature03988. [DOI] [PMC free article] [PubMed] [Google Scholar]
- 32.Fan W, Evans R. PPARs and ERRs: Molecular mediators of mitochondrial metabolism. Curr Opin Cell Biol. 2015;33:49–54. doi: 10.1016/j.ceb.2014.11.002. [DOI] [PMC free article] [PubMed] [Google Scholar]
- 33.Ghisletti S, et al. Parallel SUMOylation-dependent pathways mediate gene- and signal-specific transrepression by LXRs and PPARgamma. Mol Cell. 2007;25(1):57–70. doi: 10.1016/j.molcel.2006.11.022. [DOI] [PMC free article] [PubMed] [Google Scholar]
- 34.Hu X, Li S, Wu J, Xia C, Lala DS. Liver X receptors interact with corepressors to regulate gene expression. Mol Endocrinol. 2003;17(6):1019–1026. doi: 10.1210/me.2002-0399. [DOI] [PubMed] [Google Scholar]
- 35.Fujiwara R, Chen S, Karin M, Tukey RH. Reduced expression of UGT1A1 in intestines of humanized UGT1 mice via inactivation of NF-κB leads to hyperbilirubinemia. Gastroenterology. 2012;142(1):109–118.e2. doi: 10.1053/j.gastro.2011.09.045. [DOI] [PMC free article] [PubMed] [Google Scholar]
- 36.Hooton D, Lentle R, Monro J, Wickham M, Simpson R. The secretion and action of brush border enzymes in the mammalian small intestine. Rev Physiol Biochem Pharmacol. 2015;168:59–118. doi: 10.1007/112_2015_24. [DOI] [PubMed] [Google Scholar]
- 37.Ogishima T, Mitani F, Ishimura Y. Isolation of two distinct cytochromes P-45011 β with aldosterone synthase activity from bovine adrenocortical mitochondria. J Biochem. 1989;105(4):497–499. doi: 10.1093/oxfordjournals.jbchem.a122694. [DOI] [PubMed] [Google Scholar]
- 38.Muncan V, et al. Blimp1 regulates the transition of neonatal to adult intestinal epithelium. Nat Commun. 2011;2:452. doi: 10.1038/ncomms1463. [DOI] [PMC free article] [PubMed] [Google Scholar]
- 39.Mochizuki K, Yorita S, Goda T. Gene expression changes in the jejunum of rats during the transient suckling-weaning period. J Nutr Sci Vitaminol (Tokyo) 2009;55(2):139–148. doi: 10.3177/jnsv.55.139. [DOI] [PubMed] [Google Scholar]
- 40.Hansson J, et al. Time-resolved quantitative proteome analysis of in vivo intestinal development. Mol Cell Proteomics. 2011;10(3):005231. doi: 10.1074/mcp.M110.005231. [DOI] [PMC free article] [PubMed] [Google Scholar]
- 41.Comelli EM, et al. Biomarkers of human gastrointestinal tract regions. Mamm Genome. 2009;20(8):516–527. doi: 10.1007/s00335-009-9212-7. [DOI] [PubMed] [Google Scholar]
- 42.Gallardo F, et al. Cytoplasmic accumulation of NCoR in malignant melanoma: Consequences of altered gene repression and prognostic significance. Oncotarget. 2015;6(11):9284–9294. doi: 10.18632/oncotarget.3252. [DOI] [PMC free article] [PubMed] [Google Scholar]
- 43.Liu M, et al. Cadmium and arsenic override NF-κB developmental regulation of the intestinal UGT1A1 gene and control of hyperbilirubinemia. Biochem Pharmacol. 2016;110-111:37–46. doi: 10.1016/j.bcp.2016.04.003. [DOI] [PMC free article] [PubMed] [Google Scholar]
- 44.Guma M, et al. Constitutive intestinal NF-κB does not trigger destructive inflammation unless accompanied by MAPK activation. J Exp Med. 2011;208(9):1889–1900. doi: 10.1084/jem.20110242. [DOI] [PMC free article] [PubMed] [Google Scholar]
- 45.Chen S, et al. Intestinal glucuronidation protects against chemotherapy-induced toxicity by irinotecan (CPT-11) Proc Natl Acad Sci USA. 2013;110(47):19143–19148. doi: 10.1073/pnas.1319123110. [DOI] [PMC free article] [PubMed] [Google Scholar]
- 46.Zhang J, Kalkum M, Chait BT, Roeder RG. The N-CoR-HDAC3 nuclear receptor corepressor complex inhibits the JNK pathway through the integral subunit GPS2. Mol Cell. 2002;9(3):611–623. doi: 10.1016/s1097-2765(02)00468-9. [DOI] [PubMed] [Google Scholar]
- 47.Huang W, Ghisletti S, Perissi V, Rosenfeld MG, Glass CK. Transcriptional integration of TLR2 and TLR4 signaling at the NCoR derepression checkpoint. Mol Cell. 2009;35(1):48–57. doi: 10.1016/j.molcel.2009.05.023. [DOI] [PMC free article] [PubMed] [Google Scholar]
- 48.Choi HK, et al. Protein kinase A phosphorylates NCoR to enhance its nuclear translocation and repressive function in human prostate cancer cells. J Cell Physiol. 2013;228(6):1159–1165. doi: 10.1002/jcp.24269. [DOI] [PubMed] [Google Scholar]
- 49.Fernández-Majada V, et al. Aberrant cytoplasmic localization of N-CoR in colorectal tumors. Cell Cycle. 2007;6(14):1748–1752. doi: 10.4161/cc.6.14.4429. [DOI] [PubMed] [Google Scholar]
- 50.He Y, Lawlor NT, Newburg DS. Human milk components modulate Toll-like receptor-mediated inflammation. Adv Nutr. 2016;7(1):102–111. doi: 10.3945/an.115.010090. [DOI] [PMC free article] [PubMed] [Google Scholar]
- 51.Akira S, Takeda K. Toll-like receptor signalling. Nat Rev Immunol. 2004;4(7):499–511. doi: 10.1038/nri1391. [DOI] [PubMed] [Google Scholar]
- 52.Lehnardt S. Innate immunity and neuroinflammation in the CNS: The role of microglia in Toll-like receptor-mediated neuronal injury. Glia. 2010;58(3):253–263. doi: 10.1002/glia.20928. [DOI] [PubMed] [Google Scholar]
- 53.Glaser K, Speer CP. Toll-like receptor signaling in neonatal sepsis and inflammation: A matter of orchestration and conditioning. Expert Rev Clin Immunol. 2013;9(12):1239–1252. doi: 10.1586/1744666X.2013.857275. [DOI] [PubMed] [Google Scholar]
- 54.Shibuya A, Itoh T, Tukey RH, Fujiwara R. Impact of fatty acids on human UDP-glucuronosyltransferase 1A1 activity and its expression in neonatal hyperbilirubinemia. Sci Rep. 2013;3:2903. doi: 10.1038/srep02903. [DOI] [PMC free article] [PubMed] [Google Scholar]
- 55.Nguyen N, et al. Disruption of the ugt1 locus in mice resembles human Crigler-Najjar type I disease. J Biol Chem. 2008;283(12):7901–7911. doi: 10.1074/jbc.M709244200. [DOI] [PubMed] [Google Scholar]
- 56.Chen S, et al. Tissue-specific, inducible, and hormonal control of the human UDP-glucuronosyltransferase-1 (UGT1) locus. J Biol Chem. 2005;280(45):37547–37557. doi: 10.1074/jbc.M506683200. [DOI] [PubMed] [Google Scholar]
- 57.Madison BB, et al. Cis elements of the villin gene control expression in restricted domains of the vertical (crypt) and horizontal (duodenum, cecum) axes of the intestine. J Biol Chem. 2002;277(36):33275–33283. doi: 10.1074/jbc.M204935200. [DOI] [PubMed] [Google Scholar]
- 58.Postic C, et al. Dual roles for glucokinase in glucose homeostasis as determined by liver and pancreatic beta cell-specific gene knock-outs using Cre recombinase. J Biol Chem. 1999;274(1):305–315. doi: 10.1074/jbc.274.1.305. [DOI] [PubMed] [Google Scholar]
- 59.Postic C, Magnuson MA. DNA excision in liver by an albumin-Cre transgene occurs progressively with age. Genesis. 2000;26(2):149–150. doi: 10.1002/(sici)1526-968x(200002)26:2<149::aid-gene16>3.0.co;2-v. [DOI] [PubMed] [Google Scholar]
- 60.Goodyear AW, Kumar A, Dow S, Ryan EP. Optimization of murine small intestine leukocyte isolation for global immune phenotype analysis. J Immunol Methods. 2014;405:97–108. doi: 10.1016/j.jim.2014.01.014. [DOI] [PubMed] [Google Scholar]
- 61.Weiser MM. Intestinal epithelial cell surface membrane glycoprotein synthesis. J Biol Chem. 1973;248(7):2536–2541. [PubMed] [Google Scholar]
- 62.Parkhomchuk D, et al. Transcriptome analysis by strand-specific sequencing of complementary DNA. Nucleic Acids Res. 2009;37(18):e123. doi: 10.1093/nar/gkp596. [DOI] [PMC free article] [PubMed] [Google Scholar]
- 63.Antonucci L, et al. Basal autophagy maintains pancreatic acinar cell homeostasis and protein synthesis and prevents ER stress. Proc Natl Acad Sci USA. 2015;112(45):E6166–E6174. doi: 10.1073/pnas.1519384112. [DOI] [PMC free article] [PubMed] [Google Scholar]


