Significance
The starting month of many historical tropical volcanic eruptions is unknown and often assumed constant in long model simulations. Here we use model simulations to show that the season of eruptions strongly affects both atmospheric circulation and the El Niño/Southern Oscillation within the eruption year and that this could explain some of the mismatches between model simulations and paleoclimate reconstructions. The response 1 year later depends much less on eruption season, and proxy reconstructions are also more consistent. Our results imply that models may actually be correctly representing eruption-year tropical climate responses and that the season of eruptions should be considered when evaluating the mechanisms for volcanic effects on climate.
Keywords: climate dynamics, ENSO, volcanic eruptions, paleoclimate, hydroclimate
Abstract
The response of the El Niño/Southern Oscillation (ENSO) to tropical volcanic eruptions has important worldwide implications, but remains poorly constrained. Paleoclimate records suggest an “El Niño-like” warming 1 year following major eruptions [Adams JB, Mann ME, Ammann CM (2003) Nature 426:274–278] and “La Niña-like” cooling within the eruption year [Li J, et al. (2013) Nat Clim Chang 3:822–826]. However, climate models currently cannot capture all these responses. Many eruption characteristics are poorly constrained, which may contribute to uncertainties in model solutions—for example, the season of eruption occurrence is often unknown and assigned arbitrarily. Here we isolate the effect of eruption season using experiments with the Community Earth System Model (CESM), varying the starting month of two large tropical eruptions. The eruption-year atmospheric circulation response is strongly seasonally dependent, with effects on European winter warming, the Intertropical Convergence Zone, and the southeast Asian monsoon. This creates substantial variations in eruption-year hydroclimate patterns, which do sometimes exhibit La Niña-like features as in the proxy record. However, eruption-year equatorial Pacific cooling is not driven by La Niña dynamics, but strictly by transient radiative cooling. In contrast, equatorial warming the following year occurs for all starting months and operates dynamically like El Niño. Proxy reconstructions confirm these results: eruption-year cooling is insignificant, whereas warming in the following year is more robust. This implies that accounting for the event season may be necessary to describe the initial response to volcanic eruptions and that climate models may be more accurately simulating volcanic influences than previously thought.
Large tropical volcanic eruptions strongly influence climate (1, 2), with important social and economic consequences (3–5). An important climatic response to eruptions is their effect on the El Niño/Southern Oscillation (6–8): Within the eruption year, previous work indicates that the tropical response appears La Niña-like (9, 10), with enhanced El Niño likelihood the following year (6, 11). However, debate remains regarding the significance of and mechanisms for these responses (7, 8, 12, 13), as well as the degree to which they depend on the characteristics of the eruption [i.e., hemispheric loading (13–15), strength (8), or initial conditions (12)]. Understanding all of these factors is crucial for assessing the potential risks associated with future large eruptions.
Climate models provide a dynamically consistent framework within which to investigate the mechanisms for El Niño/Southern Oscillation (ENSO) responses to volcanism and as such are invaluable tools. To date, however, models cannot reproduce all features of the proxy record following eruptions: The eruption year is subject to particularly large model/proxy disagreement (9, 13). Understanding the source of the disagreement is key to resolving outstanding questions regarding the physics of the eruption-year response [i.e., the degree to which the Asian monsoon is affected by eruptions or the importance of the “ocean dynamical thermostat” (16)]. There are large uncertainties associated with various aspects of volcanic aerosol forcing [i.e., overall magnitude, hemispheric symmetry, and eruption timing (17–20)]. For the eruption year itself, the season of eruption occurrence is also expected to be a crucial factor, adding a further layer of uncertainty. The eruption season is unknown for many events, and in such cases assumptions must be made. In the reconstruction used in the Community Earth System Model (CESM) Last Millennium Ensemble (LME) (18, 21), for example, the default starting month is April, resulting in an April start date for the majority of eruptions. This has potentially significant implications for interpreting model/proxy offsets within the eruption year.
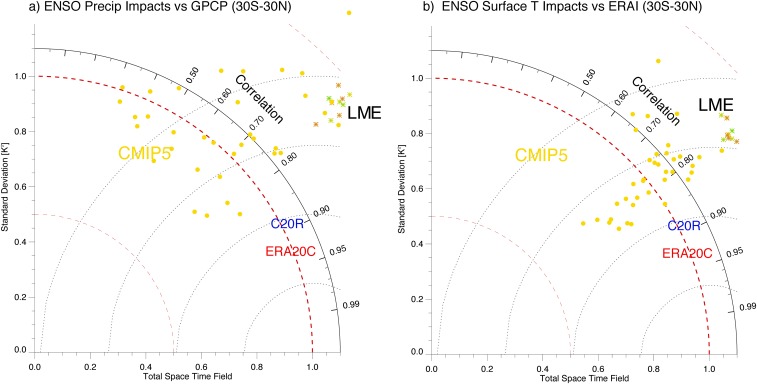
Here we present sensitivity studies using the CESM to test the effects of varying eruption month; CESM has one of the most accurate ENSO representations of all models in its class (Fig. S1), making it ideal for these purposes. Although subject to caveats common to general circulation models, including the possibility of compensating errors in feedback processes (22, 23), model performance is quite good, as is the representation of remote teleconnections (13).
Fig. S1.
Taylor diagrams indicating the performance of the CESM LME for (A) ENSO-related precipitation anomalies compared with the Global Precipitation Climatology Project (GPCP) and (B) ENSO-related temperature anomalies compared with the European Center for Medium-Range Weather Forecasts reanalysis (ERA-Interim), both computed over the 30°S to 30°N region. Performance of the CESM is quite good compared with the majority of models included in the Coupled Model Intercomparison Project phase 5 (CMIP5), although there is excessive variance (roughly 30% increase) in the LME compared with observations.
Eruption-Year Atmospheric Circulation Anomalies
We have used the methods laid out in ref. 18 to construct forcing profiles appropriate for the eruptions of Tambora in 1815 and Samalas in 1257 (note that this event occurs in 1258 in ref. 18), being the two largest tropical eruptions during the last millennium. Because this dataset tends to overestimate the forcing associated with large eruptions (20), these ensembles should be considered an upper limit on the eruption-year response expected for strong events. We note that although these particular eruptions are large compared with the historical era, the mechanisms for their influence on ENSO do not appear to differ fundamentally based on their size. The responses to eruptions of varying sizes in the CESM are discussed further in ref. 13. Validation of the CESM response to aerosol forcing has also been performed using the Pinatubo eruption, and satellite estimates of the net top-of-atmosphere imbalance fall within the 1 range across ensemble members throughout the course of the eruption (24).
Idealized eruptions begin in January, April, July, and October, and the CESM was run multiple times; the Tambora eruption was simulated 10 times and Samalas 5 times, for a total of 15 ensemble members for each starting month. The aerosol distributions vary significantly between seasonal ensembles: For January and April eruptions, aerosol loading peaks more rapidly in the high northern latitudes relative to the high southern latitudes, whereas the reverse is true for July and October eruptions (Fig. S2). The overall radiative forcing is likewise latitudinally dependent based on season (Fig. S3), although its behavior is not identical to the aerosol loading itself, due to modulations of the incident solar radiation during different portions of the seasonal cycle. However, in the tropics the zonal-mean aerosol concentrations and the associated radiative forcing are nearly identical across ensembles.
Fig. S2.
(A–E) Column-integrated volcanic aerosol mass used to force seasonally variable Tambora simulations, for varying latitudinal bands: 50–90°N (A), 20–50°N (B), 20S–20°N (C), 20–50°S (D), and 50–90°S (E). Here all time series have been adjusted to begin at the starting month of each eruption: Thus 1 y since eruption indicates April of the following year for April eruptions, October for October eruptions, etc. Northern Hemisphere high latitudes receive increased aerosol loadings earlier (3–6 mo posteruption) for January–April eruptions, whereas July–October show the first increase in the Southern Hemisphere.
Fig. S3.
(A–E) Difference between clear-sky top-of-atmosphere and surface downwelling shortwave radiation averaged over all seasonally variable simulations for Tambora and Samalas (“Tambora + Samalas”), for varying latitudinal bands: 50–90°N (A), 20–50°N (B), 20S–20°N (C), 20–50°S (D), and 50–90°S (E). Time series have been adjusted using the same conventions as Fig. S2. Shortwave radiation behaves the same way as overall aerosol loading: Increases occur more quickly in the Northern Hemisphere for eruptions earlier in the calendar year, and increases for later eruptions occur more rapidly in the Southern Hemisphere.
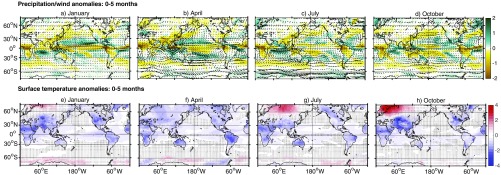
The circulation and precipitation patterns excited by these eruptions differ profoundly, even at latitudes with comparable aerosol loading. There is an overall northward migration of the Intertropical Convergence Zone (ITCZ) during the 6 mo immediately following all eruptions (Fig. 1 A–D), which is considerably larger in the January and April ensembles. The equatorial temperature anomalies are also larger in these cases, suggesting that the ITCZ migration enhancement is driven by increased equatorial cooling due to the lower overall cloud cover during boreal summer and associated shortwave anomaly penetration (Fig. 1 E–H and Figs. S4 and S5). This behavior is quite distinct from the changes in midlatitude temperature anomalies; the Asian continent and North America cool significantly more for eruptions in January and October, likely a result of land surface feedbacks (i.e., the snow/albedo feedback) during boreal winter. The warm response over Europe/northern Asia is markedly stronger for July and October eruptions, potentially a preferential effect on sea ice and associated feedbacks during boreal fall/winter (1, 2). Southeast Asian drying is strongest for January and April eruptions as the forcing coincides most strongly with the monsoon season in these cases. The western United States sees the strongest pluvials in the July and October ensembles (Fig. 1 C and D): This is due to westerly onshore flow driven by acceleration of the subtropical jet during boreal winter (13) and is therefore expected to be largest for eruptions occurring later in the year.
Fig. 1.
Atmospheric circulation and precipitation responses to tropical eruptions in the CESM. (A–D) Precipitation anomaly (mmd−1; colors) and surface wind stress anomaly (Nm−2; arrows) 0–5 mo following Tambora and Samalas eruptions in January, April, July, and October, respectively. (E–H) Same as A–D, for surface air temperature (°C). In E–H, stippling indicates regions where the anomalies are insignificant relative to internal variability at 90% based on a Wilcoxon rank-sum test.
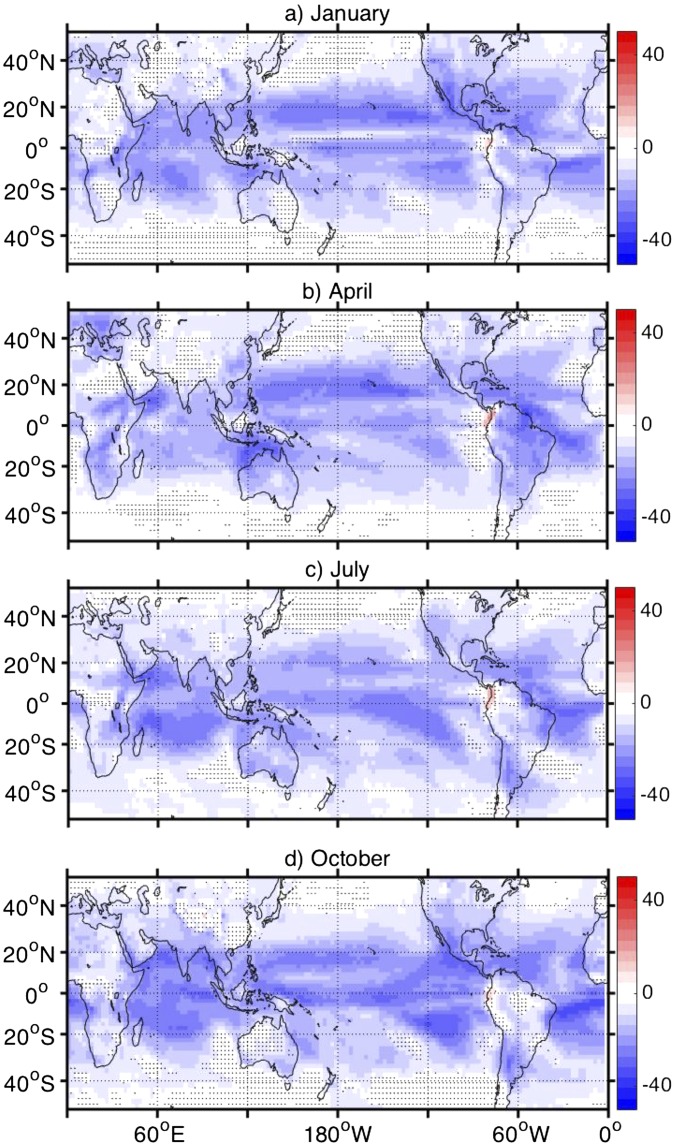
Fig. S4.
(A–D) Surface net shortwave radiation anomaly (Wm−2) in seasonally variable Tambora and Samalas simulations [(A) January, (B) April, (C) July, and (D) October], composited over the period 0–5 mo following eruptions (January–June for January eruptions, April–September for April eruptions, etc.). All anomalies are calculated relative to the 30 y before the eruption. Stippling indicates anomalies insignificant at 90%, computed using the Wilcoxon rank-sum test. Enhancements south of the equator are larger for July–October eruptions.
Fig. S5.
Climatological mean precipitation (kg⋅m−2⋅s−1; shading) and surface winds (m⋅s−1; vectors) in the CESM full-forcing ensemble member no. 2 (850–1850 AD), for (A) DJF, (B) March–April–May (MAM), (C) JJA, and (D) September–October–November (SON). The climatological tendency for the ITCZ to shift to the north during boreal summer/fall is clearly apparent in C and D.
Tropical Pacific Eruption Response
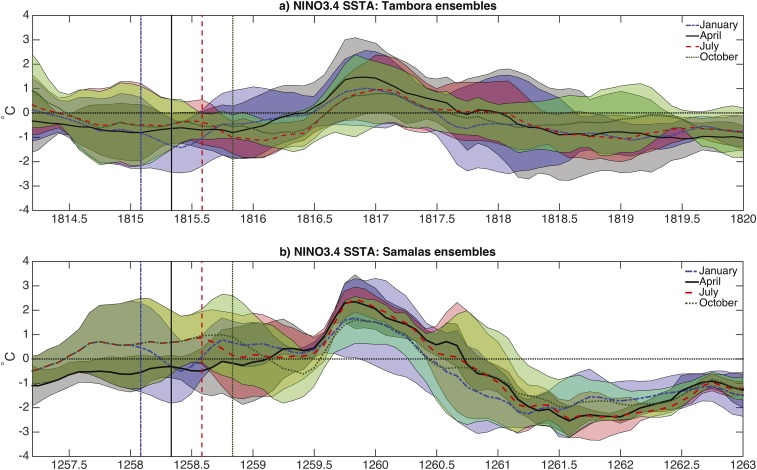
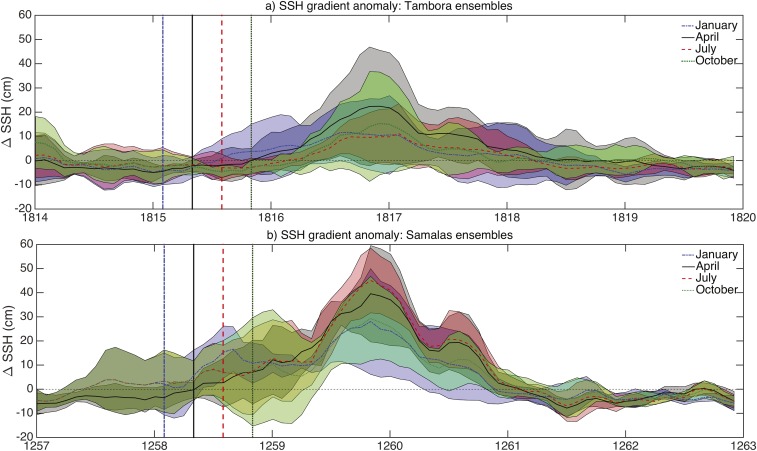
Although some equatorial Pacific cooling does occur within the eruption year in these ensembles, the patterns of temperature change do not strongly resemble the canonical “horseshoe” sea surface temperature (SST) anomaly pattern associated with true La Niña events (Fig. 1 E–H). Additionally, the significance of the net cooling is quite low for all ensembles except January. The temporal evolutions of the initial cooling differ substantially (Fig. S6): In the January ensemble, cooling occurs immediately but terminates quickly, whereas cooling in the July and October ensembles is both more delayed and prolonged. The April ensemble shows the smallest eruption-year response, with negligible equatorial cooling at any time. The mechanism for these responses is shown using a mixed-layer heat budget (Materials and Methods) in Fig. 2. The left-hand side of Fig. 2A shows a comparison of the “Year 0” eruption response with La Niña events from the LME 850 control (denoted by blue and green arrows, respectively): Within the eruption year, cooling is dominated by surface heat flux in all ensembles (Fig. 2A), rather than the advective signature associated with La Niña (25, 26). Consistent with this conclusion, sea surface height also shows little response within the eruption year (Fig. S7). During the eruption year, the surface heat flux anomaly is in turn dominated by shortwave flux reductions due to aerosol absorption, compensated to varying degrees by latent heat anomalies associated with reduced evaporation (Fig. 2 B and C). This compensation is larger in the western Pacific due to the higher mean cloud cover in this region; the net effect is for enhanced cooling in the eastern Pacific and an increase in the zonal SST gradient. Some cancellation of the surface-driven cooling also results from ocean dynamical processes, which are highly seasonally dependent. Cool anomalies are mixed into the subsurface in all ensembles, reflected by the heating tendency due to mixing/diffusion, and meridional advection is generally positive (Fig. 2A). The zonal advective tendencies differ significantly across ensembles and tend to be more positive for the January and April ensembles due to the climatological relaxation of the trades during boreal spring/summer (Fig. S5).
Fig. S6.
NINO3.4 SST time series for the seasonally variable (A) Tambora and (B) Samalas simulations. Vertical lines indicate the start of eruptions in each ensemble, and envelope widths indicate the total ensemble spread. Enhanced El Niño probability occurs for eruptions in all seasons, whereas the eruption-year cooling is more strongly seasonally dependent: Cooling immediately follows all eruption seasons except April, but the duration of the cooling varies from season to season.
Fig. 2.
Mixed-layer heat budget during various stages of ENSO following volcanic eruptions. (A) NINO3 region average (5°S to 5°N, 90–150°W). Bars indicate the total advective and flux components of the budget. Blue arrow indicates budget decomposition 0–5 mo following seasonally variable eruptions and red arrow indicates June–December of the year following the eruption. Green arrows indicate budget decompositions for El Niño and La Niña events in the 850 control simulation run as part of the LME (21). (B) Decomposition of the surface flux term in the heat budget over the NINO4m region (Left: NINO4m is a NINO4 index shifted west by 20° to compensate for GCM mean-state biases, as in ref. 27; limits are 5°S to 5°N, 140°E to 170°W) and the NINO3 region (Right), for the period 0–5 mo following each eruption.
Fig. S7.
Sea surface height gradient time series for the seasonally variable (A) Tambora and (B) Samalas simulations. All plotting conventions follow Fig. S6. Gradients are computed as the difference in sea surface height (SSH) between the eastern Pacific (5°S to 5°N, 90–150°W) and the western Pacific (5°S to 5°N, 140°E to 170°W). The increased SSH gradient associated with El Niño events can be seen for all eruption seasons; no substantial change in SSH is seen within the eruption year.
Fig. 2A, Right shows heat budget composites for the year following eruptions (red arrow) and for El Niño events within the LME 850 control (green arrow). These budgets show that in the CESM, volcanically induced El Niño initiation during the posteruption year is related primarily to basin recharge dynamics (8, 28), indicated by the strong contribution from meridional advection to the heating tendency in Fig. 2A. The initial equatorially enhanced SST cooling during the eruption year creates a negative off-equatorial wind stress curl (Fig. S8), and the resulting Sverdrup transport onto the equator creates heating via meridional advection. Mass convergence also inhibits equatorial upwelling and, because this mechanism is stronger in the eastern Pacific, tends to create heating via the zonal advective feedback as well. Comparing the Year +1 response with the heat budget for developing El Niño events in the LME 850 control simulation then shows that this mechanism is not unique to the volcanic response (Fig. 2A, Right). The effect of volcanic aerosol forcing on El Niño development appears to be an increase in surface-driven cooling and larger advective heating in all dimensions, related to larger overall temperature gradients. The increased likelihood of El Niño events following eruptions in the CESM is thus not due to fundamentally altered ENSO dynamics, but to the preferential excitation of the El Niño phase via the curl of the wind stress.
Fig. S8.
(A–D) Longitude–time plot of wind stress curl in the Tambora and Samalas seasonal ensembles [(A) January, (B) April, (C) July, and (D) October], averaged over 120°E to 80°W. An initial negative curl anomaly occurs near the equator following eruptions in all seasons, although the timing differs somewhat across ensembles. Positive curl anomalies associated with El Niño appear in all cases near 1–1.5 y posteruption.
Comparison with Proxy Reconstructions
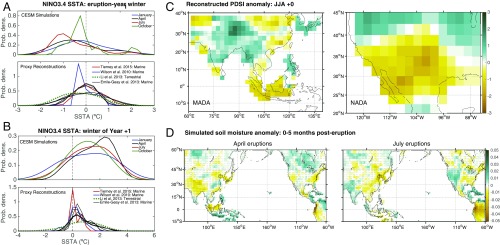
Our results suggest that a consideration of eruption season has the potential to reduce previously identified model/proxy discrepancies. For example, in the CESM the La Niña-like cold eruption-year SST is not a robust feature, and the cooling lasts only for a few months after the eruption (Fig. S6). If this behavior occurs in the real world as well, then it would be difficult to detect using proxy reconstructions of boreal winter conditions. To test this hypothesis, we have combined NINO3.4 SST anomaly (SSTA) reconstructions from a variety of marine and terrestrial sources (10, 29–31) and present the responses to tropical volcanic eruptions of the past millennium (Table S1) in Fig. 3 A and B, which are compared with the corresponding composites from the Tambora/Samalas seasonal CESM ensembles. None of the reconstructions based on marine proxies show a change in SSTA during the winter following the eruption significant above 90%, defined using a Wilcoxon rank-sum test (Fig. 3A, Bottom). The cooling in the CESM simulations (Fig. 3A, Top) is also insignificant and comparable in magnitude to the proxy reconstructions; in other words, eruption-year SST responses in the CESM agree well with observations, despite previously documented hydroclimate discrepancies (9, 13). Notably, the tendency toward enhanced heating in the year following eruptions is robust across all eruption seasons in the CESM, and the proxy reconstructions likewise show a more consistent warming pattern during Year +1 (Fig. 3B). This result is subject to caveats related to model physics and uncertainties in other eruption characteristics, but does suggest nonetheless that the lack of seasonal sensitivity in the CESM El Niño response—and the strong sensitivity in eruption-year cooling—may be real features of the climate response to tropical eruptions.
Table S1.
Years in which large tropical eruptions occurred, along with the starting month from historical records and from the forcing files used for the LME simulations
| Year | Month, observed | Month, LME |
| 1991 | 6 | 6 |
| 1982 | 3 | 5 |
| 1963 | 2 | 3 |
| 1951 | 1 | N/A |
| 1913 | 1 | 6/1912 |
| 1902 | 10 | 5 |
| 1883 | 8 | 8 |
| 1835 | 1 | 1 |
| 1822 | 10 | N/A |
| 1815 | 4 | 4 |
| 1673 | 5 | 5 |
| 1641 | 1 | 1 |
| 1600 | 2 | 2 |
For eruptions during 850—1849 the forcing used is taken from ref. 18; for eruptions during 1850—2005, forcings from ref. 17 are used. “N/A“ entries indicate that the eruption was not included in the LME forcing file. Observed eruption months are taken from the Smithsonian Global Volcanism Program at volcano.si.edu/search_volcano.cfm.
Fig. 3.
Comparison of CESM simulations against proxy reconstructions. (A) NINO3.4 SST anomaly during the winter of the eruption year for the CESM simulations [December–January–February (DJF); Top] and for several marine and terrestrially derived reconstructions (various definitions; Bottom). (B) Same as A, for the winter of the year following the eruption (Year +1). (C) Palmer Drought Severity Index anomaly for the boreal summer of the eruption year, derived from the Monsoon Asia Drought Atlas (32) (Left) and the North American Drought Atlas (33) (Right). (D) Zero- to 30-cm soil moisture anomaly averaged over the period 0–5 mo after the eruption, for CESM simulations with eruptions in April (Left) and July (Right). All CESM anomalies are computed relative to the 30 y before the eruption; in D, stippling indicates regions where the anomalies are insignificant relative to internal variability at 90% based on a Wilcoxon rank-sum test.
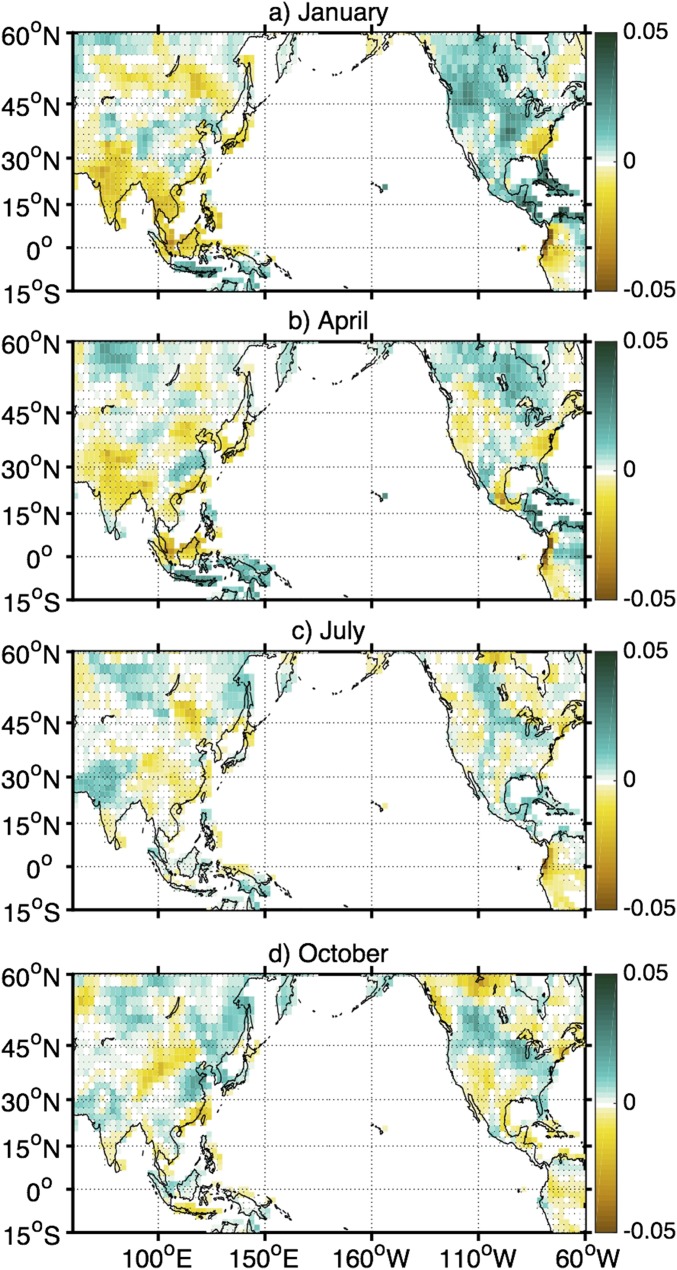
Fig. 3 C and D further demonstrate the importance of eruption season for interpreting model/proxy disagreements in hydroclimate. In the North American Drought Atlas (33) and Monsoon Asia Drought Atlas (32), “La Niña-like” patterns appear in the composite of the June–July–August (JJA) Palmer Drought Severity Index (PDSI) over all tropical eruption years since 1600 (10) (Fig. 3C). When soil moisture is composited over the same epochs in the CESM, the anomalies oppose these tendencies and appear generally “El Niño-like,” and the same is true for the present seasonal ensembles (Fig. S9), particularly those early in the year; this is consistent with previously documented model behavior (9, 13) and could be interpreted as demonstrating that the eruption-year hydroclimate response is “incorrect” relative to the proxy record. However, examining the immediate (0–5 mo) response, rather than averaging over boreal summer, suggests that La Niña-like anomalies can, in fact, be generated by the CESM (Fig. S10). In Fig. 3D, April eruptions generate negative soil moisture anomalies over much of western North America, and slight wetting is present over southeast Asia. Anomalies for the July eruption suite differ substantially, with the sign of anomalies reversed over North America/southeast Asia compared with the April case. Capturing the JJA hydroclimate anomalies seen in the proxy record may thus require both eruptions to occur in the correct starting month and ensuring that the duration of the relevant anomalies is realistic—an effort beyond the scope of the present study.
Fig. S9.
Eruption-year JJA 0- to 30-cm soil moisture anomalies (mm3/mm3) for the seasonal Tambora and Samalas ensembles, referenced to the 30 y before each eruption. (A) January; (B) April; (C) July; (D) October. Stippling indicates regions where the soil moisture anomaly is insignificant at 90% relative to internal variability, according to a Wilcoxon rank-sum test. The patterns of soil moisture anomalies differ markedly among seasonal ensembles, with January and April appearing more El Niño-like than July and October eruptions. However, for the July and October cases the eruption has not yet occurred or is still extremely weak in JJA of the eruption year.
Fig. S10.
(A–D) Same as Fig. S9, for the 0–5 mo following each eruption. Once again, significant differences in the soil moisture pattern are associated with different seasonal ensembles, even when the composites are referenced to the date of the eruption rather than the calendar year.
Discussion and Conclusions
Our results provide important insight into the uncertainties associated with interpreting model performance using the proxy record. Because some properties of the ENSO response are sensitive to eruption seasonality, some component of known model/proxy differences during the eruption year may relate to a lack of information regarding variations in starting month between eruptions. This is a step toward reconciliation of model and proxy evidence and illustrates the importance of testing the sensitivity of responses to uncertainties in climate forcing. The distinct behavior of marine- and terrestrial-based reconstructions also highlights the need to consider the mechanisms for SST and hydroclimate variability separately and cautions against the strict use of volcanic eruptions whose starting date is ambiguous to validate climate models. Mitigating these complicating factors will allow climate model simulations to provide both more physically correct simulation of climate variability and more reliable estimates of the risks associated with potential future large eruptions.
Materials and Methods
The mixed-layer heat budget was derived following (34)
| [1] |
where the entrainment velocity is computed assuming a spatially and temporally variable mixed-layer depth
| [2] |
wH indicates the vertical velocity immediately below the mixed layer, and the shortwave radiation penetrating the mixed layer is computed following refs. 26 and 35:
| [3] |
The mixed-layer depth definition used here is that of ref. 36, which assumes that the mixed layer is the shallowest layer where the local, interpolated buoyancy gradient is equal to the maximum gradient between the surface and any arbitrary depth within the water column.
All overbars indicate the 12-mo climatology in the relevant variable, and anomalies are computed relative to that climatology. Monthly mean output is used for all variables.
Acknowledgments
This work is supported by a National Science Foundation (NSF) Decadal and Regional Climate Prediction Using Earth System Models (EaSM) award through the NSF Division of Atmospheric and Geospace Sciences (AGS) Award 1243125. The CESM project is supported by the NSF and the Office of Science (Biological and Environmental Research program) of the US Department of Energy. Computing resources were provided by the Climate Simulation Laboratory at the National Center for Atmospheric Research’s Computational and Information Systems Laboratory sponsored by the NSF and other agencies. C.G. is supported by the National Key Basic Research Program of China (Award 2015CB953601).
Footnotes
The authors declare no conflict of interest.
This article is a PNAS Direct Submission.
This article contains supporting information online at www.pnas.org/lookup/suppl/doi:10.1073/pnas.1612505114/-/DCSupplemental.
References
- 1.Robock A. Volcanic eruptions and climate. Rev Geophys. 2000;38(2):191–219. [Google Scholar]
- 2.Schneider DP, Ammann CM, Otto-Bliesner BL, Kaufman DS. Climate response to large, high-latitude and low-latitude volcanic eruptions in the Community Climate System Model. J Geophys Res. 2009;114:D15101. [Google Scholar]
- 3.Stothers RB. Climatic and demographic consequences of the massive volcanic eruption of 1258. Clim Change. 2000;45:361–374. [Google Scholar]
- 4.Stommel HM, Stommel E. Volcano Weather: The Story of 1816, the Year Without A Summer. Seven Seas; Newport, RI: 1983. [Google Scholar]
- 5.Stothers RB. The great Tambora eruption in 1815 and its aftermath. Science. 1984;224:1191–1198. doi: 10.1126/science.224.4654.1191. [DOI] [PubMed] [Google Scholar]
- 6.Adams JB, Mann ME, Ammann CM. Proxy evidence for an El Niño-like response to volcanic forcing. Nature. 2003;426:274–278. doi: 10.1038/nature02101. [DOI] [PubMed] [Google Scholar]
- 7.Emile-Geay J, Seager R, Cane MA, Cook ER, Haug GH. Volcanoes and ENSO over the past millennium. J Clim. 2008;21:3134–3148. [Google Scholar]
- 8.McGregor S, Timmermann A. The effect of explosive tropical volcanism on ENSO. J Clim. 2011;24:2178–2191. [Google Scholar]
- 9.Anchukaitis KJ, et al. Influence of volcanic eruptions on the climate of the Asian monsoon region. Geophys Res Lett. 2010;37:L22703. [Google Scholar]
- 10.Li J, et al. El Niño modulations over the past seven centuries. Nat Clim Chang. 2013;3:822–826. [Google Scholar]
- 11.Wahl ER, Diaz HF, Smerdon JE, Ammann CM. Late winter temperature response to large tropical volcanic eruptions in temperate western North America: Relationship to ENSO phases. Glob Planet Change. 2014;122:238–250. [Google Scholar]
- 12.Ohba M, Shiogama H, Yokohata T, Watanabe M. Impact of strong tropical volcanic eruptions on ENSO simulated in a coupled GCM. J Clim. 2013;26:5169–5182. [Google Scholar]
- 13.Stevenson S, Otto-Bliesner B, Fasullo J, Brady E. “El Niño-like” hydroclimate responses to last millennium volcanic eruptions. J Clim. 2016;29:2907–2921. [Google Scholar]
- 14.Colose CM, LeGrande AN, Vuille M. Hemispherically asymmetric volcanic forcing of tropical hydroclimate and water isotopologue variability during the last millennium. Earth Syst Dynam. 2016;7:681–696. [Google Scholar]
- 15.Pausata FSR, Chafik L, Caballero R, Battisti DS. Impacts of high-latitude volcanic eruptions on ENSO and AMOC. Proc Natl Acad Sci USA. 2015;112(45):13784–13788. doi: 10.1073/pnas.1509153112. [DOI] [PMC free article] [PubMed] [Google Scholar]
- 16.Clement AC, Seager R, Cane MA, Zebiak SE. An ocean dynamical thermostat. J Clim. 1996;9:2190–2196. [Google Scholar]
- 17.Ammann CM, Meehl GA, Washington WM, Zender CS. A monthly and latitudinally varying volcanic forcing dataset in simulations of 20th century climate. Geophys Res Lett. 2003;30(12):1657. [Google Scholar]
- 18.Gao CC, Robock A, Ammann C. Volcanic forcing of climate over the past 1500 years: An improved ice core-based index for climate models. J Geophys Res. 2008;113:D23111. [Google Scholar]
- 19.Crowley TJ, et al. Volcanism and the Little Ice Age. PAGES Newsl. 2008;16:22–23. [Google Scholar]
- 20.Sigl M, et al. Timing and climate forcing of volcanic eruptions for the past 2,500 years. Nature. 2015;523:543–549. doi: 10.1038/nature14565. [DOI] [PubMed] [Google Scholar]
- 21.Otto-Bliesner BL, et al. Climate variability and change since 850 C.E.: An ensemble approach with the Community Earth System Model (CESM) Bull Am Meteorol Soc. 2016;97(5):735–754. [Google Scholar]
- 22.Bellenger H, Guilyardi E, Leloup J, Lengaigne M, Vialard J. ENSO representation in climate models: From CMIP3 to CMIP5. Clim Dyn. 2014;42(7-8):1999–2018. [Google Scholar]
- 23.Lloyd J, Guilyardi E, Weller H. The role of atmosphere feedbacks during ENSO in the CMIP3 models. Part III: The shortwave flux feedback. J Clim. 2012;25:4275–4293. [Google Scholar]
- 24.Fasullo JT, Nerem RS, Hamlington B. Is the detection of accelerated sea level rise imminent? Sci Rep. 2016;6:31245. doi: 10.1038/srep31245. [DOI] [PMC free article] [PubMed] [Google Scholar]
- 25.Wang W, McPhaden MJ. Surface layer temperature balance in the equatorial Pacific during the 1997-98 El Niño and 1998-99 La Nina. J Clim. 2001;14:3393–3407. [Google Scholar]
- 26.Huang B, Xue Y, Zhang D, Kumar A, McPhaden MJ. The NCEP GODAS ocean analysis of the tropical Pacific mixed layer heat budget on seasonal to interannual time scales. J Clim. 2010;23(18):4901–4925. [Google Scholar]
- 27.Capotondi A. ENSO diversity in the NCAR CCSM4 climate model. J Geophys Res Oceans. 2013;118:4755–4770. [Google Scholar]
- 28.Jin FF. An equatorial ocean recharge paradigm for ENSO. Part I: Conceptual model. J Atmos Sci. 1997;54:811–829. [Google Scholar]
- 29.Wilson R, et al. Reconstructing ENSO: The influence of method, proxy data, climate forcing and teleconnections. J Quat Sci. 2010;25(1):62–78. [Google Scholar]
- 30.Tierney JE, et al. Tropical sea surface temperatures for the past four centuries reconstructed from coral archives. Paleoceanography. 2015;30(3):226–252. [Google Scholar]
- 31.Emile-Geay J, Cobb K, Mann M, Wittenberg AT. Estimating tropical Pacific SST variability over the past millennium. Part 1: Methodology and validation. J Clim. 2013;26:2302–2328. [Google Scholar]
- 32.Cook ER, et al. Asian monsoon failure and megadrought during the last millennium. Science. 2010;328(5977):486–489. doi: 10.1126/science.1185188. [DOI] [PubMed] [Google Scholar]
- 33.Cook ER, Woodhouse CA, Eakin CM, Meko DM, Stahle DW. Long-term aridity changes in the western United States. Science. 2004;306(5698):1015–1018. doi: 10.1126/science.1102586. [DOI] [PubMed] [Google Scholar]
- 34.Graham FS, et al. Effectiveness of the Bjerknes stability index in representing ocean dynamics. Clim Dyn. 2014;43:2399–2414. [Google Scholar]
- 35.Pacanowski RC, Griffies SM. 1999. MOM 3.0 Manual (NOAA/Geophysical Fluid Dynamics Laboratory, Princeton, NJ), Laboratory Rep 4.
- 36.Large WG, Danabasoglu G, Doney SC, McWilliams JC. Sensitivity to surface forcing and boundary layer mixing in a global ocean model: Annual-mean climatology. J Phys Oceanogr. 1997;27:2418–2447. [Google Scholar]


