Significance
The magnitude, rate, and extent of past and future East Asian monsoon (EAM) rainfall fluctuations remain unresolved. Here, we present a rainfall reconstruction based on the surface area of a closed-basin lake located at the modern northwestern boundary of the EAM. Our record shows that fluctuations of EAM intensity and spatial extent covaried over the past 125 ka. This record contributes to the resolution of a current controversy concerning the response of the EAM to external climatic forcings. We propose that a substantial decrease in rainfall at 5.5 ka was a major factor leading to a large cultural collapse of the Early Neolithic culture in north China.
Keywords: East Asian monsoon, closed-basin lake, paleo-rainfall, Chinese cave record, northward expansion
Abstract
The magnitude, rate, and extent of past and future East Asian monsoon (EAM) rainfall fluctuations remain unresolved. Here, late Pleistocene–Holocene EAM rainfall intensity is reconstructed using a well-dated northeastern China closed-basin lake area record located at the modern northwestern fringe of the EAM. The EAM intensity and northern extent alternated rapidly between wet and dry periods on time scales of centuries. Lake levels were 60 m higher than present during the early and middle Holocene, requiring a twofold increase in annual rainfall, which, based on modern rainfall distribution, requires a ∼400 km northward expansion/migration of the EAM. The lake record is highly correlated with both northern and southern Chinese cave deposit isotope records, supporting rainfall “intensity based” interpretations of these deposits as opposed to an alternative “water vapor sourcing” interpretation. These results indicate that EAM intensity and the northward extent covary on orbital and millennial timescales. The termination of wet conditions at 5.5 ka BP (∼35 m lake drop) triggered a large cultural collapse of Early Neolithic cultures in north China, and possibly promoted the emergence of complex societies of the Late Neolithic.
The East Asian monsoon (EAM) is a major component of the global climate system (1), and its variability directly impacts the lives of over a billion people. Understanding EAM sensitivity to past climate changes and its future variability are essential for determining the EAM response to different climate forcings and for constraining future climate projections. Two competing interpretations of existing paleoclimate records frame our current understanding of the response of the EAM to orbital-scale and high-latitude millennial-scale forcing during the late Pleistocene–Holocene. The first interpretation suggests that oxygen isotopic records from Chinese cave deposits reflect real rainfall changes, indicating a direct response of EAM rains to external climate forcings (2–4). The competing view holds that these isotopic records reflect changes in moisture sourcing and depend on the Indian Monsoon intensity (5–10), suggesting that the cave deposit isotopic values are decoupled from actual rainfall amounts, and thus question the validity of oxygen isotope–based EAM intensity reconstructions. Missing from this debate has been an independent quantitative record of past rainfall variability in the EAM region.
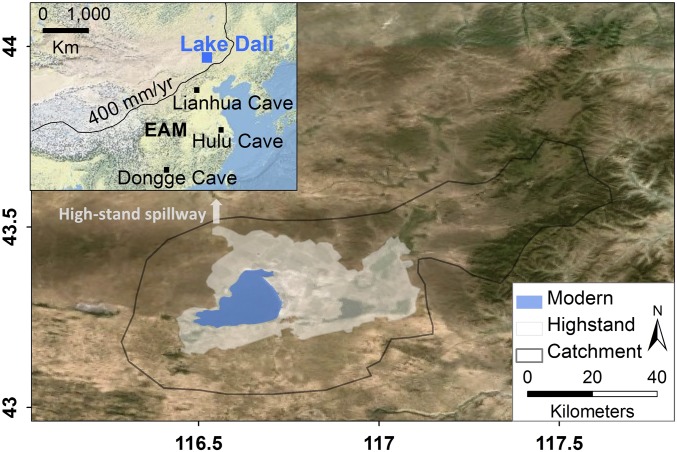
Here, we present a detailed, well-dated lake-level history for Lake Dali (43.15°N, 116.29°E), a closed-basin lake in Inner Mongolia (1,220 m above sea level, 220 km2 lake area and maximum depth of 11 m), presently located near the northwestern limit of EAM domain (e.g., ref. 11; Fig. 1). The peripheral location of Lake Dali with respect to the monsoon region provides an excellent opportunity to examine the magnitude of spatial expansion of the EAM and whether the millennial- and orbital-scale changes observed in Chinese cave deposit records were accompanied by real changes in monsoonal rainfall.
Fig. 1.
Modern and highstand extent and catchment of Lake Dali. Inset shows extent of the EAM (30) and the location of Lake Dali and Lianhua, Hulu, and Dongge caves.
Closed-basin lakes are, to first order, controlled by the amount of rainfall that falls in the catchment of a lake, and thus are powerful recorders of past changes in annual rainfall amounts (12). Lake Dali Lake-level record is unique because closed basin lakes are scarce in the EAM region (13), and thus this record is an independent proxy for the EAM precipitation amount and a benchmark for interpreting the seminal Chinese cave records.
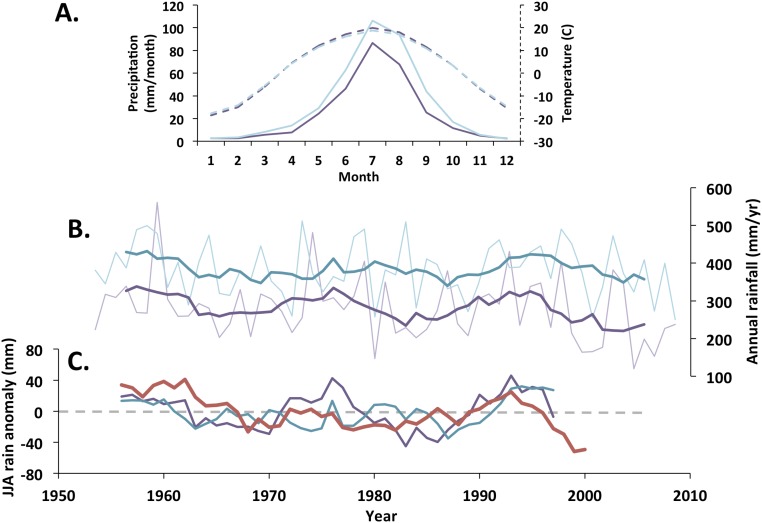
Modern rainfall in Lake Dali occurs during the warm boreal summer (June to September), whereas during boreal winter temperatures drop and the lake freezes over. Local rainfall seasonality and long-term variability are representative of the EAM in northern China (SI Materials and Methods; Fig. S1). Therefore, the water budget of Lake Dali should be sensitive to regional precipitation shifts in northern China and thus reflect EAM fluctuations.
Fig. S1.
Lake Dali climatology. (A) The 48-y (1953–2000) monthly averages of precipitation (solid lines) and temperature (dashed lines) for Duolun (turquoise) and Xilinhot (purple) (47). (B) Time series of annual rainfall (thin lines) and 7 y smooth (thick lines) for Duolun (turquoise) and Xilinhot (purple) (47, 48), and (C) 7-y smoothed JJA rainfall anomaly for north China (33) (red), Duolun (turquoise), and Xilinhot (purple), calculated from 1971 to 2000 average to compare with north China anomaly (33).
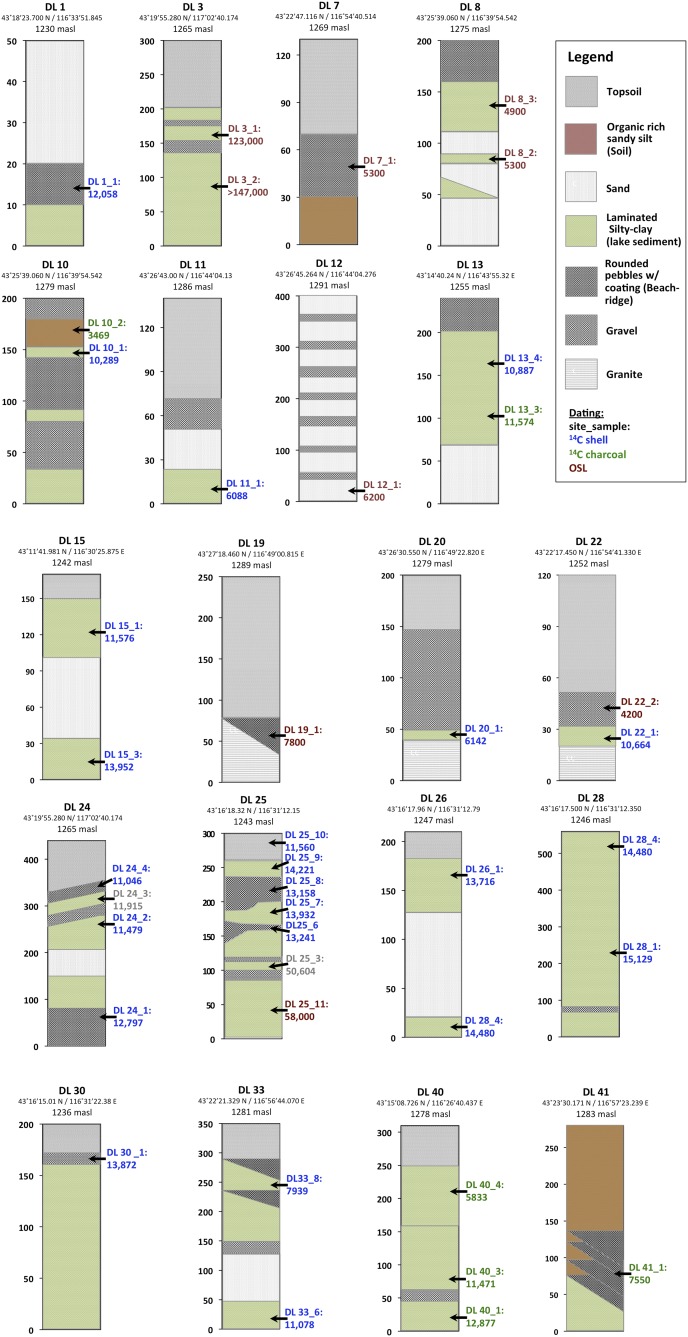
Lake beach ridges and sediment outcrops observed above the modern lake level represent past variations of lake-level elevation and extent. Satellite images and an advanced spaceborne thermal emission and reflection radiometer (ASTER) digital elevation model (DEM; 30-m resolution) were used to locate and map these shoreline markers. In the field, 41 sediment outcrops and beach ridges were mapped and stratigraphic relations were evaluated (Fig. S2). Thirty-six radiocarbon ages were obtained from aquatic shells and charcoal (reported as calibrated calendar ages before present [BP]) and nine optical stimulated luminescence (OSL) samples were measured. Radiocarbon measurements of modern lake and river water dissolved inorganic carbon and a submerged aquatic plant indicate that currently the lake water is at radiocarbon equilibrium with the atmosphere (SI Materials and Methods and Table S1), obviating the need for a reservoir correction. The local geology is composed of Jurassic granite, late Pleistocene basalt, and Quaternary sand dunes (14). The absence of limestone in the catchment of the lake also minimizes possible introduction of old radiocarbon into the lake.
Fig. S2.
Lake Dali stratigraphic sections. The twenty sampling sites used to compile the Lake Dali lake-level curve. The figures depict the stratigraphy as seen in the section. Nonhorizontal contacts depict erosional unconformities. The site name, location, and elevation of each site is located above each section; the elevation refers to the top of the section. 14C dates (blue for shells and green for charcoal) and OSL (burgundy) are located at the sampling elevation and are positioned to the right of the section.
Table S1.
Modern Δ14C values for Lake Dali water, river, and water plant
| Site | ∆14C (‰) | Error (2σ) | Cal BP (y) | Error (2σ) |
| Lake Dali water | 50.7 | 1.9 | 0 | — |
| Lake Dali algae | 54.1 | 2.5 | 0 | — |
| HaoLai River | −204.4 | 1.6 | 1,747 | 84 |
| ShaLi River | −231.0 | 1.6 | 2,070 | 86 |
| LiangZi River | −101.8 | 1.7 | 760 | 60 |
Results
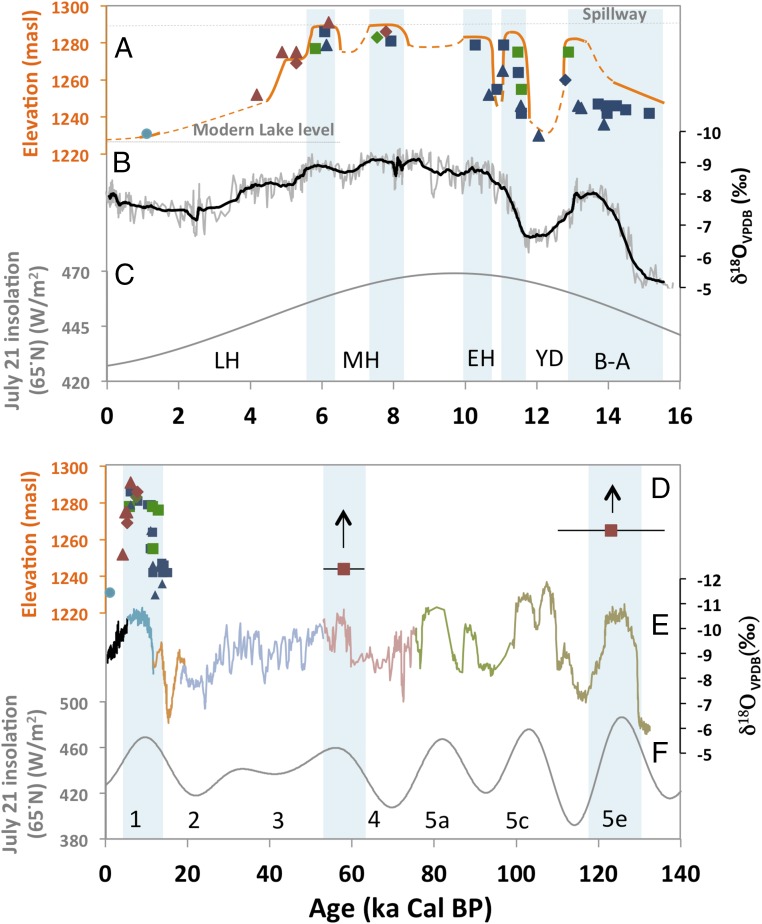
The results show that the lake fluctuated on both orbital and millennial time scales. The lake reached highstands at 123 ± 13 ka (marine isotope stage 5e), 58 ± 5 ka (between marine isotope stages 3 and 4), and 11–5.5 ka (marine isotope stage 1) (Figs. 2 and 3). These three major highstands occurred during periods of high boreal summer insolation, indicating that the intensity/extent of the EAM is governed by summer insolation intensity. Erosion and burial result in scarce pre-Holocene shoreline evidence; therefore, additional highstands cannot be excluded.
Fig. 2.
Lake level reconstruction. (A) Lake Dali level for the past 16 ka, lake sediments (square), alluvial deposits (triangle), and beach ridges (diamond) were dated using 14C from shell (blue), 14C from charcoal (green), and OSL (red). In situ shell layers deposited in the swash zone indicate shoreline proximity; shells found in secondary deposition within alluvial sediments indicate lake level was higher than the elevation the shells were eroded into (SI Materials and Methods; Tables S2–S4). The lowest section of the Jin Wall indicates an upper limit for lake level (turquoise circle). Dashed orange lines represent times when the magnitude of lake level change is uncertain. (B) Oxygen isotope composition from Dongge Cave (19). (C) North hemisphere summer (July 21) insolation at 65°N (2, 31). (D) Same as A for the past 140 ka. (E) Compiled oxygen isotope composition of the Chinese cave deposits (light blue is from Hulu Cave; all other colors are different stalagmites from Sanbao Cave) (2). (F) Same as C for the past 140 ka.
Fig. 3.
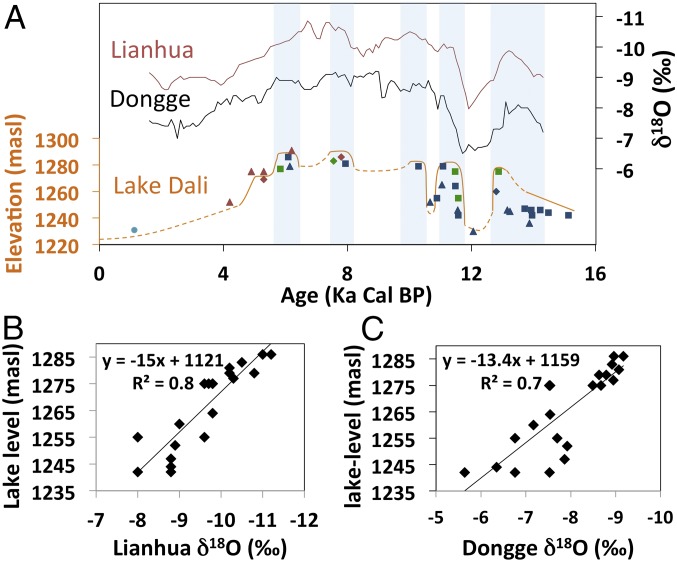
Lake Dali lake level vs. cave δ18Oc. (A) Smoothed δ18Oc Lianhua (red curve, 5-point average) and Dongge (black, 10-point average), and Lake Dali lake level (orange). (B) Correlation between Lianhua δ18Oc and Lake Dali lake level. (C) Correlation between Dongge δ18Oc and Lake Dali lake level. Light-blue bars represent highstands of the lake.
During the Late Glacial (16–11.5 ka) the lake fluctuated on millennial time scales, with the Bølling–Allerød (B–A) and Younger Dryas periods having high and low lake levels, respectively (Fig. 2). These abrupt fluctuations occurred during times of relatively low insolation and are coeval with Greenland and circum-North Atlantic records, indicating that the EAM responded to climatic forcings that originated in the North Atlantic through teleconnections most likely related to shifts in the position of the thermal equator (15) and the associated shifts in the westerlies position (10).
Lake levels during the Early and Middle Holocene were overall high, corresponding to the Early Middle Holocene summer (June–August; JJA) insolation maxima. The onset (∼60 m rise in 400 y) and termination (∼35 m drop in 1 ka) of the Holocene humid period occurred rapidly. During four intervals in the Early and Middle Holocene (11.5–11, 10.5–9.5, 8.3–7.8, and 6.1–5.9 ka), lake levels were particularly high, with lake drops occurring between these intervals. These millennial fluctuations appear in both north China lake (16) and sea surface temperature records (17); their cause is not clear at this time.
Discussion
The main point of contention over the interpretation of the Chinese cave deposit isotope records is whether the isotopic composition of precipitation in China (δP) is correlated with the amount of local rainfall over China. To evaluate whether the Chinese cave deposits represent actual rainfall amounts, we compare the Lake Dali record to two cave deposit records from north (Lianhua Cave located ∼600 km south of Lake Dali; ref. 18) and south China (Dongge Cave located ∼1,500 km south of Lianhua Cave; ref. 19; Fig. 1).
The results show that Lake Dali lake-level history is negatively correlated with both cave records on both precessional and millennial time scales (r2 = 0.8 and 0.7 for Lianhua and Dongge, respectively) (Fig. 3 and Fig. S3). High Dali lake levels correspond with depleted Chinese cave deposits isotopic compositions and vice versa. These results indicate that to first order, the isotopic composition of precipitation is correlated with local rainfall amount over northern China and that both are regulated by EAM intensity.
Fig. S3.
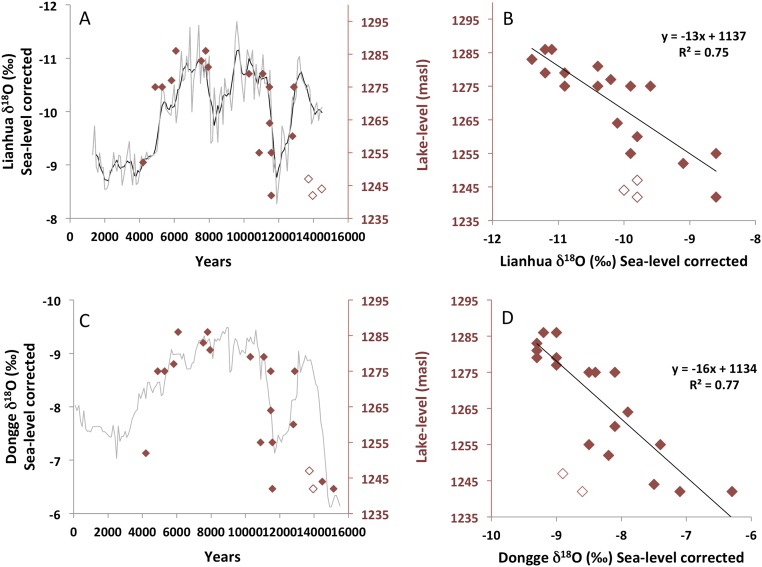
The δ18O sea-level correction for Lianhua and Dongge and correlation with Lake Dali. (A) Lianhua δ18O record corrected for composition of the ocean. The correction was made using a 100-y interpolation of the cave data (18) and subtracting the change of the isotopic composition of sea water using a 100-y interpolation of sea-level (41) and a 1‰ difference glacial to interglacial (42) (gray line, 5 point smooth black line). The cave δ18O data are presented in VPDB scale (18), whereas the isotopic value of seawater is presented in VSMOW scale (42). The difference is 3% and is temperature sensitive (43); as cave temperature is unknown and the correction is small, we neglect this correction. The correlation is based only on radiocarbon samples that we view as most indicative of Lake Dali lake level (red diamonds). Three points were omitted from the correlation (open diamonds). (B) Correlation between Lake Dali lake level and Lianhua Cave δ18O. Note that three points from the B–A were omitted from this correlation (open diamonds). (C) Same as A for Dongge cave, omitting two points. (D) Same as B for Dongge cave, omitting two points (open diamonds).
The great advantage of closed-basin lakes is the quantitative constrains they can provide on paleo-rainfall amounts through a lake hydrological model. At equilibrium (stable lake level), the amount of water evaporating from the lake surface matches the inflow into the lake, which is calculated as the fraction of precipitation in the catchment that enters the lake as runoff multiplied by the catchment area of the lake and precipitation amount (20). To constrain the model, we first investigated the modern lake using satellite imagery, lake and stream chemistry, and long-term measurements of precipitation, air temperature, and evaporation (SI Materials and Methods). The results show that modern Lake Dali is a closed-basin lake at steady state, which allows us to use a closed-basin lake model and derive the essential modern hydrological parameters (e.g., lake evaporation and fraction of runoff).
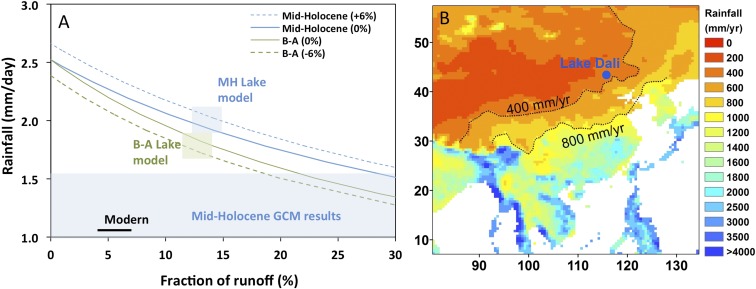
To model the paleohydrology of the lake during the Holocene humid period and during the B–A, we used a digital elevation model to reconstruct the area of the lake based on the reconstructed lake level and a range of plausible lake evaporation rates using the Penman evaporation equation (21) and temperature reconstructions from the Chinese Sea (22) and climate models (23). To constrain the fraction of catchment runoff that enters the lake we used the Budyko relationship, which is an empirical model that relates the runoff fraction (rainfall/runoff) with precipitation amounts (24, 25). Our results show that annual precipitation during the early Holocene highstands must have been about double the present value for this lake basin (Fig. 4A). Because the lake likely overflowed during this time, this value should be regarded as a minimum estimate. Sustaining the B–A lake level would require 160–170% of modern precipitation values (Fig. 4A; SI Materials and Methods). Based on the modern spatial distribution of rainfall in China, a doubling of rainfall (from 400 to 800 mm/y) would require an ∼400 km northwestern movement of the 800-mm/y isohyet (Fig. 4B). Higher lake levels during the B–A, Middle and Early Holocene are most likely the outcome of two processes, the overall intensification of the EAM (as represented by the Chinese cave records), and a northwestern expansion of the monsoon. Assessing the proportional contribution of both processes is not possible at this time due to the lack of quantitative rainfall reconstructions from the central region of the EAM.
Fig. 4.
Rainfall reconstructions. (A) The Holocene humid period (blue lines) and B–A (green lines) hydrologic scenarios calculated using a combination of a closed-basin lake model with the Budyko relation between precipitation amount and runoff fraction (blue and green shaded squares). The solid lines are for no change in evaporation rate, and the dashed lines include changes in evaporation rate calculated using the Penman equation (SI Materials and Methods). The range of general circulation model (GCM) precipitation values for the Mid-Holocene humid period is shown in the shaded blue band (SI Materials and Methods; Table S5). The modern rainfall and fraction of runoff is shown for comparison (black line). (B) East Asian modern rainfall distribution (shaded) (data from the Global Precipitations Climatology Centre, www.esrl.noaa.gov/psd/data/gridded/data.gpcc.html). A doubling of rainfall during the Early and Middle Holocene (from 400 to 800 mm/y) requires an ∼400 km northward shift of the 800 mm isohyet.
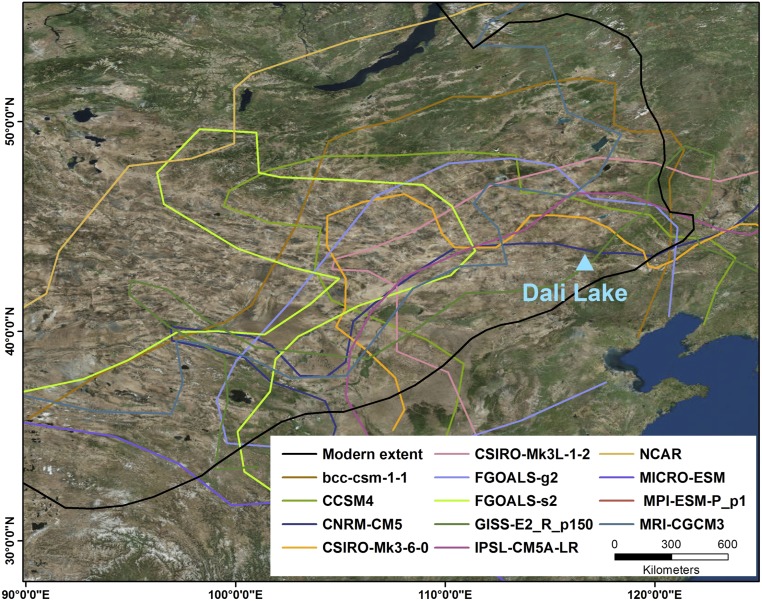
We compared our reconstructions of precipitation amount and the inferred northward extension of the EAM during the Holocene humid period to the 6-ka simulations from 12 paleoclimate modeling intercomparison project phase 3 (PMIP3) and National Center for Atmospheric Research (NCAR) general circulation models. Eleven of thirteen models accurately capture the northwestward EAM expansion. However, annual precipitation estimates from these simulations underestimate the magnitude of northern China hydrological change by 50% (Fig. 4) (SI Materials and Methods, Fig. S4, Table S5, and ref. 26 for similar conclusions).
Fig. S4.
Mid-Holocene summer extent of the EAM in GCM models. Shown is the modern 400-mm/y isohyet which is a qualitative representation of the modern extent of the EAM (black line) and the middle Holocene expansion of the EAM in model reconstructions (colored lines).
Table S5.
GCM results
| Model | Increase in annual precipitation (mm/d) | Increase in summer precipitation (mm/d) | Extent of monsoon in summer |
| bcc-csm-1–1 | 0 | 0.5–0.75 | V |
| CCSM4 | 0.25–0.5 | 0.5–0.75 | V |
| CNRM-CM5 | 0.25–0.5 | 0.25–0.5 | V |
| CSIRO-Mk3L-1–2 | 0.25–0.5 | 1–2 | V |
| CSIRO-Mk3-6–0 | 0.25–0.5 | 0.5–0.75 | V |
| FGOALS-g2 | 0 | 0.5–0.75 | V |
| FGOALS-s2 | 0 | 0 | — |
| GISS-E2-R_p150+151 | 0 | 0 | — |
| IPSL-CM5A-LR | 0.25–0.5 | 0.5–0.75 | V |
| NCAR | 0–0.5 | 1–2 | V |
| MICRO-ESM | 0–0.25 | 0 −0.25 | — |
| MPI-ESM-P_p1+p2 | 0.25–0.5 | 0.75–1 | V |
| MRI-CGCM3 | 0.25–0.5 | 0.75–1 | V |
Middle Holocene increases in annual and summer precipitation with respect to modern and whether (V) or not (−) the monsoon reaches Lake Dali in summer. (For details regarding the models see: www-pcmdi.llnl.gov/.)
Our results suggest the abrupt termination of the Holocene humid period at 5.5–5 ka had dramatic impacts on the social development of Chinese culture. At this time, a major cultural transition occurred in north and central China identified by the disappearance of Early Neolithic cultures (Hongshan culture in North China, which existed from 6.5 to 5 ka, and Yangshao culture in central China which existed from 7 to 5 ka) (27). In central China, Early Neolithic cultures were replaced by stratified and socially and politically complex Late Neolithic cultures (e.g., Longshan culture that existed from 5 to 3.9 ka) (27), and previously unoccupied areas on the eastern margin of the Tibetan plateau were populated (28). In contrast, northeast China experienced a sharp population decline represented by the Xiaoheyan culture, which existed between 5 and 4.2 ka (27, 29). The sharp decline of north China rainfall amounts as recorded in Lake Dali, may have triggered contrasting reorganizations of north and central China cultures, causing a rapid population collapse in northern China and promoting structured complex societies in central China.
Materials and Methods
Lake beach ridges identified using satellite images and an ASTER digital elevation model were mapped in the field; stratigraphic relations were evaluated and samples were collected for dating.
Thirty-six shell and charcoal samples were dated using conventional radiocarbon methods. Analysis of modern lake water samples showed that there is no old radiocarbon in the lake. Nine sediment samples were dated using conventional OSL methods.
The hydrological model combines a closed-basin mass balance equation with the Budyko relationship, which is an empirical model that relates runoff fraction with precipitation amount and the Penman equation to quantify lake evaporation. The percent rainfall increase between modern and lake highstand, calculated using the hydrological model, was compared with the 6-ka simulations from 12 PMIP3 and NCAR general circulation models.
SI Materials and Methods contains a detailed description of sampling, dating, hydrological modeling, and comparison of the lake level with the ice-volume corrected δ18Oc from the Chinese cave records.
SI Materials and Methods
Climatology.
Modern climatology of Lake Dali was evaluated using 57 y (1953–2009) of rainfall and temperature data from two stations located 80 km northwest (Xilin hot) and 110 km south (Duolun) of the lake (32). Rainfall occurs during the warm boreal summer (June to September), during boreal winter temperatures drop and the lake freezes over (Fig. S1A). The rainfall anomalies from both sites (7 y running average) are similar in magnitude and coevally timed with rainfall anomalies in north China (33) (Fig. S1 B and C).
Dating Methods.
Radiocarbon.
Carbon from shell and charcoal samples from lake sediment outcrops were radiocarbon dated by two laboratories: The Keck Carbon Cycle Accelerator Mass Spectrometry (AMS) Laboratory at University of California (UC), Irvine (for detailed method, see ref. 34) and at The Xi’an-AMS center (for detailed method, see ref. 35). A total of 36 14C samples were measured, 13 of which were measured by both laboratories. In addition, lake and river water and a submerged aquatic plant were measured to assess the presence of aged carbon in the lake. Radiocarbon concentrations are given as fractions of the modern standard, ∆14C, and conventional radiocarbon age, following standard conventions (36). All results have been corrected for isotopic fractionation according to standard convention (36), with δ13C values measured on prepared graphite using the AMS. All results were converted to calibrated calendar ages BP (Cal BP) ages using OxCal 4.2 online (37, 38).
Lake water and a submerged water plant/algae sampled in June 2014 show Δ14C values similar to atmospheric ones (−50‰ as measured by the Scripps CO2 program in 2009; scrippsco2.ucsd.edu/), indicating that the 14C in the lake is in equilibrium with the atmosphere (Table S1). The river waters do contain aged carbon; however, the lake Δ14C value indicates that atmospheric CO2 is rapidly exchanged with the lake water overprinting any river-derived aged carbon (Table S1). These results indicate that no reservoir correction in needed for the modern lake. Based on the modern results, we do not apply a reservoir correction to the ancient samples. The similarity of radiocarbon ages on charcoal and shells from the lake and OSL ages from the same stratigraphic intervals, as well as the similar onset age of the Holocene lake rise derived from our results, compared with the age derived from speleothem U-series dating (39), validate the assumption that any reservoir correction is within the error of our dating methods and is not required.
We analyzed radiocarbon samples in two laboratories (Xi’an and Irvine, see above). To assess the consistency between laboratories, we analyzed two charcoal samples in both Irvine and Xi’an laboratories (DL 10_2 and DL 13_3). The differences between the laboratories are within the analytical errors (77 and 38 y, for DL 10_2 and DL 13_3, respectively). In addition, we performed three sequential leachings on two carbonate shell samples (the samples were acidified with 14.6 N phosphoric acid under vacuum for three cycles of 15 min). The results showed that there is possible minor secondary carbonate contamination in some of the samples (Table S2), which would produce younger ages. If present, the contamination would produce younger ages by a few hundred years, which would not substantially alter our results. For each duplicate measurement of a sample, the oldest age was chosen with the assumption that the younger age resulted from larger amounts of contaminating younger carbon (Tables S2 and S3). Samples with measured ages >40 ka were discarded, as they lie beyond the limitation of conventional radiocarbon dating. Samples that originated in sedimentary layers that are suspected as being redeposited based upon field relations and observations were also discarded.
Table S2.
Radiocarbon data
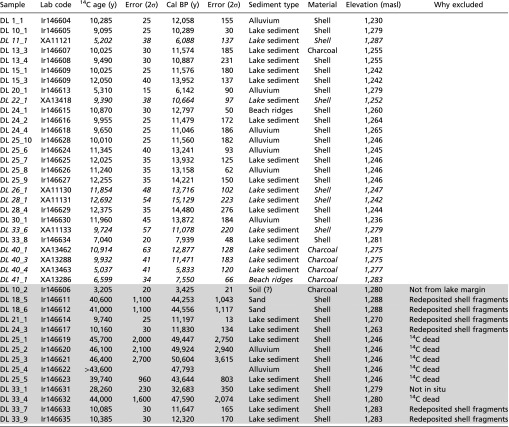 |
Radiocarbon ages used to produce the Lake Dali lake-level curve. Regular font indicates samples measured at UC Irvine, italic font indicates samples that were measured in Xi'an. Samples not used to reconstruct lake levels are in gray with the reason for excluding them noted.
Table S3.
Leaching experiments
| Sample name | Leaching order | Lab | 14C (BP) | |
| 14C age | Error (2σ) | |||
| DL 13_4 | First leaching | Xi'an | 8,940 | 37 |
| DL 13_4 | Second leaching | Xi'an | 9,030 | 37 |
| DL 13_4 | Third leaching | Xi'an | 9,050 | 51 |
| DL 15_3 | First leaching | Xi'an | 11,940 | 44 |
| DL 15_3 | Second leaching | Xi'an | 11,900 | 42 |
| DL 15_3 | Third leaching | Xi'an | 12,010 | 42 |
Results of leaching experiments on two carbonate shell samples. Later leaches generally produced slightly older ages, suggesting a small amount of easily dissolved contaminating carbonate phase in some samples. OD, overdispersion.
OSL dating.
Optical stimulated luminescence dating was performed on nine samples, at the OSL laboratory at the Geological Survey of Israel. In the field, a metal tube was hammered into a freshly cleaned section, extracted, and immediately sealed in a light-tight bag. The samples were wet sieved to extract the 90–125-μm grain size, dissolved in 3 M HCl to remove carbonates, passed through a Frantz magnetic separator to remove undissolved carbonates and heavy minerals, dissolved in 22 M HF to removed feldspars, and finally rinsed with 5 M HCl to remove fluorides.
The OSL measurements were carried out on a Risø DA-15 TL/OSL and Risø DA-12 readers equipped with an integral 90Sr beta source with dose rates of 2.25 and 2.7 Gray/min, respectively. Blue LED stimulation and detection was through 6-mm U-240 filters. Successful dose recovery tests (>94% recovery) were conducted on two aliquots of each sample to determine the ability to recover a pregiven laboratory dose and to assess the proper preheat and cut heat temperatures. The single-aliquot regenerative-dose (SAR) protocol was used to determine the equivalent dose (De) on 12–18 aliquots of 2-mm diameter from each sample. Each sample was stepwise irradiated and normalized until the natural signal was regenerated. A dose–response curve was generated from five dose points, one of which is a repeat to assess IR depletion, and two zero dose points. The scatter in the De values was used to assess bleaching before deposition and the reliability of the age. The central age model was used to calculate the representative age of the sample and a 1σ uncertainty. Alpha, beta, and gamma dose rates were calculated from U, Th, and K concentrations in the sediment. U and Th were measured by inductivity coupled plasma mass spectrometer (ICP-MS), and K was measured by inductivity coupled plasma atomic emission spectroscopy (ICP-AES). Cosmogenic dose rate was calculated from burial depth (40). Water content was estimated based on sediment type measured in two outcrops, assigning a value of 5% to alluvial coarse-grained sediments, 10% for silt lake sediments, and 15% for clay-rich lake sediment. Results are summarized in Table S4.
Table S4.
OSL results from Lake Dali
| Sample number | Burial depth (m) | Water (%) | Grain size (µm) | K (%) | U (ppm) | Th (ppm) | Ext. α (μGy/y) | Ext. β (μGy/y) | Ext. γ (μGy/y) | Cosmic (μGy/y) | Total dose (μGy/y) | No. aliquots | OD (%) | De (Gy) | Age (ka) | Error (1σ) | Elevation (masl) | Material |
| DL 3_1 | 1.1 | 10 | 125–150 | 1.41 | 0.5 | 2.1 | 3 | 990 | 448 | 183 | 1,623 ± 44 | 13/13 | 36 | 199 ± 21 | 123 | 13 | 1,265 | Lake sediment |
| DL 7_1 | 0.6 | 5 | 90–125 | 1.4 | 1.3 | 4.9 | 7 | 1,206 | 681 | 203 | 2,097 ± 65 | 17/18 | 23 | 11.2 ± 0.7 | 5.3 | 0.4 | 1,269 | Beach ridges |
| DL 8_2 | 1 | 10 | 90–125 | 1.87 | 1.3 | 3.1 | 5 | 1,394 | 672 | 185 | 2,257 ± 81 | 18/18 | 17 | 11.9 ± 0.5 | 5.3 | 0.3 | 1,275 | Alluvium |
| DL 8_3 | 1.4 | 10 | 90–125 | 1.91 | 1.5 | 3 | 6 | 1,441 | 697 | 176 | 2,320 ± 69 | 18/18 | 18 | 11.5 ± 0.5 | 4.9 | 0.3 | 1,275 | Alluvium |
| DL 12_1 | 4 | 5 | 90–125 | 1.36 | 1.5 | 5.6 | 8 | 1,220 | 725 | 129 | 2,083 ± 69 | 17/17 | 17 | 12.8 ± 0.8 | 6.2 | 0.5 | 1,291 | Alluvium |
| DL 18_8 | 4.5 | 10 | 90–125 | 2.18 | 1.5 | 5.9 | 8 | 1,674 | 880 | 122 | 2,683 ± 80 | 6/6 | 11 | 314 ± 17 | >117 | 8 | 1,286 | Alluvium |
| DL 19_1 | 2.4 | 5 | 90–125 | 1.83 | 1.7 | 7.3 | 10 | 1,597 | 931 | 156 | 2,694 ± 72 | 18/18 | 16 | 21.1 ± 0.9 | 7.8 | 0.4 | 1,286 | Beach ridges |
| DL 22_2 | 0.8 | 5 | 90–125 | 2.41 | 2.1 | 8.9 | 12 | 2,069 | 1,179 | 176 | 3,436 ± 94 | 18/18 | 13 | 14.4 ± 0.5 | 4.2 | 0.2 | 1,252 | Alluvium |
| DL 25_11 | 2.6 | 15 | 90–125 | 2.41 | 1 | 2.9 | 4 | 1,605 | 714 | 152 | 2,476 ± 91 | 12/14 | 45 | 143 ± 12 | 58 | 5 | 1,244 | Lake sediment |
All samples used to produce Lake Dali lake-level curve, where OD is overdispersion and De is the equivalent dose.
Comparison of Lake Dali lake level with Lianhua and Dongge δ18O records.
Correlation between Lake Dali lake levels and Lianhua and Dongge δ18O were calculated for both the raw δ18O (shown in Fig. 3) and δ18O corrected for changes in ice volume/sea level (Fig. S3). The correction for ice volume/sea level was made using a 100-y interpolation of the cave data (18), subtracting the change of the isotopic composition of sea water using a 100-y interpolation of sea level (41) and a 1‰ difference between glacial and interglacial sea levels (42) (gray line, 5 point smooth black line). The cave δ18O data are presented on the Vienna Pee Dee Belemnite (VPDB) scale (18), whereas the isotopic value of seawater is presented in Vienna Standard Mean Ocean Water (VSMOW) scale (42). The difference between theses two scales is ∼3% and is temperature sensitive (43); as cave temperature is unknown and the correction is small, we neglect this correction. The correlation between lake level and both the raw and ice-volume corrected δ18O is based only on radiocarbon samples that we view as most indicative of Lake Dali lake level. Based on the age of the sample and the possible 2σ uncertainty we chose the δ18O value that maximizes the correlation. For the correlation with the raw data all points were used (Fig. 3). The sea level corrected δ18O show more enriched values for the B–A δ18O, which do not match the data from the lake level. Therefore, in the sea level corrected data we omitted some of the B–A samples (Fig. S3).
Lake hydrologic modeling.
The area of a lake is governed by the inputs and output of the lake (20). At steady state, the inputs equal outputs, such that:
where P is precipitation (meters per year); Al area of lake (square meters); Ac area of catchment (square meters), where the area of the lake is subtracted from the area of the catchment; FR fraction of watershed precipitation that reaches the lake (including runoff and springs) (in fractional units between 0 and 1); E evaporation from the lake surface (meters per year); and G is ground water discharge from the lake (meters cubed per year).
Modern lake hydrology.
The first step in reconstructing the paleohydrology of the lake is to assess the modern hydrologic mass balance and to derive the required parameters of the system. Precipitation (P) was determined as 0.39 m/y using the 50 y (1953–2000) precipitation average from Duolun (Fig. S1). Lake evaporation (E) was calculated as 0.92 m/y using the 50 y (1953–2000) pan evaporation average for north China plains (44) multiplied by 0.77 to convert pan to lake evaporation (45). The modern average lake area (Al) of 265.8 km2 is the average lake area evaluated using 10 satellite images taken between 1968 and 1992 and the ASTER DEM. During this time the lake only minimally fluctuates, indicating that the lake is at steady state. The catchment area (Ac) of 5,236.2 km2 was calculated using the ASTER DEM and satellite imagery and the area of the lake was subtracted from the total catchment area (negligible for the modern hydrology but significant for the Holocene highstand). Groundwater seepage from the lake (G) was determined by mass balance of chloride in the lake. We measured the chloride concentration of Lake Dali and the rivers running into the lake using ion chromatography. The results show that chloride in the lake is ∼200 times that in the rivers (1,505 and 8 mg/L for lake water and average river, respectively). Using a mass balance equation of Cl flux (F) into and out of the lake, Friver × [Cl]in = Fground water out × [Cl]lake shows that the maximum water flux out of the lake is 0.5% of the input. Thus, ground water loss out of the lake is very small and can be neglected for the hydrologic model although it is important for lake chemistry. Runoff fraction (FR) was calculated in two ways, first, using the steady-state closed-basin hydrological model presented above results in FR = 7%. The second way using the Budyko relationship, an empirical model that relates the amount of evaporation from the catchment with the amount of precipitation (24):
In this equation, Ec is catchment evaporation calculated as D = Rnet/P λ where D is the dryness index, Rnet is mean annual net radiation, P is annual precipitation, λ is latent heat of vaporization, and Rnet/λ is potential evaporation (24). Potential evaporation can be measured by the radiative balance (25) or by pan evaporation, both methods show similar results of D ≅ 3. For the calculations we choose to use the empirical long-term pan evaporation data (D = 3.05), which results in FR = 4%. Therefore, both the closed-basin model and the Budyko yield similar results, showing that the Budyko relation is suitable to be used in Lake Dali.
Paleolake hydrology.
The paleolake areas (Al) of 1,707 km2 for the Holocene and 1,400 km2 for the B–A were calculated using the ASTER DEM and the reconstructed lake level. The watershed area (AC) is the same as the modern lake. Lake evaporation (E) was calculated using the Penman lake evaporation equation (21), which shows a lake evaporation sensitivity to temperature of 64 mm y−1 °C−1. Temperature reconstructions from the North China Sea (17) and climate models (23) show that the Middle Holocene and B–A were 1 °C warmer and 1 °C colder than present, respectively. Based on the sensitivity of evaporation to temperature change in the Penman equation, a 1 °C change would produce evaporation rate changes of ∼6% higher and ∼6% lower during the Mid-Holocene and B–A, respectively. For each time interval we first calculated the precipitation amount for a 6% increase (Mid-Holocene) or 6% decrease (B–A) in lake evaporation (dashed lines in Fig. 4) and second using the modern evaporation rate (solid lines in Fig. 4). We also evaluated the sensitivity of our lake evaporation estimates to wind speed; today summer wind speeds are 30 km/h (46). We examined scenarios of ± 20% change in wind speed. These lead to ±10–15% change in evaporation relative to modern. Combined with a temperature change of 1 °C, this would lead to a ±20% possible error on the rainfall estimate, much smaller than the inferred changes in rainfall. Groundwater outflow (G) was kept the same as for modern conditions where we assume that there is no groundwater outflow from the lake.
For the paleolakes, precipitation (P), catchment evaporation (Ec), and runoff fraction (FR) cannot be constrained independently; therefore, we used both the closed-basin lake model and the Budyko relation to assess these parameters. The results show that both the Budyko and lake water balance equations can be satisfied with P = 1.9 mm/d and FR = 14% for the Mid-Holocene and with P = 1.8 mm/d and FR = 13% for the B–A. These results show that 200% (Mid-Holocene) and 165% (B–A) of modern precipitation was required to maintain the hydrological balance of the lake.
GCM 6-ka simulations.
Reconstructed precipitation amounts and EAM extent were evaluated in the 6 ka simulations of the 12 PMIP3 models (pmip3.lsce.ipsl.fr/) and the NCAR model (www.cesm.ucar.edu/experiments/cesm1.0/#paleo). The EAM extent, interpreted as an increase in precipitation, is shown in Fig. S4, and the fraction of modern precipitation in Table S5. The reconstructed annual precipitation amounts for northern China derived from global circulation models are 50% lower then our results derived from Lake Dali closed-basin lake model, this discrepancy is in agreement with ref. 26, which showed a GCM’s reconstruction underestimate precipitation in respect to that reconstructed from paleohydrology proxies.
Acknowledgments
We thank G. Shelach-Lavi for his advice regarding the archaeology of China. We thank E. Sheng and T. Liu for their great help in the field. We thank the editor and two anonymous reviewers whose comments improved the paper. This work was supported by a Gary Comer Science and Education Foundation grant to Y.G. and P.J.P.; Columbia's Center for Climate and Life; the National Basic Research Program of China Grant 2013CB955900; the External Cooperation Program of Bureau of International Cooperation, Chinese Academy of Sciences Grant 132B61KYSB20130003; and Lamont–Doherty Earth Observatory Contribution no. 8084.
Footnotes
The authors declare no conflict of interest.
This article is a PNAS Direct Submission.
This article contains supporting information online at www.pnas.org/lookup/suppl/doi:10.1073/pnas.1616708114/-/DCSupplemental.
References
- 1.An Z, et al. Asychronous Holocene optimum of the East Asian monsoon. Quat Sci Rev. 2000;19:743–762. [Google Scholar]
- 2.Wang Y, et al. Millennial- and orbital-scale changes in the East Asian monsoon over the past 224,000 years. Nature. 2008;451(7182):1090–1093. doi: 10.1038/nature06692. [DOI] [PubMed] [Google Scholar]
- 3.Liu Z, et al. Chinese cave records and the East Asia Summer Monsoon. Quat Sci Rev. 2014;83:115–128. [Google Scholar]
- 4.Orland IJ, et al. Direct measurements of deglacial monsoon strength in a Chinese stalagmite. Geology. 2015;43(6):555–558. [Google Scholar]
- 5.Maher BA. Holocene variability of the East Asian summer monsoon from Chinese cave records: A re-assessment. Holocene. 2008;18(6):861–866. [Google Scholar]
- 6.Pausata FSR, Battisti DS, Nisancioglu KH, Bitz CM. Chinese stalagmite δ18O controlled by changes in the Indian monsoon during a simulated Heinrich event. Nat Geosci. 2011;4(7):474–480. [Google Scholar]
- 7.Lee J-E, et al. Asian monsoon hydrometeorology from TES and SCIAMACHY water vapor isotope measurements and LMDZ simulations: Implications for speleothem climate record interpretation. J Geophys Res. 2012;117(D15):D15112. [Google Scholar]
- 8.Battisti DS, Ding Q, Roe GH. Coherent pan-Asian climatic and isotopic response to orbital forcing of tropical insolation. J Geophys Res Atmos. 2014;119(21):11997–12020. [Google Scholar]
- 9.Caley T, Roche DM, Renssen H. Orbital Asian summer monsoon dynamics revealed using an isotope-enabled global climate model. Nat Commun. 2014;5:5371. doi: 10.1038/ncomms6371. [DOI] [PubMed] [Google Scholar]
- 10.Chiang JCH, et al. Role of seasonal transitions and westerly jets in East Asian paleoclimate. Quat Sci Rev. 2015;108:111–129. [Google Scholar]
- 11.An Z, et al. Global monsoon dynamics and climate change. Annu Rev Earth Planet Sci. 2015;43:29–77. [Google Scholar]
- 12.Street-Perrott FA, Harrison SP. Lake levels and climate reconstruction. In: Hecht AD, editor. Paleoclimate Data and Modeling. John Wiley; New York: 1985. pp. 291–340. [Google Scholar]
- 13.Yu G, Ke X. Lake level studies/Asia. In: Scott AE, editor. Encyclopedia of Quaternary Science. Vol 2, 1st Ed. Elsevier; Amsterdam: 2007. pp. 1343–1359. [Google Scholar]
- 14.Bureau of Geology and Mineral Resources of Nei Mongol Autonomous Region . Regional Geology of Nei Mongol (Inner Mongolia) Autonomous Region. Geological Memoirs, Series 1. Geology Publishing House; Beijing: 1991. [Google Scholar]
- 15.Broecker W, Putnam AE. How did the hydrologic cycle respond to the two-phase mystery interval? Quat Sci Rev. 2012;57:17–25. [Google Scholar]
- 16.Schettler G, et al. East-Asian monsoon variability between 15,000 and 2000 cal. yr BP recorded in varved sediments of Lake Sihailongwan (northeastern China, Long Gang volcanic field) Holocene. 2006;8:1043–1057. [Google Scholar]
- 17.Kubota Y, et al. Variations of East Asian summer monsoon since the last deglaciation based on Mg/Ca and oxygen isotope of planktic foraminifera in the northern East China Sea. Paleoceanography. 2010;25(4):PA4205. [Google Scholar]
- 18.Dong J, Shen C, Kong X, Wang H, Jiang X. Reconciliation of hydroclimate sequences from the Chinese Loess Plateau and low-latitude East Asian Summer Monsoon regions over the past 14,500 years. Palaeogeogr Palaeoclimatol Palaeoecol. 2015;435:127–135. [Google Scholar]
- 19.Dykoski CA, et al. A high-resolution, absolute-dated Holocene and deglacial Asian monsoon record from Dongge Cave, China. Earth Planet Sci Lett. 2005;233(1-2):71–86. [Google Scholar]
- 20.Broecker WS, Putnam AE. Hydrologic impacts of past shifts of Earth’s thermal equator offer insight into those to be produced by fossil fuel CO2. Proc Natl Acad Sci USA. 2013;110(42):16710–16715. doi: 10.1073/pnas.1301855110. [DOI] [PMC free article] [PubMed] [Google Scholar]
- 21.Penman HL. Natural evaporation from open water, hare soil and grass. Proc R Soc Lond A Math Phys Sci. 1948;193(1032):120–145. doi: 10.1098/rspa.1948.0037. [DOI] [PubMed] [Google Scholar]
- 22.Sun Y, Oppo DW, Xiang R, Liu W, Gao S. Last deglaciation in the Okinawa Trough: Subtropical northwest Pacific link to Northern Hemisphere and tropical climate. Paleoceanography. 2005;20(4):PA4005. [Google Scholar]
- 23.Braconnot P, et al. Results of PMIP2 coupled simulations of the Mid-Holocene and Last Glacial Maximum. Part 1: Experiments and large-scale features. Clim Past. 2007;3(2):261–277. [Google Scholar]
- 24.Budyko MI. Climate and Life. Academic; San Diego: 1974. [Google Scholar]
- 25.Koster RD, Fekete BM, Huffman GJ, Stackhouse PW. Revisiting a hydrological analysis framework with International Satellite Land Surface Climatology Project Initiative 2 rainfall, net radiation, and runoff fields. J Geophys Res. 2006;111(D22):1–12. [Google Scholar]
- 26.Harrison SP, et al. Evaluation of CMIP5 palaeo-simulations to improve climate projections. Nat Clim Chang. 2015;5(8):735–743. [Google Scholar]
- 27.Shelach-Lavi G. The Archaeology of Early China: From Prehistory to the Han Dynasty. Cambridge Univ Press; New York: 2015. [Google Scholar]
- 28.Guedes A. Rethinking the spread of agriculture to the Tibetan Plateau. Holocene. 2015;25(9):1498–1510. [Google Scholar]
- 29.Shelach-Lavi G, et al. Human adaptation and socio-economic change in Northeast China: Results of the Fuxin Regional Survey. J Field Archaeol. 2016;41(4):467–485. [Google Scholar]
- 30.An Z, Sun Y, Chang H, Zhang P, Liu X. Late Cenozoic Climate Change in Monsoon-Arid Asia and Global Changes. Springer; Dordrecht: 2014. [Google Scholar]
- 31.Berger AL. Long-term variations of caloric insolation resulting from the earth’s orbital elements. Quat Res. 1978;9(2):139–167. [Google Scholar]
- 32.Yang X, Ding Z, Fan X, Zhou Z, Ma N. Processes and mechanisms of desertification in northern China during the last 30 years, with a special reference to the Hunshandake Sandy Land, eastern Inner Mongolia. Catena. 2007;71(1):2–12. [Google Scholar]
- 33.Ding Y, Wang Z, Sun Y. Inter-decadal variation of the summer precipitation in East China and its association with decreasing Asian summer monsoon. Part I: Observed evidences. Int J Climatol. 2008;28(9):1139–1161. [Google Scholar]
- 34.Santos GM, Southon JR, Griffin S, Beaupre SR, Druffel ERM. Ultra small-mass AMS 14C sample preparation and analyses at KCCAMS/UCI Facility. Nucl Instrum Meth B. 2007;259(1):293–302. [Google Scholar]
- 35.Zhou W, et al. New results on Xi’an-AMS and sample preparation systems at Xi'an-AMS center. Nucl Instrum Meth B. 2007;262(October 2006):135–142. [Google Scholar]
- 36.Stuvier M, Polach HA. Reporting of 14C Data. Radiocarbon. 1977;19(3):355–363. [Google Scholar]
- 37.Bronk RC. Radiocarbon calibration and analysis of stratigraphy: The OxCal program. Radiocarbon. 1995;37(2):425–430. [Google Scholar]
- 38.Bronk RC. Development of the radiocarbon program OxCal. Radiocarbon. 2001;43(2A):355–363. [Google Scholar]
- 39.Wang YJ, et al. A high-resolution absolute-dated late Pleistocene Monsoon record from Hulu Cave, China. Science. 2001;294(5550):2345–2348. doi: 10.1126/science.1064618. [DOI] [PubMed] [Google Scholar]
- 40.Prescott J, Hutton J. Cosmic ray contributions to dose rates for luminescence and ESR dating: Large depths and long-term time variations. Radiat Meas. 1994;23:497–500. [Google Scholar]
- 41.Fairbanks RG. A 17,000-year glacio-eustatic sea level record: Influence of glacial melting rates on the Younger Dryas event and deep-ocean circulation. Nature. 1989;342(6250):637–642. [Google Scholar]
- 42.Schrag DP, et al. The oxygen isotopic composition of seawater during the Last Glacial Maximum. Quat Sci Rev. 2002;21(1-3):331–342. [Google Scholar]
- 43.Kim S-T, O’Neil JR. Equilibrium and nonequilibrium oxygen isotope effects in synthetic carbonates. Geochim Cosmochim Acta. 1997;61(16):3461–3475. [Google Scholar]
- 44.Liu B. A spatial analysis of pan evaporation trends in China, 1955–2000. J Geophys Res. 2004;109(D15):D15102. [Google Scholar]
- 45.Linacre ET. Estimating U.S. class A pan evaporation from few climate data. Water Int. 1994;19(1):5–14. [Google Scholar]
- 46.Yang X, et al. Initiation and variation of the dune fields in semi-arid China - With a special reference to the Hunshandake Sandy Land, Inner Mongolia. Quat Sci Rev. 2013;78:369–380. [Google Scholar]
- 47.Yang X, et al. Late Quaternary environmental changes and organic carbon density in the Hunshandake Sandy Land, eastern Inner Mongolia, China. Glob Plan Change. 2008;61(1-2):70–78. [Google Scholar]
- 48.Zhang H, Tian M, Guo J, Yang J. The dynamic monitoring of Dalinur Lake in Inner Mongolia during 1999-2010 based on RS and GIS. J Arid L Resour Environ. 2012;26(10):41–46. [Google Scholar]


