

Significance
Plasmacytoid dendritic cells (pDCs) are specialized white blood cells responsible for a wide range of immune functions, most notably production of the antiviral factor, type I interferon. We have discovered a previously unknown population of pDCs in human blood, bone marrow, and tonsil that is morphologically, phenotypically, and genetically distinct from most pDCs. These cells, which can be identified based on their expression of CD2, CD5, and CD81 on their surface, fail to produce type I interferon, yet they strongly activate B and T lymphocytes. A functionally and phenotypically similar population of pDCs is present in mice. These pDCs likely play an important role in the immune response.
Keywords: plasmacytoid dendritic cells, CD2, CD81, CD5, type I IFN
Abstract
Plasmacytoid dendritic cells (pDCs) are known mainly for their secretion of type I IFN upon viral encounter. We describe a CD2hiCD5+CD81+ pDC subset, distinguished by prominent dendrites and a mature phenotype, in human blood, bone marrow, and tonsil, which can be generated from CD34+ progenitors. These CD2hiCD5+CD81+ cells express classical pDC markers, as well as the toll-like receptors that enable conventional pDCs to respond to viral infection. However, their gene expression profile is distinct, and they produce little or no type I IFN upon stimulation with CpG oligonucleotides, likely due to their diminished expression of IFN regulatory factor 7. A similar population of CD5+CD81+ pDCs is present in mice and also does not produce type I IFN after CpG stimulation. In contrast to conventional CD5−CD81− pDCs, human CD5+CD81+ pDCs are potent stimulators of B-cell activation and antibody production and strong inducers of T-cell proliferation and Treg formation. These findings reveal the presence of a discrete pDC population that does not produce type I IFN and yet mediates important immune functions previously attributed to all pDCs.
Plasmacytoid dendritic cells (pDCs) are a distinct lineage of bone-marrow–derived cells that reside mainly in blood and lymphoid organs in the steady state, but can also be found in sites of infection, inflammation, and cancer (1). As one of the two principal lineages of dendritic cells, pDCs diverge from conventional DCs (cDCs) during maturation in the bone marrow and are recognized mainly for their rapid and massive production of type I IFN (IFNα/β) in response to viral infection (2). Although generally viewed as weak antigen-presenting cells by comparison with cDCs, pDCs interact with many types of cells, such as NK cells, cDCs, T cells, and B cells through their secretion of cytokines and chemokines in addition to type I IFN, as well as through their expression of various costimulatory molecules (3, 4). Thus, pDCs are capable of activating CD4+ helper and regulatory T cells and CD8+ cytotoxic T cells (5–16). They can also stimulate B-cell activation, differentiation into plasma cells, and antibody production through mechanisms that are not yet completely understood (17–22).
Whether the diverse functions of pDCs are mediated by the same cells responding to different environmental cues or by distinct preprogrammed subsets or lineages is not clear, although several reports suggest the existence of phenotypically distinct subpopulations of pDCs in mice (23–25) and humans (26–30). Surface expression of CD2 divides human pDCs into two distinct subsets. Whereas both CD2lo and CD2hi pDCs produce type I IFN, the CD2hi subset secretes more IL12p40, triggers more T-cell proliferation (26), and is relatively resistant to apoptosis on the basis of higher BCL2 expression (28). Here we show that CD2hi pDCs contain a unique subpopulation that expresses CD5 and CD81. Unlike CD2hiCD5−CD81− pDCs, CD2hiCD5+CD81+ pDCs fail to produce type 1 IFN but release large quantities of other proinflammatory cytokines upon stimulation and are potent inducers of plasma cell formation and antibody secretion. Despite their relative rarity, the CD5+CD81+ pDCs can be found not only in peripheral blood mononuclear cells (PBMCs), but also in bone marrow, cord blood, and tonsil, and can be generated from CD34+ hematopoietic progenitor cells in vitro.
Results
CD5 and CD81 Distinguish Subsets of Human pDCs.
Peripheral blood pDCs were analyzed by flow cytometry for their expression of different tetraspanin proteins based on the previous finding that expression of the tetraspanin molecule CD9 distinguishes high and low IFNα-producing pDCs in mice (23). CD5 expression was also analyzed, as this molecule has been detected on a small fraction of human CD2hi pDCs (27, 28). PBMCs were first enriched for pDCs through magnetic negative selection and then stained for lineage (CD3, CD19, CD20, CD14, CD16, and CD56) and pDC surface markers. pDCs were gated as lineage−HLA-DR+BDCA4+CD123+CD11c− cells (Fig. 1A). Among the tetraspanins that we screened, CD81 was reproducibly expressed on 10–20% of CD2hi pDCs. CD5 was also expressed on a portion of the CD2hi pDCs, enabling CD2hi pDCs to be divided into CD5+CD81+ and CD5−CD81− subsets (Fig. 1A). Giemsa staining of the freshly sorted pDCs revealed strikingly different morphology of these two subsets. Whereas the CD2hiCD5−CD81− cells appear as larger lymphoid cells with a smooth surface, CD2hiCD5+CD81+ cells display multiple short dendrites extending from their surface as well as a larger irregularly shaped nucleus (Fig. 1B). The CD5+CD81+ pDCs express higher levels of CD86, CD80, and CD40 both at steady state and after CpG stimulation (Fig. 1 C and D). HLA-D related (HLA-DR) was also expressed at a higher level on CD5+CD81+ pDCs (Fig. S1). To determine whether the differences in costimulatory molecule expression might reflect a CpG dose or kinetic effect, we stimulated each population with 2 or 10 μg/mL CpG and analyzed these molecules after 12, 24, and 48 h. Although higher concentrations of CpG induced higher expression of CD86, CD80, and CD40 on both populations, at all CpG doses and culture periods tested, the CD5+CD81+ population expressed higher levels of costimulatory markers than the CD5−CD81− population (Fig. S2A).
Fig. 1.

CD5 and CD81 distinguish subsets of CD2hi pDCs. (A) Gating strategy for pDC subsets within CD2hi pDCs based on CD5 and CD81 expression. (B) Grunwald–Giemsa staining of freshly isolated pDC subsets. (C and D) Expression of costimulatory molecules on pDC subsets before and after CpG-A stimulation as indicated by flow cytometry histograms and median fluorescence intensity (MFI) (n = 3). (E) Expression of CD5 and CD81 on purified CD5−CD81− pDCs before and after CpG stimulation. Results shown are representative of three independent experiments. (F) Human bone marrow and cord blood mononuclear cells were stained for pDC surface markers as well as CD2, CD5, and CD81. The graphs show expression of CD5 and CD81 on gated CD2hi pDCs. (G) CD34+ hematopoietic progenitor cells (HPCs) were purified from PBMCs, and cultured in the presence of Flt3-L, TPO, and IL-3 for 21 d. CD11c and CD123 expression was used to gate on HPC-derived pDCs (CD123+CD11c−) and CD11c+ cells; CD2, CD5, and CD81 expression was further used to gate on the pDC subsets. *P < 0.05, **P < 0.01.
Fig. S1.

CD5+CD81+ pDCs express higher levels of HLA-DR than CD5−CD81− pDCs. Expression of HLA-DR on freshly sorted and CpG-activated pDC subsets was analyzed by flow cytometry.
Fig. S2.

Expression of surface molecules on pDCs following CpG stimulation. (A) Sorted pDC subsets were stimulated with 2 or 10 μg/mL CpG-C. Cells were harvested and analyzed at 12 h, 24 h, and 48 h by flow cytometry for expression of CD86, CD80, and CD40. (B) Expression of CD5 and CD81 was analyzed by flow cytometry on purified CD5+CD81+ pDCs before and 24 h after 7 μg/mL CpG-C stimulation.
The increased expression of costimulatory markers and HLA-DR on the CD5+CD81+ pDCs is consistent with a more mature phenotype. We assessed the possibility that CD5 and CD81 expression reflects an activation process by stimulating CD5−CD81− pDCs with CpG for 24 h, and then analyzing their expression of CD5 and CD81 (Fig. 1E). Although about 20% of the activated CD5−CD81− pDCs developed dim but detectable CD81 staining, expression of CD5 was not induced, suggesting that if the CD5+CD81+ pDCs developed from activated CD5−CD81− pDCs, factors in addition to those studied here were required. Conversely, expression of CD5 and CD81 by CD5+CD81+ pDCs was maintained after CpG stimulation (Fig. S2B), suggesting that they are relatively stable on these cells. Moreover, CD5+CD81+ pDCs were found in bone marrow, cord blood, and tonsil (Fig. 1F and Fig. S3), and in bone marrow or tonsil the percentage of these cells was comparable to that in blood.
Fig. S3.

CD2+CD5+CD81+ pDCs exist in normal human tonsil. Frozen human tonsil cells were thawed and stained for pDC markers as well as CD2, CD5, and CD81.
Although pDCs are rare compared with the other major immune cell types, large numbers of functional pDCs can be generated from human CD34+ hematopoietic progenitor cells (HPCs) (31). To determine whether CD5+CD81+ pDCs can be generated from HPCs, we incubated purified CD45+CD34+ cells with a combination of Flt3-ligand (Flt3L), IL-3, and thrombopoietin (TPO). After 3 wk, more than 44% of CD45+ cells had become CD11c−CD123+ pDCs. Although the percentage of CD2+ pDCs within HPC-derived pDCs was lower than regularly seen in blood, about 9% of these cells were CD5+CD81+, which is similar to their percentage in blood and bone marrow (Fig. 1G).
CD5+CD81+ pDCs Produce Little or No IFNα in Response to CpG Oligonucleotides.
Secretion of type I IFN, especially IFNα, is the hallmark of pDC function. To evaluate cytokine production by the pDC subsets, we stimulated FACS-sorted CD5−CD81− and CD5+CD81+ pDCs with CpG oligonucleotides, which are TLR9 agonists, or the TLR7/8 agonist R848, and measured their type I IFN secretion. Whereas the CD5−CD81− pDCs produced large amounts of IFNα, especially in response to CpG, the CD5+CD81+ pDCs secreted little or no IFNα (Fig. 2A). When we stimulated the different HPC-derived cell populations with CpG-A for 24 h, both total pDCs (CD11c−CD123+) and CD5−CD81− pDCs secreted IFNα, whereas CD5+CD81+ pDCs failed to produce any detectable IFNα (Fig. S4). Despite their failure to produce IFNα, CpG-stimulated CD5+CD81+ pDCs secreted increased amounts of inflammation-associated cytokines and chemokines, such as IL-12p40, IL-6, IL-8, etc., compared with CD5−CD81− pDCs (Fig. S5A).
Fig. 2.

CD5+CD81+ pDCs produce little or no IFNα. (A) CD2hi CD5+CD81+ and CD2hi CD5−CD81− pDCs were sorted and stimulated with CpG-A, CpG-C, or R848 for 24 h, and the supernatants were analyzed by ELISA for IFNα production. Results shown are representative of five independent experiments. (B) Flow cytometry analysis of expression of TLR9 in freshly isolated pDC subsets. Results are representative of three independent experiments. (C) mRNA expression of IRF7, TAK1, and IRF5 by purified pDC subsets based on qRT-PCR analysis. Results shown are representative of three independent experiments. *P < 0.05, **P < 0.01. ns, not significant.
Fig. S4.

CD5+CD81+ pDCs derived from CD34+ HPCs produce little IFNα. Four different cell populations were sorted from day 28 HPC-derived cells including CD11c+ cDCs, CD123+CD11c− pDCs, CD5+CD81+, and CD5−CD81− pDCs, and stimulated with CpG-A. After 24 h, supernatants were assayed for IFNα production by ELISA. *P < 0.05.
Fig. S5.

CD5+CD81+ pDCs show a distinct cytokine/chemokine profile. (A) The supernatants of CpG-C–stimulated pDC subsets were analyzed by Human 63-Plex Luminex. Shown are the fold differences between CD5+CD81+ and CD5−CD81− pDCs of all detectable cytokines and chemokines. (B) Cell lysate from purified CD81+ pDCs was analyzed by Western blot for expression of TLR7 and TLR9.
The failure of CD5+CD81+ pDCs to produce IFNα was not due to a lack of TLR7 or 9, because these molecules were clearly present by Western blot (Fig. S5B). Flow cytometric analysis also showed that the two pDC subsets expressed TLR9 at similar levels (Fig. 2B). Among the IFN regulatory factors (IRFs) that control pDC activation, IRF7 is critical for the induction of type I IFN transcription, whereas IRF5 and TAK1 are required for expression of costimulatory molecules and production of IL-6 and TNF. Quantitative RT-PCR (qRT-PCR) analysis revealed markedly lower expression of IRF7 but a higher expression of IRF5 mRNA in CD5+CD81+ pDCs than in CD5−CD81− pDCs (Fig. 2C).
CD5+CD81+ pDCs Are Efficient at Inducing Plasma Cell Differentiation and Antibody Production.
Previous studies have demonstrated that activated human blood pDCs can induce proliferation and differentiation of B cells (17, 21, 22). To examine the role of CD5+CD81+ and CD5−CD81− pDCs in B-cell activation, FACS purified pDC subpopulations were stimulated with CpG-B, and cocultured with purified carboxyfluorescein succinimidyl ester (CFSE)-labeled autologous B cells in the presence of IL-2, IL-10, and CD40-ligand (CD40L), which support B-cell growth and antibody production (21). For measurement of proliferation, B cells were collected after 5 d and analyzed for CFSE dilution. As expected, B cells cultured alone did not proliferate in the absence of CpG. The highest percentage of proliferating B cells (>70%) was observed when B cells were cultured with the CD5+CD81+ pDCs (Fig. 3A). In the presence of CD5+CD81+ pDCs, B cells also exhibited greater viability and expressed higher levels of activation markers, including CD25 and CD69 (Fig. S6). To determine whether plasma cells are induced in B-pDC cocultures, the cultured cells were harvested on day 10 and analyzed for the presence of cells with phenotype of plasma cells (CD19dim/−CD20−CD38hi). When B cells were cultured alone, only a small percentage became CD20−CD38+ (Fig. 3B). When cocultured with pDCs, more B cells differentiated into plasmablasts or plasma cells, and such differentiation was dramatically increased in cocultures containing CD5+CD81+ pDCs (Fig. 3 B and C).
Fig. 3.

CD5+CD81+ pDCs promote B-cell proliferation, plasma cell differentiation, and antibody production. pDC subsets were sorted and stimulated overnight with CpG-B. Activated pDCs were then washed to remove residual CpG-B and cocultured with CFSE-labeled autologous B cells. (A) After 5 d, proliferation of B cells cultured alone without or with CpG-B, or cocultured with pDC subsets, was analyzed by CFSE dilution using flow cytometry. (B) After 10 d, B cells from different culture groups were analyzed by flow cytometry for plasma cell (CD20−CD38hi) differentiation. The results shown are representative of eight independent experiments. (C) Mean percentage of plasma cells derived from B cells cultured alone (n = 4) or B-pDC cocultures (n = 8). (D) IgG and IgM in the supernatants were measured by ELISA after 12 d of B-pDC coculture in the absence or presence of IL-2, IL-10, and CD40L. The results shown are representative of five independent experiments. (E) Expression (MFI) of CD70 on CpG-activated pDC subsets (n = 5). (F) IgG and IgM production by B cells cocultured with preactivated CD5+CD81+ pDCs in the presence of anti-CD70 blocking antibody. Results shown are representative of three independent experiments. *P < 0.05, **P < 0.01, ****P < 0.0001.
Fig. S6.

B cells cocultured with CD5+CD81+ pDCs exhibit greater activation and viability than B cells cultured with CD5−CD81− pDCs. On day 5 of pDC/B-cell culture, CD19+ B cells were analyzed for their viability by DAPI staining and for their expression of CD25 and CD69.
We further found both IgG and IgM were present in the supernatants obtained from cocultures of B cells and CD5+CD81+ pDCs in the absence of exogenous cytokines, and the levels were higher than those seen in cocultures with CD5−CD81− pDCs (Fig. 3D). When cytokines were added to the cocultures, Ig production was further enhanced, and the difference in antibody production between cocultures with the two pDC subsets became even greater (Fig. 3D). Previous studies have shown that soluble factors, such as IFNα and IL-6, as well as direct pDC–B-cell contact mediated by CD70–CD27 interaction, play important roles in pDC-induced plasma cell differentiation and antibody production (17, 21). Despite the secretion of IL-6 by activated CD5+CD81+ pDCs, blocking IL-6 with a neutralizing antibody did not affect IgG production in the B-pDC cocultures (Fig. S7). To address the role of pDC–B-cell contact in Ig production induced by the CD5+CD81+ pDCs, pDCs and B cells were cultured on opposite sides of a Transwell membrane that permitted passage of soluble molecules but not cells. Under these conditions, IgG production was reduced (Fig. S8), suggesting that direct cell–cell contact is required for optimal plasma cell differentiation. Subsequently, we found that CD5+CD81+ pDCs express higher levels of CD70 after stimulation (Fig. 3E), and when blocking antibody against CD70 was added to B-pDC cocultures, secretion of IgG and IgM was almost completely abolished (Fig. 3F).
Fig. S7.
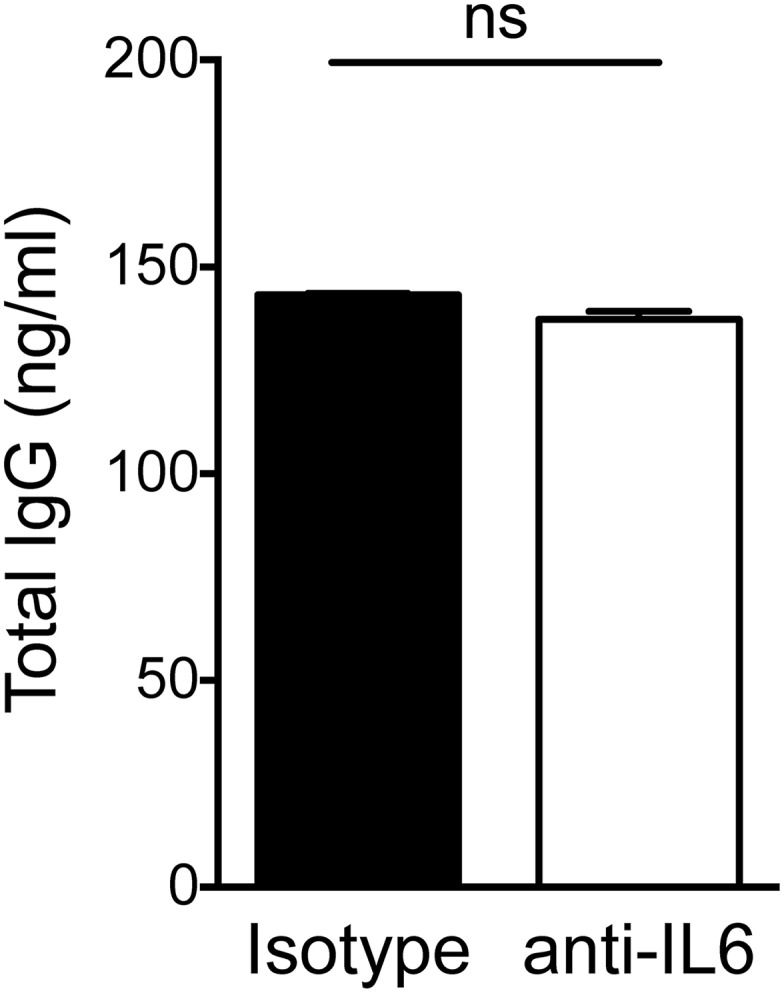
IL-6 blockade has no effect on IgG production by B cells in culture with CD5+CD81+ pDCs. B cells were cocultured with preactivated CD5+CD81+ pDCs in the presence of blocking anti-IL6 or isotype control antibody. Supernatants were collected at day 12 for IgG measurement by ELISA. ns, not significant.
Fig. S8.

Direct contact between B cells and CD5+CD81+ pDCs is required for optimal IgG production. For Transwell experiments, the CD5+CD81+ pDCs were cultured in the Lower compartment, and B cells were cultured in the Upper compartment in the presence of CD40L, IL-2, and IL-10. *P < 0.05.
CD5+CD81+ pDCs Trigger T-Cell Proliferation and Treg Differentiation.
In standard mixed lymphocyte reactions, CD2hi pDCs are more efficient than CD2lo pDCs in the induction of T-cell proliferation (26). However, little is known about the contribution of pDC subsets to the generation of particular types of T cells. We cocultured fresh pDC subsets with allogeneic CFSE-labeled CD4+ T cells and after 6 d, proliferation of T cells was assayed on the basis of CFSE dilution. As shown in Fig. 4 A and B, both pDC subsets induced T-cell proliferation in the absence of exogenous stimulation; the CD5+CD81+ pDCs were substantially more efficient, based on the higher percentage (∼50%) of cocultured T cells that proliferated. Interestingly, more CD25hiFoxp3+ Tregs arose in the CD5+CD81+ pDC-containing cultures (Fig. 4C). To directly study the ability of the pDC subsets to induce Treg formation, we replaced total CD4+ T cells with purified naïve CD4+ T cells and again found that CD5+CD81+ pDCs induced more Foxp3+ Tregs from naïve T cells than did CD5−CD81− pDCs (Fig. 4D, Upper Left, 3.61% vs. 1.42%). Although both pDC subsets became better inducers of Treg differentiation following preactivation with CpG, CD5+CD81+ pDCs remained more efficient than CD5−CD81− pDCs (Fig. 4D, Upper Right, 10.2% vs. 4.16%). Moreover, T cells cocultured with preactivated CD5+CD81+ pDC produced more IL-10 (Fig. 4D, Lower). To determine whether these pDC-induced Foxp3+ Tregs are suppressive, we sorted the CD4+CD25hi T cells from the CD5+CD81+ pDC/naïve T-cell cocultures and added them to the anti-CD3/CD28 stimulated effector T cells. Proliferation of effector T cells was greatly suppressed (from 56.3% to 8.62%), indicating the CD5+CD81+ pDC-induced Foxp3+ cells were functional Tregs (Fig. 4E).
Fig. 4.

CD5+CD81+ pDCs trigger T-cell proliferation and Treg generation. (A) Allogeneic total CD4+ T cells were labeled with CFSE and cultured alone or with fresh CD5−CD81− or CD5+CD81+ pDC subsets for 6 d. T-cell proliferation was analyzed by flow cytometry on the basis of CFSE dilution. One representative experiment is shown out of four independent experiments. (B) Average percentage of proliferated CD4+ T cells cocultured with pDC subsets (n = 4). (C) Expression of CD25 and Foxp3 on CD4+ T cells from the cultures shown in A. Results shown are representative of three independent experiments. (D) Freshly isolated or CpG-stimulated pDC subsets were cocultured with allogeneic naïve CD4+ T cells for 6 d. Percentage of CD25hiFoxp3+ T cells and IL-10 production by T cells derived from T-pDC cocultures were assessed by intracellular staining. Results shown are representative of three independent experiments. (E) CD4+CD25hi T cells derived from naïve CD4+ T cells after coculturing with CD5+CD81+ pDCs for 6 d were sorted, mixed with CFSE-labeled CD4+CD25−CD127+ effector T cells (Teff) at a 1:1 ratio, and cultured for 5 d in the presence of anti-CD3/CD28 beads. Dilution of CFSE in Teff was analyzed by flow cytometry. (F) Percentage of CD25+Foxp3+ T cells derived from CD4+ naïve T cells cocultured with different pDC subsets in the presence of anti-TGFβ blocking antibody. (G) Expression of IDO by fresh or activated pDC subsets, as determined by flow cytometry (n = 3). *P < 0.05.
Because TGFβ can induce Foxp3+ Treg differentiation in other settings (32), we investigated the potential role of this cytokine in CD5+CD81+ pDC-mediated Treg induction by adding a neutralizing anti-TGFβ antibody to the cocultures. This addition resulted in a reduction of Treg generation in the CD5+CD81+ cocultures from 12.0% to 7.3% (Fig. 4F). However, Treg induction by CD5−CD81− pDCs was similarly reduced (from 5.7% to 3.6%) in the presence of the antibody. Moreover, relatively little TGFβ was secreted by either pDC subset (Fig. S5A). Another factor known to contribute to adaptive Treg generation is indoleamine 2,3-dioxygenase (IDO) (33, 34). Intracellular staining of pDC subsets before and after CpG activation revealed that both pDC subsets produce IDO, especially after activation, with slightly more production by CD5+CD81+ pDCs (Fig. 4G). In combination, these results indicate that TGFβ and IDO contribute to Treg induction by both pDC subsets, but other not yet identified factors likely explain the superior Treg-inducing ability of CD5+CD81+ pDCs.
CD5+CD81+ pDCs Are Present in Mice and Produce Little IFNα.
To explore the possibility that a population of pDCs exists in mice that is similar to human CD5+CD81+ pDCs, we analyzed pDCs in the blood, spleen, and bone marrow of 6- to 8-wk-old healthy C57BL/6 mice. In contrast to human pDCs, mouse pDCs express B220 and PDCA-1, as well as low levels of CD11c (23, 24). After gating on cells with this phenotype, we examined their expression of CD5 and CD81. Although none of the pDCs expressed CD2 and there were too few pDCs in blood to analyze further, among spleen and bone marrow pDCs, 17% and 3%, respectively, were CD5+CD81+ (Fig. 5A, Upper). Similar frequencies of CD5+CD81+ pDCs were seen in spleen and bone marrow of age- and gender-matched germ-free B6 mice (Fig. 5A, Lower), suggesting that the development of these cells is not dependent on the microbiome. When the CD5+CD81+ and CD5−CD81− mouse pDCs were purified from spleen and stimulated with CpG, the CD5−CD81− pDCs produced IFNα, whereas the CD5+CD81+ pDCs did not (Fig. 5B). These results indicate that pDCs functionally and phenotypically similar to the CD5+CD81+ pDCs of humans are present in mice.
Fig. 5.

CD5+CD81+ pDCs are present in mice. (A) Expression of CD5 and CD81 was determined on mouse pDCs in spleen and bone marrow harvested from conventional (Upper) or germ-free (Lower) C57BL/6 mice. (B) Mouse pDC subsets were sorted from spleen and stimulated with CpG (ODN 2395) for 24 h, after which the supernatants were assayed for IFNα by ELISA. ****P < 0.0001.
CD5+CD81+ pDCs Display a Distinct Transcription Profile.
Whole genome microarray analysis of freshly sorted human CD5+CD81+ and CD5−CD81− pDC subsets was performed to further assess the extent to which these subsets diverge from one another. Although both subsets expressed similar amounts of the pDC-defining transcription factors, E2-2 (TCF4) and SPIB (Table S1), along with other classical pDC markers, they diverged significantly in their overall profile. Remarkably, 969 genes differed in their expression by more than twofold between the subsets (Fig. S9A). Among these genes, 276 were overexpressed by the CD5−CD81− pDCs and many were noncoding small nucleolar RNAs that had diverse cellular functions. There were 693 genes overexpressed by the CD5+CD81+ pDCs, and the top four genes were lysozyme (LYZ), annexin (ANXA1), coactosin-like F-actin binding protein 1 (COTL1), and AXL receptor tyrosine kinase (Fig. S9B). We further validated AXL protein expression by flow cytometry and found it was highly expressed by CD5+CD81+ pDCs, but not CD5−CD81− pDCs (Fig. S9C).
Table S1.
Top 10 genes that are overexpressed by CD5+CD81+ pDCs and genes that are used to define pDCs
| Gene | Expression intensity (log2) in CD5+CD81+ subset | Expression intensity (log2) in CD5−CD81− subset | Fold change (CD5+CD81+ vs. CD5−CD81−) |
| Top 10 genes overexpressed in CD5+CD81+ pDC subset | |||
| LYZ | 9.63 | 3.79 | 57.2 |
| ANXA1 | 8.5 | 3 | 45.3 |
| COTL1 | 9.56 | 5.57 | 15.9 |
| AXL | 8.59 | 4.83 | 13.5 |
| RPS2 | 12.1 | 8.58 | 11.4 |
| FCER1G | 9.11 | 5.72 | 10.5 |
| IFI30 | 8.48 | 5.14 | 10.1 |
| RPL21 | 8.13 | 4.9 | 9.4 |
| S100A10 | 7.73 | 4.55 | 9.0 |
| SH3BGRL3 | 9.32 | 6.2 | 8.6 |
| pDC-specific transcription factors | |||
| E2-2 (TCF4) | 9.61 | 9.42 | 1.1 |
| SPIB | 8.69 | 7.92 | 1.7 |
Fig. S9.

CD5+CD81+ pDCs exhibit a distinct transcriptional profile. (A) Whole genome gene expression of freshly isolated pDC subsets was analyzed by microarray. The heat map shows expression intensity (log2) of the 969 genes that are differentially expressed between the two pDC subsets by at least twofold (P < 0.05). (B) Top 4 genes overexpressed in CD5+CD81+ pDCs. (C) Confirmation of AXL expression on CD2hiCD5+CD81+ pDCs by flow cytometry (Left, histogram of representative sample; Right, bar graph showing median fluorescence intensity and SD of AXL staining, n = 3). **P < 0.01.
Discussion
These findings demonstrate that discrete subsets of human pDCs can be distinguished within the CD2hi pDC population based on their distinctive morphologies, differential expression of CD5 and CD81, and contrasting functions. Despite these differences, each pDC subset expresses classical pDC surface markers, pDC-defining transcription factors, and the TLRs that enable pDCs to respond to viral infection. Conversely, they lack expression of myeloid DC markers. A striking feature of CD5+CD81+ pDCs is that they produce little or no type I IFN upon stimulation with CpG oligonucleotides. IRF7 plays a central role in initiating type I IFN gene transcription in pDCs (35–40), and IRF8, through a feedback mechanism, further magnifies type I IFN production (41, 42). The CD5+CD81+ pDCs express substantially less IRF7 mRNA than CD5−CD81− pDCs, which might explain their diminished type I IFN production. In contrast, these pDCs express a higher level of IRF5, a signaling factor in pDCs that can induce transcription of proinflammatory cytokines, chemokines, and costimulatory molecules, as well as IFNα/β (43–46). This finding may explain their more abundant production of IL-6 and elevated expression of CD40, CD80, and CD86.
Previous studies have demonstrated that mature or activated pDCs, like cDCs, can process and present exogenous antigens in association with both MHC class I and class II molecules and therefore induce T-cell activation and proliferation (5–9). Activated pDCs can also induce the differentiation of naïve T cells into different types of helper T cells and Tregs (3, 10, 12–15). Coculture of the pDC subsets with naïve allogeneic CD4+ T cells demonstrated a superior ability of CD5+CD81+ pDCs to trigger T-cell proliferation, even in the absence of exogenous pDC stimuli. They also induced more Treg differentiation from naïve CD4+ T cells, suggesting that this pDC subset may play a role in mediating immune tolerance. However, given their abundant secretion of IL12p40, IL-6, and other proinflammatory cytokines, they may also have the potential to promote Th1 or Th17 differentiation or expansion under certain conditions.
Another distinctive attribute of CD5+CD81+ pDCs is their superior ability to activate B cells and induce plasma cell differentiation and antibody production. These properties have been well documented in total pDCs (17, 21, 22, 47, 48). Although both soluble factors and cell–cell contact have been reported to be involved in such pDC–B-cell interaction, there is disagreement with regard to the relative importance of these elements (17, 21, 22). Type I IFN and IL-6 produced by human and mouse pDCs were reported to be important in the generation of plasmablasts and antibody production (17, 22). However, a more recent study showed that induction of B-cell proliferation and Ig secretion by CpG-activated human pDCs is not dependent on type I IFN but relies instead on cell–cell contact through CD70–CD27 interaction (21). Because CD5+CD81+ pDCs do not produce type I IFN under the conditions studied here, B-cell activation by these cells is clearly independent of this cytokine. By contrast, the cell surface molecule CD70 plays a critical role in the B-cell activation and maturation induced by CD5+CD81+ pDCs, as indicated by the observation that blockade of CD70 with an anti-CD70 antibody dramatically reduced pDC-induced Ig production. CD5 and/or CD81 may contribute to the functions of these pDCs, but due to their broad expression on B and T cells, we did not attempt to investigate this possibility.
An interesting question is whether CD5+CD81+ pDCs represent a separate pDC lineage or derive from other pDCs as a consequence of cellular activation. Their prominent dendrites and higher expression of HLA-DR and costimulatory molecules are suggestive of a more mature population that has undergone activation in vivo. Stimulation of CD5−CD81− pDCs with CpG oligonucleotides in vitro did not result in the appearance of CD5+CD81+ cells, but the possibility remains that factors different from those studied here could have led to their formation from preexisting pDCs in vivo. Given these considerations, we were surprised to find that phenotypically and functionally identical pDCs are present in human bone marrow and cord blood, and that such cells could be generated from whole blood CD34+ HPCs. The latter finding suggests that CD5−CD81− pDCs may arise at an early stage of development in parallel with other pDCs. Additionally, the distinct gene expression profile of the CD5+CD81+ cells supports the view that they may represent a developmentally distinct pDC population. Moreover, a phenotypically and functionally similar population of pDCs is present in mice. Regardless of their origins, the fact that CD5+CD81+ pDCs are present in similar frequency in the steady state in most healthy humans suggests that they may play an important role in maintaining immune homeostasis. In addition, our findings indicate that selected immune functions previously ascribed to all pDCs are mainly performed by this rare subset and do not rely on type I IFN.
Materials and Methods
Human PBMCs, as the major source of circulating pDCs, were isolated from buffy coats obtained from healthy adult blood donors at the Stanford Blood Center. Human cord blood and bone marrow samples were purchased from AllCells. Human tonsil cells were obtained from the Stanford Tissue Bank. Human subjects protocols were approved by Stanford’s Institutional Review Board (Palo Alto, CA) (IRB protocols 11977 and 13942), and all blood and tissue donors provided informed consent. Mouse experiments were approved and conducted in accordance with Stanford University Institutional Animal Care and Use Committee (protocol 13605). The details of the materials and methods are shown in SI Materials and Methods.
SI Materials and Methods
Isolation of Human Cells.
A pDC-enriched population was isolated from PBMCs by negative selection using the EasySep Human Plasmacytoid DC Enrichment kit (Stemcell Technologies). pDC subsets were further sorted using a lineage mixture (CD3, CD14, CD16, CD19, CD20, and CD56), and antibodies to HLA-DR, CD11c, BDCA-4 (Miltenyi Biotec), CD123, CD2, CD5, and CD81 (BioLegend). B cells were directly sorted from PBMCs using CD19. Total CD4+ T cells or naïve CD4+ T cells were purified by negative selection using EasySep Enrichment kits. Unless otherwise indicated, all antibodies were purchased from BD Biosciences. All cell sorting was done at the Flow Cytometry Lab of the Stanford Blood Center with a FACSAria II cell sorter (BD Biosciences).
Cell Cultures.
pDCs were cultured in 96-well round-bottom plates with RPMI medium 1640 containing 10% (vol/vol) FBS, 2 mM l-glutamine, 100 units/mL penicillin and streptomycin, 1 mM sodium pyruvate, and 10 mM Hepes. For cytokine production, pDCs were stimulated with 10 μg/mL class A CpG (ODN 2216, InvivoGen) or 1 μM class C CpG (ODN 2395, InvivoGen) or 10 μg /mL R848 (InvivoGen). For pDC/B-cell coculture, sorted pDCs were stimulated with 1 μM class B CpG (ODN 2006, InvivoGen) for 24 h and washed three times to remove residual CpG before use in subsequent culture. Preactivated pDCs (1 × 10⁴) were cultured with autologous B cells (2 × 10⁴) for up to 12 d with or without 50 units/mL of IL-2, 10 ng/mL of IL-10, and 100 ng/mL of CD40L. For pDC/T-cell coculture, fresh or class A CpG-stimulated pDCs (1 × 10⁴) were cultured with allogeneic CD4+ T cells or naïve T cells (5 × 10⁴) for 6 d in the presence of 20 units/mL of IL-2.
Measurement of Cytokines and Immunoglobulins.
For cytokine measurement, sorted pDC subsets were stimulated with CpGs or R848 for 24 h. The supernatants were then analyzed with ELISA kits for IFNα (PBL Assay Science) or by 63-Plex Luminex assay custom-built by eBioscience and performed by the Human Immune Monitoring Center at Stanford University. For analysis of Ig secretion, supernatants of pDC/B-cell cocultures were harvested at day 12 and IgG and IgM levels in the supernatant were determined by ELISA (Bethyl Laboratories). In some experiments, blocking antibody against CD70 or neutralizing antibody against TGFβ or isotype mouse IgG (10 μg/mL, BioLegend) was used to test the effect of CD70 on antibody production and the effect of TGFβ on Treg differentiation induced by pDCs.
Fluorescence Microscopy and Flow Cytometry.
For assessment of morphology, freshly sorted pDCs were cytospun onto glass slides and stained with May–Grunwald–Giemsa. Images were acquired using a Zeiss 700 confocal laser-scanning microscope. For cell surface staining, fluorochrome-conjugated monoclonal antibodies against human CD40, CD80, CD86, HLA-DR, CD20, CD38, CD25, CD69, CD70, CD19, CD3, CD4 (BioLegend), and AXL (R&D Systems) were used. Cells were incubated for 20 min with antibodies in FACS buffer [PBS with 2% (vol/vol) FBS] at 4 °C and then washed thoroughly with FACS buffer. For intracellular staining, fluorochrome-conjugated monoclonal antibodies against human TLR9 (BD Biosciences), Foxp3 (eBioscience), and IDO (R&D Systems) were used. For TLR9 and IDO staining, cells were fixed and permeabilized for 20 min at 4 °C using BD Cytofix/Cytoperm. For Foxp3 staining, cells were first stained for surface markers and then fixed and permeabilized using eBioscience Foxp3 staining buffer set. Flow cytometry was performed on a LSRII (BD Biosciences) and datasets were analyzed using FlowJo software (Tree Star).
qPCR.
RNA was extracted from sorted pDCs using an RNeasy Micro Kit (Qiagen) and converted into cDNA with a High-Capacity cDNA Reverse Transcription Kit (Applied Biosystems). qPCR reactions were run using TaqMan chemistry on a QuantStudio 6 Flex machine (Applied Biosystems). All PCR primers and TaqMan probes were purchased from Applied Biosystems. Expression of target genes was normalized to the housekeeping genes beta-glucuronidase (GUSB) and glyceraldehyde-3-phosphate dehydrogenase (GAPDH).
Generation of pDCs from Hematopoietic Progenitors.
CD34+ hematopoietic progenitor cells were isolated from whole blood using the RosetteSep Human Hematopoietic Progenitor Cell Enrichment Mixture and the EasySep Human CD34 Positive Selection Mixture (Stemcell Technologies). CD34+ cells were cultured in 24-well plates at 2 × 10⁵ cells/mL in RPMI-1640 medium supplemented with 10% (vol/vol) FBS, 50 mM beta-mercaptoethanol, and 1% penicillin–streptomycin, sodium pyruvate, and nonessential amino acids. To induce pDC differentiation, TPO (50 ng/mL), Flt3L (100 ng/mL), and recombinant human IL-3 (20 ng/mL) were added to the medium. All cytokines were purchased from Peprotech. Cell cultures were refreshed every 3 d. For IFNα production, the pDCs or CD11c+ cells were stimulated with 10 μg/mL CpG-A for 24 h.
Microarray.
Total RNA was extracted from fresh CD2hiCD5+CD81+ and CD2hiCD5−CD81− pDC subsets that were FACS purified from three different normal donors. The RNA samples were sent to Q2 Solutions for whole genome gene expression analysis on Affymetrix GeneChip Human Gene 2.0 ST Array. Gene expression was analyzed with Transcriptome Analysis Console software (Affymetrix) and R program. Transcripts were ranked based on fold change in expression, P values, and absolute difference in expression between the two subsets.
Analysis of Mouse pDCs.
The 6- to 8-wk-old male wild-type C57BL/6 mice were purchased from The Jackson Laboratory. Age- and gender-matched germ-free C57BL/6 mice were purchased from Taconic. All tissue preparations were performed simultaneously from each individual mouse. After killing by CO2 inhalation, peripheral blood was collected via the posterior vena cava before perfusion and transferred into sodium heparin-coated vacuum tubes at a 1:1 dilution in RPMI-1640. Spleens were homogenized in PBS at 4 °C. Bone marrow was flushed from femuri and resuspended in PBS at 4 °C. Mouse pDCs were analyzed and/or sorted by using the monoclonal antibodies anti-mouse TCRβ, CD19, CD11c, B220, PDCA-1, CD2, CD5, and CD81 (BioLegend). A total of 1 μM class C CpG (ODN 2395, InvivoGen) was used to stimulate purified mouse pDCs, and the supernatant was analyzed by ELISA for mouse IFNα (PBL Assay Science).
Statistical Analysis.
Statistical analyses were performed with Prism software (GraphPad) by unpaired t test. A P value of ≤0.05 was considered significant.
Acknowledgments
We thank Nancy Wu for excellent technical assistance in flow cytometry cell sorting. This work was supported in part by National Institutes of Health Grant 5RO1AI118884.
Footnotes
The authors declare no conflict of interest.
This article is a PNAS Direct Submission.
This article contains supporting information online at www.pnas.org/lookup/suppl/doi:10.1073/pnas.1610630114/-/DCSupplemental.
References
- 1.Swiecki M, Colonna M. The multifaceted biology of plasmacytoid dendritic cells. Nat Rev Immunol. 2015;15(8):471–485. doi: 10.1038/nri3865. [DOI] [PMC free article] [PubMed] [Google Scholar]
- 2.Liu YJ. IPC: Professional type 1 interferon-producing cells and plasmacytoid dendritic cell precursors. Annu Rev Immunol. 2005;23:275–306. doi: 10.1146/annurev.immunol.23.021704.115633. [DOI] [PubMed] [Google Scholar]
- 3.Mathan TS, Figdor CG, Buschow SI. Human plasmacytoid dendritic cells: From molecules to intercellular communication network. Front Immunol. 2013;4:372. doi: 10.3389/fimmu.2013.00372. [DOI] [PMC free article] [PubMed] [Google Scholar]
- 4.Karrich JJ, Jachimowski LC, Uittenbogaart CH, Blom B. The plasmacytoid dendritic cell as the Swiss army knife of the immune system: Molecular regulation of its multifaceted functions. J Immunol. 2014;193(12):5772–5778. doi: 10.4049/jimmunol.1401541. [DOI] [PMC free article] [PubMed] [Google Scholar]
- 5.Tel J, et al. Human plasmacytoid dendritic cells efficiently cross-present exogenous Ags to CD8+ T cells despite lower Ag uptake than myeloid dendritic cell subsets. Blood. 2013;121(3):459–467. doi: 10.1182/blood-2012-06-435644. [DOI] [PubMed] [Google Scholar]
- 6.Lui G, et al. Plasmacytoid dendritic cells capture and cross-present viral antigens from influenza-virus exposed cells. PLoS One. 2009;4(9):e7111. doi: 10.1371/journal.pone.0007111. [DOI] [PMC free article] [PubMed] [Google Scholar]
- 7.Guillerme JB, et al. Measles virus vaccine-infected tumor cells induce tumor antigen cross-presentation by human plasmacytoid dendritic cells. Clin Cancer Res. 2013;19(5):1147–1158. doi: 10.1158/1078-0432.CCR-12-2733. [DOI] [PubMed] [Google Scholar]
- 8.Tel J, et al. Human plasmacytoid dendritic cells phagocytose, process, and present exogenous particulate antigen. J Immunol. 2010;184(8):4276–4283. doi: 10.4049/jimmunol.0903286. [DOI] [PubMed] [Google Scholar]
- 9.Di Pucchio T, et al. Direct proteasome-independent cross-presentation of viral antigen by plasmacytoid dendritic cells on major histocompatibility complex class I. Nat Immunol. 2008;9(5):551–557. doi: 10.1038/ni.1602. [DOI] [PMC free article] [PubMed] [Google Scholar]
- 10.Fonteneau JF, et al. Activation of influenza virus-specific CD4+ and CD8+ T cells: A new role for plasmacytoid dendritic cells in adaptive immunity. Blood. 2003;101(9):3520–3526. doi: 10.1182/blood-2002-10-3063. [DOI] [PubMed] [Google Scholar]
- 11.Kuwana M, Kaburaki J, Wright TM, Kawakami Y, Ikeda Y. Induction of antigen-specific human CD4(+) T cell anergy by peripheral blood DC2 precursors. Eur J Immunol. 2001;31(9):2547–2557. doi: 10.1002/1521-4141(200109)31:9<2547::aid-immu2547>3.0.co;2-j. [DOI] [PubMed] [Google Scholar]
- 12.Grouard G, et al. The enigmatic plasmacytoid T cells develop into dendritic cells with interleukin (IL)-3 and CD40-ligand. J Exp Med. 1997;185(6):1101–1111. doi: 10.1084/jem.185.6.1101. [DOI] [PMC free article] [PubMed] [Google Scholar]
- 13.Kadowaki N, Antonenko S, Lau JY, Liu YJ. Natural interferon alpha/beta-producing cells link innate and adaptive immunity. J Exp Med. 2000;192(2):219–226. doi: 10.1084/jem.192.2.219. [DOI] [PMC free article] [PubMed] [Google Scholar]
- 14.Ito T, et al. Plasmacytoid dendritic cells prime IL-10-producing T regulatory cells by inducible costimulator ligand. J Exp Med. 2007;204(1):105–115. doi: 10.1084/jem.20061660. [DOI] [PMC free article] [PubMed] [Google Scholar]
- 15.Ogata M, et al. Plasmacytoid dendritic cells have a cytokine-producing capacity to enhance ICOS ligand-mediated IL-10 production during T-cell priming. Int Immunol. 2013;25(3):171–182. doi: 10.1093/intimm/dxs103. [DOI] [PubMed] [Google Scholar]
- 16.Conrad C, et al. Plasmacytoid dendritic cells promote immunosuppression in ovarian cancer via ICOS costimulation of Foxp3(+) T-regulatory cells. Cancer Res. 2012;72(20):5240–5249. doi: 10.1158/0008-5472.CAN-12-2271. [DOI] [PMC free article] [PubMed] [Google Scholar]
- 17.Jego G, et al. Plasmacytoid dendritic cells induce plasma cell differentiation through type I interferon and interleukin 6. Immunity. 2003;19(2):225–234. doi: 10.1016/s1074-7613(03)00208-5. [DOI] [PubMed] [Google Scholar]
- 18.García-Marquez M, Shimabukuro-Vornhagen A, von Bergwelt-Baildon M. Complex interactions between B cells and dendritic cells. Blood. 2013;121(12):2367–2368. doi: 10.1182/blood-2012-12-468017. [DOI] [PubMed] [Google Scholar]
- 19.Bekeredjian-Ding IB, et al. Plasmacytoid dendritic cells control TLR7 sensitivity of naive B cells via type I IFN. J Immunol. 2005;174(7):4043–4050. doi: 10.4049/jimmunol.174.7.4043. [DOI] [PubMed] [Google Scholar]
- 20.Braun D, Caramalho I, Demengeot J. IFN-alpha/beta enhances BCR-dependent B cell responses. Int Immunol. 2002;14(4):411–419. doi: 10.1093/intimm/14.4.411. [DOI] [PubMed] [Google Scholar]
- 21.Shaw J, Wang YH, Ito T, Arima K, Liu YJ. Plasmacytoid dendritic cells regulate B-cell growth and differentiation via CD70. Blood. 2010;115(15):3051–3057. doi: 10.1182/blood-2009-08-239145. [DOI] [PMC free article] [PubMed] [Google Scholar]
- 22.Ding C, Cai Y, Marroquin J, Ildstad ST, Yan J. Plasmacytoid dendritic cells regulate autoreactive B cell activation via soluble factors and in a cell-to-cell contact manner. J Immunol. 2009;183(11):7140–7149. doi: 10.4049/jimmunol.0901175. [DOI] [PMC free article] [PubMed] [Google Scholar]
- 23.Björck P, Leong HX, Engleman EG. Plasmacytoid dendritic cell dichotomy: Identification of IFN-α producing cells as a phenotypically and functionally distinct subset. J Immunol. 2011;186(3):1477–1485. doi: 10.4049/jimmunol.1000454. [DOI] [PMC free article] [PubMed] [Google Scholar]
- 24.Hadeiba H, et al. Plasmacytoid dendritic cells transport peripheral antigens to the thymus to promote central tolerance. Immunity. 2012;36(3):438–450. doi: 10.1016/j.immuni.2012.01.017. [DOI] [PMC free article] [PubMed] [Google Scholar]
- 25.Hadeiba H, et al. CCR9 expression defines tolerogenic plasmacytoid dendritic cells able to suppress acute graft-versus-host disease. Nat Immunol. 2008;9(11):1253–1260. doi: 10.1038/ni.1658. [DOI] [PMC free article] [PubMed] [Google Scholar]
- 26.Matsui T, et al. CD2 distinguishes two subsets of human plasmacytoid dendritic cells with distinct phenotype and functions. J Immunol. 2009;182(11):6815–6823. doi: 10.4049/jimmunol.0802008. [DOI] [PMC free article] [PubMed] [Google Scholar]
- 27.Zhang X, et al. Neonatal plasmacytoid dendritic cells (pDCs) display subset variation but can elicit potent anti-viral innate responses. PLoS One. 2013;8(1):e52003. doi: 10.1371/journal.pone.0052003. [DOI] [PMC free article] [PubMed] [Google Scholar]
- 28.Bryant C, et al. A CD2 high-expressing stress-resistant human plasmacytoid dendritic-cell subset. Immunol Cell Biol. 2016;94(5):447–457. doi: 10.1038/icb.2015.116. [DOI] [PubMed] [Google Scholar]
- 29.Cella M, et al. Plasmacytoid monocytes migrate to inflamed lymph nodes and produce large amounts of type I interferon. Nat Med. 1999;5(8):919–923. doi: 10.1038/11360. [DOI] [PubMed] [Google Scholar]
- 30.Comeau MR, Van der Vuurst de Vries AR, Maliszewski CR, Galibert L. CD123bright plasmacytoid predendritic cells: Progenitors undergoing cell fate conversion? J Immunol. 2002;169(1):75–83. doi: 10.4049/jimmunol.169.1.75. [DOI] [PubMed] [Google Scholar]
- 31.Demoulin S, Roncarati P, Delvenne P, Hubert P. Production of large numbers of plasmacytoid dendritic cells with functional activities from CD34(+) hematopoietic progenitor cells: Use of interleukin-3. Exp Hematol. 2012;40(4):268–278. doi: 10.1016/j.exphem.2012.01.002. [DOI] [PubMed] [Google Scholar]
- 32.Chen W, et al. Conversion of peripheral CD4+CD25- naive T cells to CD4+CD25+ regulatory T cells by TGF-beta induction of transcription factor Foxp3. J Exp Med. 2003;198(12):1875–1886. doi: 10.1084/jem.20030152. [DOI] [PMC free article] [PubMed] [Google Scholar]
- 33.Munn DH, et al. Expression of indoleamine 2,3-dioxygenase by plasmacytoid dendritic cells in tumor-draining lymph nodes. J Clin Invest. 2004;114(2):280–290. doi: 10.1172/JCI21583. [DOI] [PMC free article] [PubMed] [Google Scholar]
- 34.Chen W, Liang X, Peterson AJ, Munn DH, Blazar BR. The indoleamine 2,3-dioxygenase pathway is essential for human plasmacytoid dendritic cell-induced adaptive T regulatory cell generation. J Immunol. 2008;181(8):5396–5404. doi: 10.4049/jimmunol.181.8.5396. [DOI] [PMC free article] [PubMed] [Google Scholar]
- 35.Matsui K, et al. Cutting edge: Role of TANK-binding kinase 1 and inducible IkappaB kinase in IFN responses against viruses in innate immune cells. J Immunol. 2006;177(9):5785–5789. doi: 10.4049/jimmunol.177.9.5785. [DOI] [PubMed] [Google Scholar]
- 36.Honda K, et al. Role of a transductional-transcriptional processor complex involving MyD88 and IRF-7 in Toll-like receptor signaling. Proc Natl Acad Sci USA. 2004;101(43):15416–15421. doi: 10.1073/pnas.0406933101. [DOI] [PMC free article] [PubMed] [Google Scholar]
- 37.Kawai T, et al. Interferon-alpha induction through Toll-like receptors involves a direct interaction of IRF7 with MyD88 and TRAF6. Nat Immunol. 2004;5(10):1061–1068. doi: 10.1038/ni1118. [DOI] [PubMed] [Google Scholar]
- 38.Uematsu S, et al. Interleukin-1 receptor-associated kinase-1 plays an essential role for Toll-like receptor (TLR)7- and TLR9-mediated interferon-alpha induction. J Exp Med. 2005;201(6):915–923. doi: 10.1084/jem.20042372. [DOI] [PMC free article] [PubMed] [Google Scholar]
- 39.Hoshino K, et al. IkappaB kinase-alpha is critical for interferon-alpha production induced by Toll-like receptors 7 and 9. Nature. 2006;440(7086):949–953. doi: 10.1038/nature04641. [DOI] [PubMed] [Google Scholar]
- 40.Guiducci C, et al. PI3K is critical for the nuclear translocation of IRF-7 and type I IFN production by human plasmacytoid predendritic cells in response to TLR activation. J Exp Med. 2008;205(2):315–322. doi: 10.1084/jem.20070763. [DOI] [PMC free article] [PubMed] [Google Scholar]
- 41.Tailor P, et al. The feedback phase of type I interferon induction in dendritic cells requires interferon regulatory factor 8. Immunity. 2007;27(2):228–239. doi: 10.1016/j.immuni.2007.06.009. [DOI] [PMC free article] [PubMed] [Google Scholar]
- 42.Tsujimura H, Tamura T, Ozato K. Cutting edge: IFN consensus sequence binding protein/IFN regulatory factor 8 drives the development of type I IFN-producing plasmacytoid dendritic cells. J Immunol. 2003;170(3):1131–1135. doi: 10.4049/jimmunol.170.3.1131. [DOI] [PubMed] [Google Scholar]
- 43.Osawa Y, et al. Collaborative action of NF-kappaB and p38 MAPK is involved in CpG DNA-induced IFN-alpha and chemokine production in human plasmacytoid dendritic cells. J Immunol. 2006;177(7):4841–4852. doi: 10.4049/jimmunol.177.7.4841. [DOI] [PubMed] [Google Scholar]
- 44.Yanai H, et al. Role of IFN regulatory factor 5 transcription factor in antiviral immunity and tumor suppression. Proc Natl Acad Sci USA. 2007;104(9):3402–3407. doi: 10.1073/pnas.0611559104. [DOI] [PMC free article] [PubMed] [Google Scholar]
- 45.Yasuda K, et al. Murine dendritic cell type I IFN production induced by human IgG-RNA immune complexes is IFN regulatory factor (IRF)5 and IRF7 dependent and is required for IL-6 production. J Immunol. 2007;178(11):6876–6885. doi: 10.4049/jimmunol.178.11.6876. [DOI] [PubMed] [Google Scholar]
- 46.Takaoka A, et al. Integral role of IRF-5 in the gene induction programme activated by Toll-like receptors. Nature. 2005;434(7030):243–249. doi: 10.1038/nature03308. [DOI] [PubMed] [Google Scholar]
- 47.Poeck H, et al. Plasmacytoid dendritic cells, antigen, and CpG-C license human B cells for plasma cell differentiation and immunoglobulin production in the absence of T-cell help. Blood. 2004;103(8):3058–3064. doi: 10.1182/blood-2003-08-2972. [DOI] [PubMed] [Google Scholar]
- 48.Douagi I, et al. Human B cell responses to TLR ligands are differentially modulated by myeloid and plasmacytoid dendritic cells. J Immunol. 2009;182(4):1991–2001. doi: 10.4049/jimmunol.0802257. [DOI] [PubMed] [Google Scholar]