Significance
Intrinsically disordered regions (IDRs) are widespread, have diverse functions, and are involved in human disease. Because standard sequence analysis methods identify little sequence homology in IDRs, it is not currently understood whether (or how) the functions of these protein regions are preserved over evolution. Here we show that orthologous IDRs can preserve regulatory functions despite near-complete sequence divergence. This suggests that natural selection maintains aggregate molecular properties in IDRs, which we propose to be quantitative traits. Consistent with this, we find signatures of stabilizing selection on the electrostatic properties of IDRs. Thus, in analogy to the rapid evolution of noncoding DNA in eukaryotic enhancers, divergence in primary amino acid sequence does not imply functional divergence in IDRs.
Keywords: evolution, intrinsically disordered, quantitative trait, phylogenetic comparative method, stabilizing selection
Abstract
Intrinsically disordered regions (IDRs) are characterized by their lack of stable secondary or tertiary structure and comprise a large part of the eukaryotic proteome. Although these regions play a variety of signaling and regulatory roles, they appear to be rapidly evolving at the primary sequence level. To understand the functional implications of this rapid evolution, we focused on a highly diverged IDR in Saccharomyces cerevisiae that is involved in regulating multiple conserved MAPK pathways. We hypothesized that under stabilizing selection, the functional output of orthologous IDRs could be maintained, such that diverse genotypes could lead to similar function and fitness. Consistent with the stabilizing selection hypothesis, we find that diverged, orthologous IDRs can mostly recapitulate wild-type function and fitness in S. cerevisiae. We also find that the electrostatic charge of the IDR is correlated with signaling output and, using phylogenetic comparative methods, find evidence for selection maintaining this quantitative molecular trait despite underlying genotypic divergence.
Current predictions suggest that close to 40% of all proteins in eukaryotic organisms are either entirely disordered or contain sizeable regions that are disordered, meaning they do not autonomously fold into defined secondary or tertiary structures (1, 2). These intrinsically disordered regions (IDRs) are thought to have important implications for protein function (3, 4) and are known to play regulatory roles, often through short linear motifs (SLiMs) that control protein–protein interactions, localization, degradation, and posttranslational modifications (5, 6). Although proteome-wide studies have provided in silico evidence for conservation of length (7) and composition (8) in some IDRs, reports of increased rates of insertions and deletions (9–13) and amino acid substitutions (14) in IDRs are indicative of their rapid evolution compared with ordered regions. In addition, although some SLiMs are indeed conserved in IDRs (15–17), others appear in clusters where precise position and number are not conserved (18–20). Although it is reasonable to assume that conservation of sequence in IDRs is indicative of functional conservation of SLiMs, it is more difficult to interpret the functional consequences of IDRs that are highly diverged at the sequence level: These may represent either nonfunctional sequences evolving in the absence of constraint or weakly constrained functional elements that are gained or lost in a compensatory manner [undergoing evolutionary turnover (as described in refs. 18, 21)], such that they are not conserved at the amino acid sequence level.
Like IDRs, noncoding DNA often shows relatively rapid evolution and weak constraints at the sequence level (22). Interestingly, IDRs show other parallels with noncoding DNA (18, 23, 24). For example, nonconserved clusters of phosphorylation sites in IDRs are reminiscent of nonconserved transcription factor binding sites in enhancers. Although these enhancers and the binding sites within them are not conserved, they can lead to the same expression patterns (25). Preservation of expression patterns despite underlying sequence divergence in these regions is thought to result from stabilizing selection on quantitative phenotypes (21). Stabilizing selection could allow for quantitative phenotypes to be maintained within an optimal range while allowing tolerance of mutations or insertions and deletions, as these individually exert weak functional and selective effects (21, 26). Although it is likely that some of these highly diverged IDRs, like noncoding regions, are either nonfunctional or sites of lineage-specific evolution (27), at least a portion of these IDRs may be performing quantitative functions that are under stabilizing selection (28).
In this study, we investigate whether the observed molecular divergence in IDRs implies functional divergence or whether the diversity in these regions could accumulate while functional output is preserved under stabilizing selection. Under stabilizing selection, we expect that diverged, orthologous IDRs have similar functional outputs and confer similar fitness. To test this, we take advantage of a model IDR that plays roles in multiple signaling pathways in Saccharomyces cerevisiae. We show that orthologous disordered regions can recapitulate wild-type morphology and quantitative regulatory function. This represents in vivo evidence that disordered signaling protein regions that are highly divergent at the primary sequence level can perform similar functions and confer similar fitness. We also find that the basal net charge of the IDRs is correlated with the signaling output and, by applying phylogenetic comparative methods to the basal net charge in these IDRs, find evidence for selection on this quantitative molecular trait.
Results
An IDR in the Adaptor Protein Ste50 That Is Involved in Multiple Signaling Pathways Is Highly Diverged at the Primary Amino Acid Sequence Level.
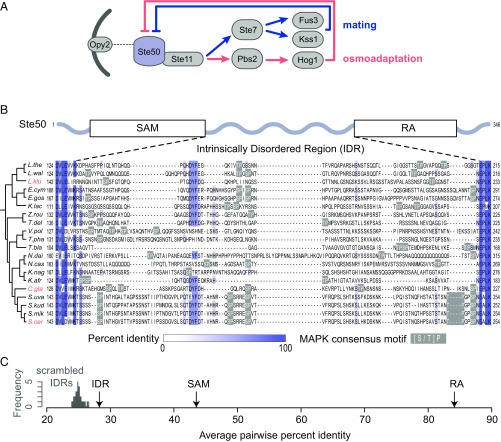
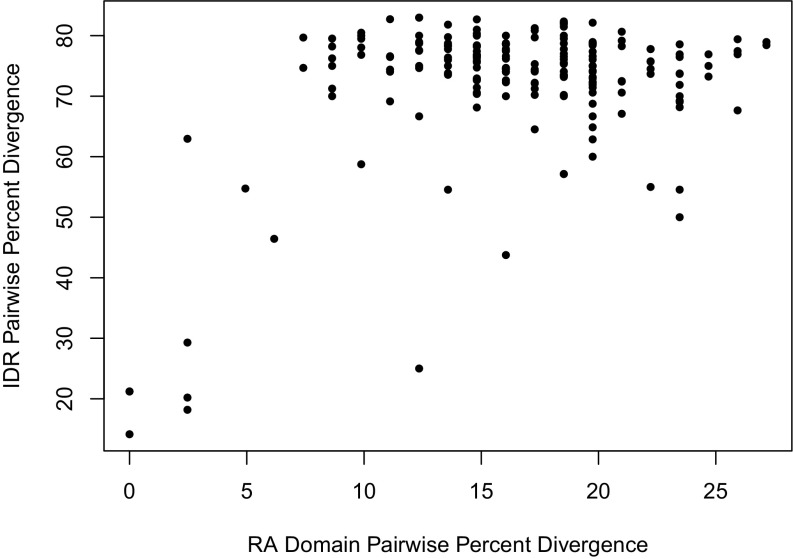
We chose to focus our study on an IDR in the adaptor protein Ste50 that is involved in several highly studied MAPK signaling pathways in S. cerevisiae (Fig. 1A). We chose this IDR in part because it is situated between two highly conserved protein domains: the Sterile Alpha Motif (SAM) and the Ras association (RA) domain (29–31) (Fig. 1B). We can therefore confidently identify the orthologous protein sequence in other hemiascomycete species, even though the primary amino acid sequence has diverged rapidly (Fig. 1B). We find that the Ste50 IDR shows only 27.76% (SD = 11.94%) average pairwise percent identity (Fig. 1C), which is similar to scrambled IDR sequences (Materials and Methods), which show 24.40% pairwise percent identity (mean of 100 simulations), and the 24.26% (SD = 12.27%) pairwise percent identity that we get from aligning randomly chosen nonhomologous disordered regions of the same length as the Ste50 IDR (Materials and Methods). The divergence of the Ste50 IDR also appears to saturate with divergence time (Fig. S1). This rapid divergence is not due to overall divergence of the Ste50 protein, as the adjacent structured domains show strong conservation at the primary amino acid level [SAM, 43.02% (SD = 9.92), and RA domain, 83.61% (SD = 5.28) pairwise percent identity].
Fig. 1.
(A) The adaptor protein Ste50 is phosphorylated by multiple MAPKs, which results in dissociation of the adaptor and associated proteins from membrane-bound Opy2 and subsequent negative regulation of downstream MAPKs. Not all pathway components are shown in the schematic. (B) Alignment of the Ste50 IDR for hemiascomycetes (displayed using Jalview) (67). Percentage identity is shown in blue; MAPK phosphorylation consensus motifs ([S/T]P) are boxed in gray. Species names of IDRs that were used for downstream functional and fitness experiments are highlighted in red. (C) Average pairwise percent identity of the real Ste50 IDR alignment (IDR), compared with a distribution of IDRs with randomly scrambled residues (scrambled IDRs), the Ste50 SAM, and the Ste50 RA domain. The y axis shows the frequency of scrambled IDRs.
Fig. S1.
The pairwise percent divergence of the Ste50 IDR saturates with divergence time (as measured by RA domain divergence). Each point represents a species pair, where the pairwise percent divergence (i.e., 100 – pairwise percent identity) is plotted for the Ste50 RA domain versus the IDR.
The Ste50 IDR also represents a good candidate for evolutionary analysis because it contains a cluster of MAPK consensus phosphorylation sites (S or T, followed by a P) that contribute to signal modulation of MAPK pathways (32–34). Evolutionary turnover within clusters of phosphorylation sites in disordered regions is thought to be widespread (19, 28, 35–37), and the alignment of Ste50 shows that MAPK consensus sites differ in position, spacing, and number, consistent with evolutionary turnover of these sites within the IDR (Fig. 1B).
Diverged Orthologous IDRs Recapitulate Multiple Signaling Functions in S. cerevisiae.
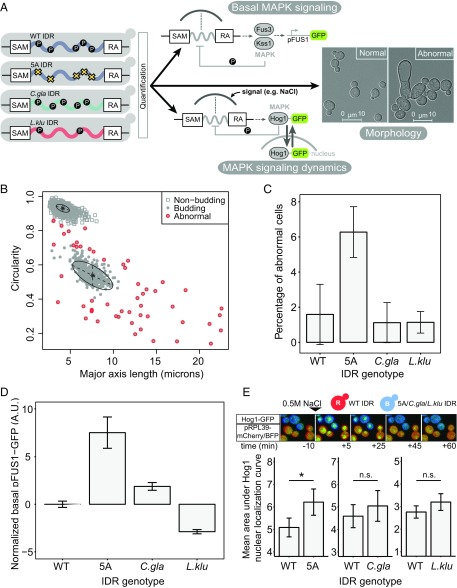
Phosphorylation of the MAPK consensus sites in the Ste50 IDR results in attenuation of signaling by dissociation of the signaling complex from the membrane (33). Phospho-proteomic studies also indicate phosphorylation of a subset of these sites in standard growth conditions (19, 38–43), which we refer to as basal phosphorylation. To test the function of this region in S. cerevisiae, we therefore made an unphosphorylatable mutant, where each consensus site was mutated to alanine (referred to as 5A mutant) (Materials and Methods). Previous studies have shown that this mutant is defective in Hog1 signaling dynamics and displays increased basal expression of FUS1, presumably because of overactive effector kinases Fus3 and Kss1 (32, 33). To determine whether or not diverged sequences are divergent in function, we swapped orthologous IDR sequences from two yeast species (Candida glabrata and Lachancea kluyveri) into S. cerevisiae (Materials and Methods) and quantified the function of these chimeric Ste50s compared with the wild-type and 5A mutant (Fig. 2A).
Fig. 2.
Diverged orthologous IDRs recapitulate S. cerevisiae IDR functions compared with the 5A mutant. (A) Diverged IDRs were swapped with the S. cerevisiae IDR, and three different functional outputs were quantified: morphology, basal MAPK (Fus3) signaling, and MAPK (Hog1) signaling dynamics. (B) Cell morphology clusters along two dimensions. Each point represents one cell for which major axis length and circularity features were extracted. Figure shows example plot from one biological replicate, where cells have been classified as nonbudding, budding, and abnormal (Materials and Methods for details). (C) Average percentage of cells with abnormal morphology for each IDR genotype. Error bars represent 1.96 SE between three biological replicates (average of ∼400 cells per replicate). (D) Diverged IDRs mostly recapitulate wild-type basal pFUS1-GFP levels. Error bars represent 1.96 SE between 6 to 12 biological replicates (50,000 cells per replicate) for each strain. (E, Top) Representative images of time-lapse movies capturing Hog1-GFP localization in cocultured wild-type and experimental strains (constitutively expressing mCherry and mTagBFP2, respectively). (Bottom) Diverged IDRs recapitulate wild-type Hog1 signaling dynamics. Error bars represent 1.96 SE. Asterisk represents statistical significance (P < 0.01, Student’s t test, n = 15–35 cells) while n.s. indicates no statistical significance (P > 0.05, Student's t test, n = 15–35 cells).
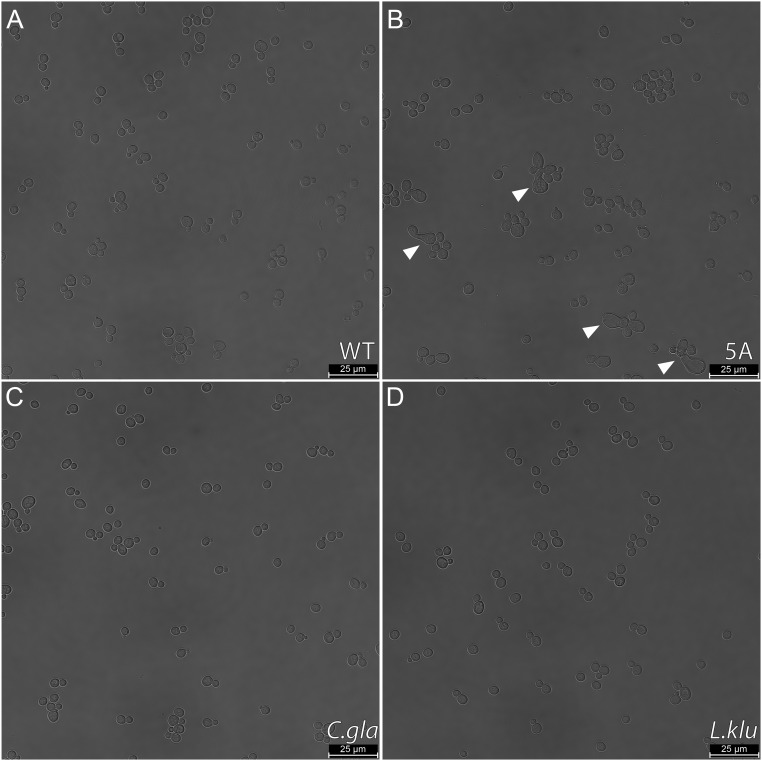
Interestingly, we noticed that the 5A mutant displays abnormal morphology in a small subset of cells (Fig. 2A, zoomed-in micrograph and Fig. S2, wide field of view), which, to our knowledge, was previously unreported. We therefore first tested whether the chimeric Ste50 proteins could rescue these abnormal morphologies. We quantified morphology using the length of the major axis (a measure to capture the elongated shape of the abnormal cells) as well as circularity (a measure to capture the irregular, noncircular shape of the abnormal cells) (Materials and Methods for details). Along these dimensions, the vast majority of cells fall into two clear clusters based on their shape: nonbudding cells, which are highly circular and have a small major axis length, and budding cells, which are less circular and have a higher major axis length (Fig. 2B). We defined the cells that fell outside of these clusters as “abnormal” cells and quantified the fraction of abnormal cells for each genotype (Fig. 2C). We found 6.3% (SD = 1.3%) abnormal cells in the 5A mutant population, compared with less than 2% (SD ≤ 1.5) abnormal cells for the wild-type strain and the orthologous, diverged IDRs (Fig. 2C). We therefore conclude that the diverged IDRs quantitatively recapitulate wild-type morphology.
Fig. S2.
(A–D) Example brightfield (BF) micrographs from each assayed strain (indicated in bottom right corner of panels). Arrows indicate example cells with abnormal morphology.
We then sought to quantify the basal activity of the Fus3 and Kss1 MAPKs, as the IDR is known to be involved in negative regulation of these kinases (32, 33). We quantified basal MAPK signaling by using a genomically integrated GFP reporter driven by the FUS1 promoter (pFUS1), a transcriptional target of Ste12, the effector of Fus3 and Kss1 signaling (44, 45). As expected, we found that the 5A mutant had significantly higher levels of basal pFUS1-GFP expression compared with the wild type in flow cytometry analysis (Fig. 2D) (Materials and Methods). This is consistent with the IDR being important for negative regulation of basal Fus3 and Kss1 signaling, as suggested by previous studies (32, 33). In contrast, we found that the diverged, orthologous IDRs mostly recapitulated wild-type basal pFUS1 expression.
The Ste50 IDR has also been shown to modulate the dynamics of Hog1 activity following activation by osmotic stress. Previous studies have shown that Hog1 is active for a longer amount of time when the five phosphorylation sites in the Ste50 IDR are mutated to alanine—this is thought to happen because of relaxed negative feedback on the HOG (High Osmolarity Glycerol) pathway (32, 33). Based on previous work (46), we used Hog1-GFP nuclear localization as a proxy for Hog1 activity. To eliminate experimental day-to-day variation in the length of Hog1 activity following stimulation, we devised an assay through which we could directly compare Hog1 signaling for different IDR genotypes in an identical environment (Fig. 2E, Top). To do so, we constitutively expressed different fluorescent proteins in wild-type and experimental (i.e., 5A or orthologous IDR) strains to differentially label IDR genotypes in each experiment. We were thus able to coculture strains and, following addition of stimulus, captured Hog1 nuclear localization for single cells with different IDRs in the same field of view through time-lapse imaging (Materials and Methods for details). As expected, Hog1 in the 5A mutant displayed a significantly slower return to baseline activity compared with the wild type, as evidenced by a longer duration and magnitude of Hog1 nuclear localization (Fig. 2E). However, the diverged orthologous IDRs recapitulated the wild-type signaling dynamics, showing no significant deviation from wild type in the duration and magnitude of Hog1 localization.
Diverged Orthologous IDRs Rescue Fitness in S. cerevisiae.
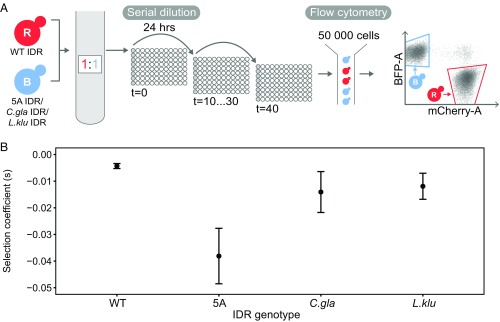
Having established that the diverged IDRs from other species could perform the known signaling functions of the S. cerevisiae IDR, we tested whether they were able to support wild-type growth and reproduction. We therefore quantified the fitness of the genotypes carrying diverged orthologous IDRs. For this we used a quantitative competitive growth assay, where we directly competed the wild-type strain against all experimental strains (Fig. 3A; Materials and Methods for details). We did this by labeling the wild type with one fluorescent protein (ymCherry or mTagBFP2) and the experimental strains with a different fluorescent protein (ymCherry or mTagBFP2) and measuring growth of serially diluted, cocultured cells over time. We found that although the 5A mutant displayed a significant fitness defect compared with the wild-type strain (mean selection coefficient of –0.038, SE = 0.005), the diverged IDRs displayed a much lower fitness defect compared with the wild-type strain (mean selection coefficient of –0.014, SE = 0.004 for C. glabrata and –0.012, SE = 0.002 for L. kluyveri) (Fig. 3B). This is consistent with these IDRs recapitulating not only the function of the S. cerevisiae IDR in vivo but also recapitulating most of the fitness of the wild-type IDR (Discussion).
Fig. 3.
Diverged orthologous IDRs rescue fitness of wild-type S. cerevisiae IDR compared with 5A mutant. (A) High-throughput quantitative competition assay captures growth rate of cocultured cells over time. (B) Relative selection coefficients of 5A mutant and orthologous IDRs versus wild type. Error bars represent 1.96 SE; n = 2 for wild type, n = 4 for 5A, C. glabrata, and L. kluyveri IDRs.
Basal Net Charge of Diverged Sequences Is Correlated with Functional Output.
Despite the sequence divergence of this IDR in orthologous yeast proteins, the IDRs we tested were able to mostly recapitulate function and fitness in S. cerevisiae. This led us to ask if there are certain features in the sequence that are contributing to function and are therefore likely to be under selection. Although we know that the five MAPK consensus phosphorylation sites are important for function in S. cerevisiae (32, 33), the L. kluyveri IDR only has two consensus sites (Fig. 1B) and has a similar functional output (basal FUS1 signaling and morphology) to S. cerevisiae (Fig. 2). Further, the C. glabrata and L. kluyveri IDRs conferred almost identical fitness in the S. cerevisiae background despite the former having five consensus phosphorylation sites and the latter having two (Fig. 3B). Taken together, these results suggest that the number of MAPK consensus phosphorylation sites alone does not explain the functional output of the Ste50 IDR. However, the multiply-phosphorylated Ste50 IDR’s interactions with membrane-bound Opy2 (33) are reminiscent of the Ste5 disordered signaling region in S. cerevisiae, whose multiple MAPK consensus phosphorylation sites are thought to electrostatically modulate its interactions with the membrane (47). Net charge is also thought to be a general functional property of IDRs (5, 48) and has been shown to modulate conformational and binding properties of other intrinsically disordered proteins (49–51). We therefore speculated that the salient sequence feature influencing the functional output of the Ste50 IDR could be its net charge.
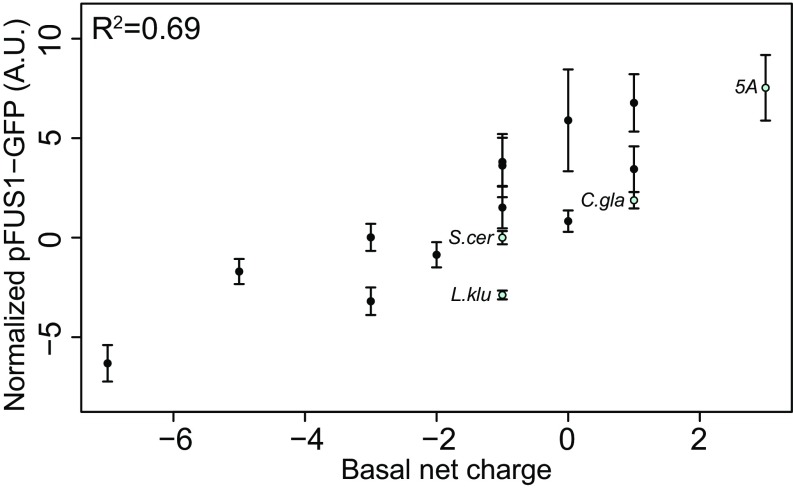
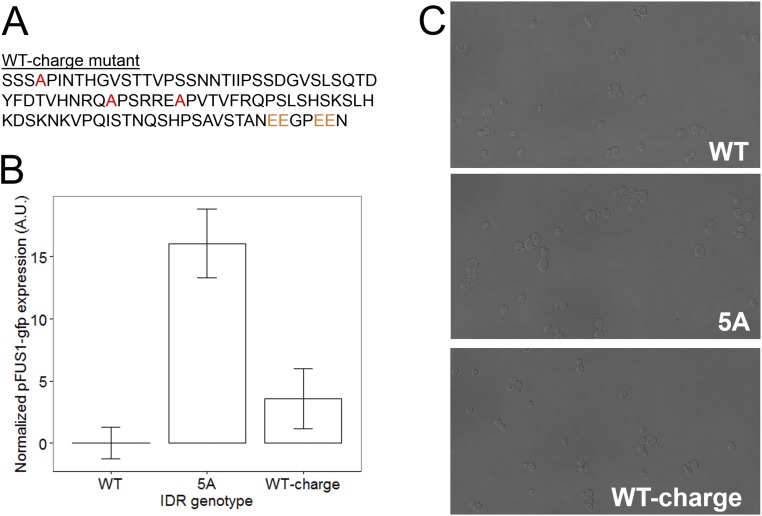
Because our simplest quantitative measure of functional output is the basal expression of pFUS1, we correlated this with the basal net charge for each of the IDRs that we tested in our previous experiments (Fig. 4, blue points). We calculated the basal net charge of each IDR by considering its net charge (sum of positive and negatively charged residues) including basal phosphorylation at up to two SP sites, as mass spectrometry studies have found that up to two serines are phosphorylated in this IDR under basal conditions in S. cerevisiae (as reported in refs. 19, 38–43). Therefore, if the IDR has two or more SP sites, we assume that two of these serines are phosphorylated under basal conditions and add a charge of –4 (–2 for each phosphorylation site) to the net charge of the IDR (Materials and Methods for details). To test the hypothesis that two SP sites are phosphorylated under basal conditions and contribute to net charge, we constructed an S. cerevisiae IDR where three out of five [S/T]P MAPK consensus phosphorylation sites were mutated to alanine, but two of the [S/T]P MAPK consensus phosphorylation sites were mutated to double glutamic acids (EE), as phospho-charge mimics (Fig. S3A). By our calculation, this IDR has the same basal net charge as the basally phosphorylated wild-type S. cerevisiae IDR. We find that this IDR (which we refer to as “WT-charge”) has wild type-like pFUS1 expression levels (Fig. S3B) and wild type-like morphology (Fig. S3C), supporting our assertion that basally phosphorylated sites in the Ste50 IDR contribute to net charge, which is associated with wild-type function.
Fig. 4.
Basal net charge and MAPK reporter pFUS1-GFP expression are positively correlated. Each point represents a different IDR genotype (with blue corresponding to previously shown orthologous IDRs, the wild-type S. cerevisiae IDR, and the 5A IDR mutant, and black corresponding to engineered IDRs with varying phosphorylatable residues, charge, and length). Error bars represent 1.96 SE.
Fig. S3.
An unphosphorylatable mutant S. cerevisiae IDR with identical basal net charge to the wild type (“WT-charge” mutant) recapitulates wild-type morphology and pFUS1 expression. (A) Amino acid sequence of the WT-charge mutant IDR, with mutated phosphorylation sites highlighted in red when mutated to alanine and orange when mutated to glutamic acid. (B) Mean pFUS1-gfp expression for wild-type (WT), 5A mutant (5A), and WT-charge mutant IDRs. Error bars represent 1.96 SE of three biological replicates. (C) Example brightfield (BF) micrographs from WT, 5A, and WT-charge mutant IDR strains.
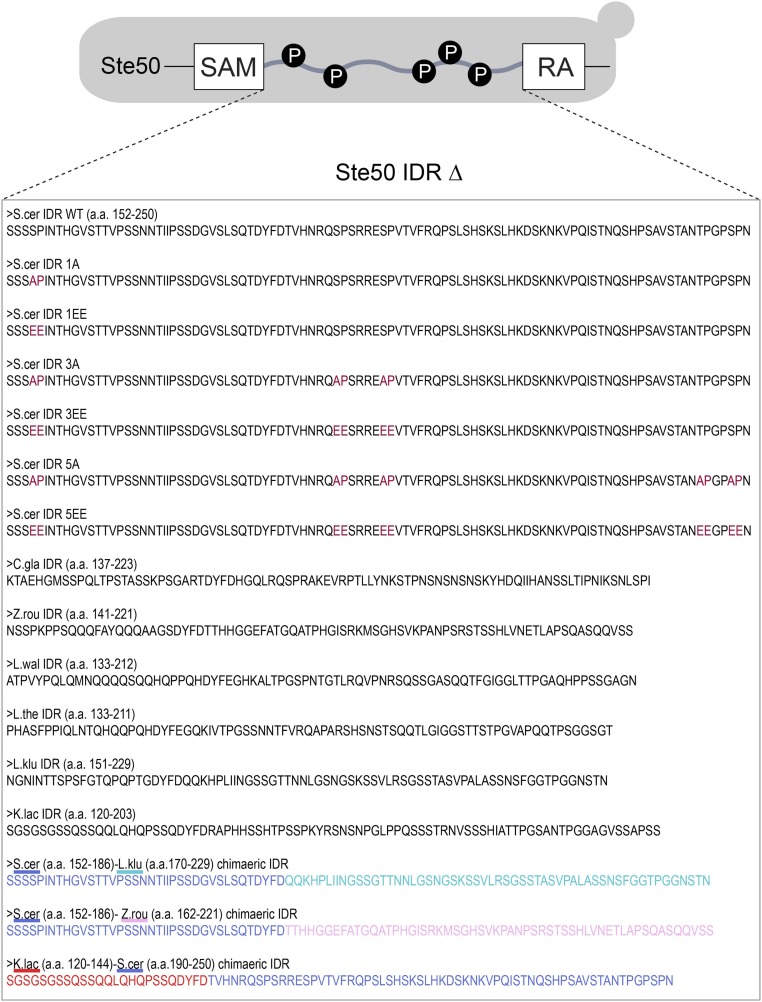
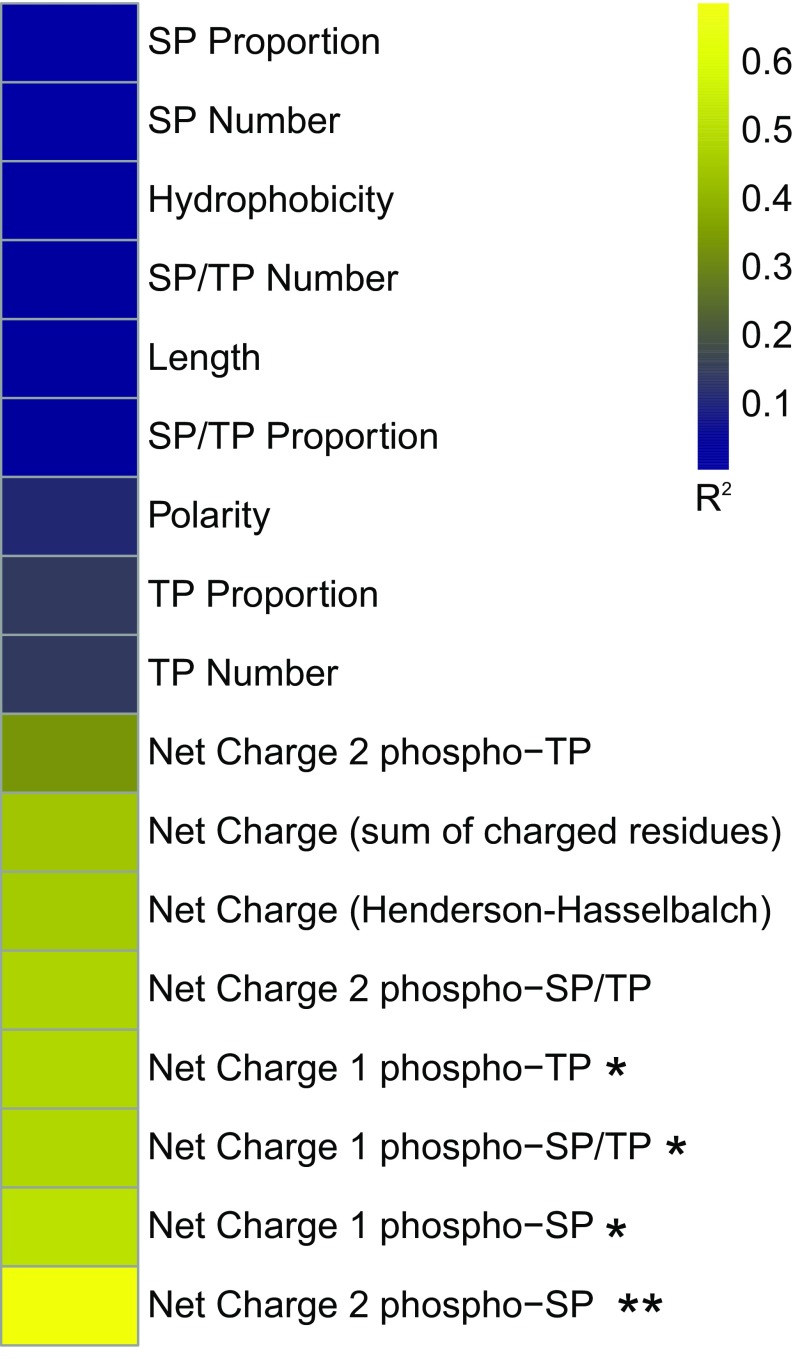
To further test the correlation between basal net charge and functional output in the form of pFUS1 expression, we engineered a series of IDRs broadly falling into the following categories: point mutations in the S. cerevisiae IDR, more examples of orthologous IDRs, and chimeric IDRs (Fig. S4). We also tested 16 other sequence features that could potentially impact the functional output of these IDRs (Fig. S5) but only found a strong and significant positive correlation (R2 = 0.69, Bonferroni corrected P = 0.001) between the basal net charge of these sequences and their functional output (Fig. 4, black points). The positive relationship between charge and signaling is similar to previous evidence from Ste5 suggesting that an increase in negatively charged residues weakens the interaction of the disordered region with the membrane, thus decreasing signal. Taken together, these data suggest that the amino acid composition of these sequences can modulate the functional output of the IDRs via the basal net charge.
Fig. S4.
List of engineered Ste50 IDRs used in correlation study (Fig. 4).
Fig. S5.
Heat map of sequence features correlated with functional output (pFUS1-GFP expression) of the Ste50 IDRs tested. *P < 0.05 Bonferroni-corrected, **P < 0.01 Bonferroni-corrected. In order of appearance in the figure: SP proportion refers to the number of SP phosphorylation consensus motifs divided by the total number of amino acids in the IDR; SP number refers to number of SP phosphorylation sites regardless of IDR length; hydrophobicity refers to the GRAVY (grand average of hydropathy) index score of each IDR; SP/TP number is the number of SP or TP phosphorylation consensus motifs in the IDR; length is the total number of amino acid residues in the IDR; SP/TP proportion is the number of SP or TP phosphorylation consensus motifs divided by the total number of amino acids in the IDR; polarity is the average polarity score of the IDR; TP proportion is the number of TP consensus phosphorylation sites divided by the total number of amino acids in the IDR; TP number is the total number of TP consensus phosphorylation sites in the IDR; net charge (sum of charged residues) is the number of positively charged residues in the IDR minus the number of negatively charged residues in the IDR; net charge (Henderson–Hasselbach) is the net charge of the IDR as calculated by the Henderson–Hasselbalch equation at pH 7 and pKa determined by the Lehninger scale; net charge 1 or 2 phospho-SP or TP or SP/TP refers to the net charge (sum of charged residues) in the IDR with the potential for basal phosphorylation of one or two SP, TP, or SP/TP phosphorylation consensus motifs (see Materials and Methods for more details on calculations).
Selection Maintains Functional Output Despite Divergence at the Primary Sequence Level.
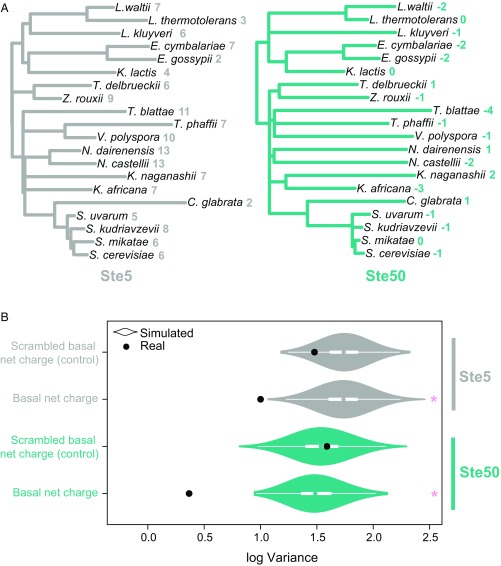
We next wanted to understand whether selection is preserving the function of these IDRs, despite the apparent divergence at the level of the primary amino acid sequence. Because the basal net charge of the IDRs is strongly correlated with their functional output (Fig. 4), we considered this to be a quantitative trait on which selection could act. Stabilizing selection is expected to decrease trait variance by removing extreme phenotypes from the population (52–54). We therefore used a phylogenetic comparative approach to test for reduced trait variance, which indicates selective constraint to preserve basal net charge across species (Fig. 5A). To do so, we applied a Brownian motion (BM) model (55) (Materials and Methods) to estimate the evolutionary variance of basal net charge and compared it to a null expectation of disordered region evolution without selection on basal net charge.
Fig. 5.
Stabilizing selection constrains the evolution of basal net charge in Ste50. (A) Phylogenetic trees inferred from Ste5 (Left) and Ste50 (Right) IDRs with constrained resolved species topology. Quantitative trait value (basal net charge) for each species is indicated on tree tips. (B) Log evolutionary variance compared between real proteins (black dots) and 1,000 simulated proteins (violin plots) for Ste5 (top) and Ste50. White boxes show interquartile range and median. Basal net charge was calculated as the sum of positively and negatively charged residues accounting for basal phosphorylation of two SP motifs and with basal phosphorylation of two scrambled PSX motifs [“Scrambled basal net charge (control)”]. Asterisks indicate statistical significance between log variance in real sequences versus empirical distribution of 1,000 simulated sequences (P < 0.001).
To obtain an expectation for the evolution of basal net charge in the absence of selection on basal net charge, we simulated molecular evolution of the Ste50 IDR. To do so, we used a simulator that includes disordered region-specific substitution patterns as well as position-specific local evolutionary rates, such that SLiMs in disordered regions are preserved in the simulations through purifying selection (16, 56) (Materials and Methods). In using this simulation as a null expectation, we do include selection that can be inferred from the multiple sequence alignments but do not include additional selection on basal net charge. Thus, our null expectation includes selection, and deviations from it imply additional selection that is not apparent in sequence alignments (Discussion).
We then compared the variance in the basal net charge inferred using the BM model on these simulated sequences to that inferred for the real Ste50 IDR alignment. We found that the variance of the real Ste50 IDR sequences was lower than all simulated sequences (Fig. 5B, turquoise plots). Lower variance in basal net charge for Ste50 implies evolutionary constraint on basal net charge, consistent with stabilizing selection.
To confirm that the findings were not a result of unrealistic assumptions in our simulations, as a negative control, we also performed the analysis with positive and negative charges reassigned to four different residues (asparagine, glycine, threonine, alanine) than those known to be charged under physiological pH conditions (glutamic acid, aspartic acid, lysine, arginine) and assuming basal phosphorylation of two “scrambled” phosphorylation sites (“PSX” motifs, where X is any amino acid other than proline). We found that the evolutionary variance in these negative controls (scrambled charged residues and phosphorylation motifs) was not different from the null expectation (Fig. 5B).
We conducted the same analysis on Ste5, the previously mentioned signaling protein known to rely on net charge for functional output (47). If selection is acting to preserve basal net charge in the Ste5 disordered region, we also expect reduced evolutionary variance relative to simulations. We find similar results for Ste5 as for Ste50 (Fig. 5B, gray plots), consistent with selection preserving its function, and suggesting that the phylogenetic comparative approach may be a general method to detect selection on basal net charge in diverged disordered regions.
Discussion
To date, experimental studies of protein evolution have focused on structured classes of proteins such as enzymes, where point mutations in the primary amino acid sequence are consistently coupled with functional divergence (57). However, the functional consequences of evolutionary divergence in IDRs of proteins have remained largely unexplored, save for two in vitro studies (58, 59).
In this study, we show that highly diverged, orthologous IDRs can perform similar signaling functions and confer similar fitness to a wild-type IDR in S. cerevisiae. To do so, we took advantage of several quantitative signaling assays, including a dynamic fluorescence–microscopy experiment that allows comparison of different genotypes in coculture. This allows for quantitative comparisons of signaling dynamics by controlling for imaging and culture conditions.
Using these quantitative assays, we found that the orthologous IDRs did not precisely recapitulate wild-type signaling and fitness in S. cerevisiae. Although we chose an IDR that is involved in conserved signaling pathways, there could be coevolution of the orthologous IDRs with other proteins in their native signaling pathways or with the rest of the orthologous protein itself. Thus, inserting the orthologous IDRs in a S. cerevisiae context could be slightly detrimental to their function. This is an important caveat for experimental studies where protein regions are expressed outside their native context.
We found evidence that the electrostatic charge of the Ste50 IDR is correlated with signaling output of the mating pathway. Although previous studies had identified the phosphorylation sites in this region as being important for signaling (32, 33), we found no correlation between just the number of MAPK consensus sites in the IDR and the functional output we tested. We speculate that the phosphorylation sites contribute to the net charge of the region and allow the cell to modulate the charge of the region in response to signals. This is consistent with the model for the evolution of phosphorylation sites as a mechanism for modulation of charge (60). The importance of the basal net charge of the Ste50 IDR in signaling function is also consistent with recent studies suggesting that “cryptic” electrostatic properties encoded in amino acid sequences of IDRs are important for their function (61, 62). We speculate that the charge of the Ste50 IDR affects interactions with the cell membrane, as has been demonstrated for Ste5 (47), but understanding the precise biophysical and biochemical properties of the Ste50 IDR that translate charge into signaling output is an important area for further study.
By treating the charge as a quantitative trait (52), we were able to apply phylogenetic comparative methods (53, 55, 63) to the disordered protein sequences and found evidence that these electrostatic properties are likely under stabilizing selection. Because disordered regions show little conservation at the sequence level, functional prediction methods based on amino acid sequence similarity have limited power. We believe that phylogenetic comparative methods represent an alternative approach to detect functional features within disordered regions. Selection on quantitative traits is often inferred using the Ornstein–Uhlenbeck (OU) model, a stochastic model that includes the tendency of a trait to evolve toward an adaptive optimum (53). However, due to the limitations of the OU model (64), we used the simpler approach of testing for reductions in trait variance to infer selection (54).
To test for selection, we compared real to simulated protein sequences. Evidence for selection may be represented by any disparity between these and real protein sequences. It is important to note that our simulations do include selection to preserve short conserved motifs (through position-specific rates) as well as selection to retain the amino acid frequencies of disordered regions (through disordered region-specific substitution models) (16, 56). Therefore, when we find evidence for selection, it is specifically evidence for conservation beyond what can be expected based on our models of disordered sequence evolution alone. Thus, we believe the reduction in variance observed in real proteins relative to simulated proteins is sufficient to conclude that the evolution of net charge within these disordered regions is selectively constrained. We propose that this is an example of a quantitative trait under stabilizing selection, in which the molecular phenotype of net charge is maintained within an optimal range.
Our results suggest the following picture of disordered region evolution: Rapid evolution within IDRs introduces many mutations of individually small fitness effects, creating slight perturbations in net charge that fall within the nearly neutral range. These mutations contribute to a significant amount of protein sequence divergence. However, stabilizing selection will remove mutations that perturb quantitative traits such as net charge beyond an acceptable range, leading to reduced evolutionary variance. This reflects a form of mutation-selection balance and offers an explanation for the existence of highly divergent genotypes within disordered regions, despite functional constraints. Although mutational input in IDRs is sufficient to generate abundant variation between species, our results are evidence of stabilizing selection constraining a molecular phenotype despite this variation.
Materials and Methods
Ste50 Alignment and Quantification of Divergence.
The multiple sequence alignment for the Ste50 protein and its orthologs (MUSCLE) (65) as well as their illustrated phylogenetic relationship (Fig. 1B) were acquired from the Yeast Gene Order Browser (YGOB) (66) and visualized using Jalview (67). Boundaries for the Ste50 IDR (A.A. 151–251) were acquired using disorder predictions from DISOPRED3 (68). IDR boundaries for the Ste50 orthologs were determined via multiple sequence alignment, using the boundaries from the S. cerevisiae Ste50 IDR. All pairwise percentage identities were calculated using Jalview (67), which calculates the pairwise percent identity as the number of identical residues divided by the number of aligned residues for each pairwise realignment. For the set of randomly scrambled IDRs, the amino acids in the IDRs from Ste50 and each of its orthologs were randomly scrambled 100 times (leaving the remainder of each protein unscrambled), and the average percent identity of each pairwise alignment was calculated (distribution of these averages is plotted in Fig. 1C). For the comparison of pairwise percent identity to random sequences, we calculated the pairwise percent identity of 19 (same number as the YGOB orthologs) random IDRs in the yeast proteome that had the same length as the Ste50 IDR (YBL081W, YBR033W, YBR081C, YDR282C, YDR527W, YIL105C, YJL090C, YLL027W, YLR399C, YML045W, YMR266W, YMR277W, YNL047C, YNL288W, YOR153W, YOR316C, YPL053C, YPL270W, and YPR115W).
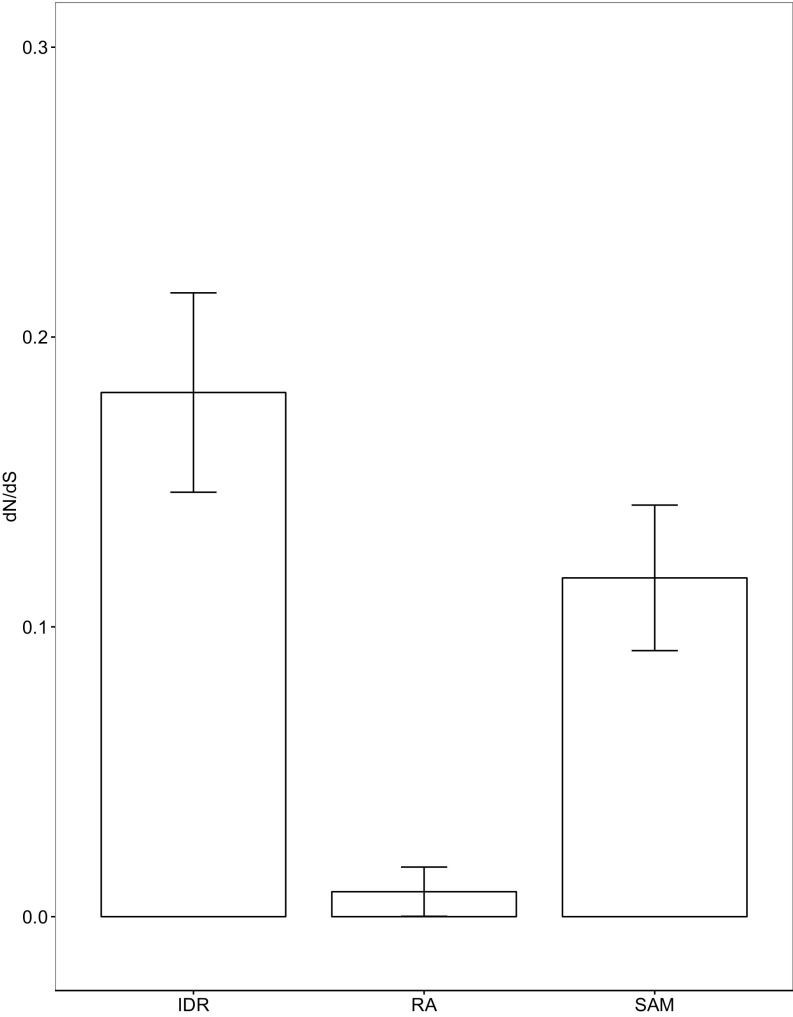
We also calculated dN/dS ratios for the IDR, SAM domain, and RA domain (Fig. S6). To do this, we first used PAL2NAL (69) to obtain a codon alignment based on the protein alignment and DNA sequences of Ste50 for the Saccharomyces sensu stricto species available from YGOB (S. cerevisiae, Saccharomyces mikatae, Saccharomyces kudriavzevii, and Saccharomyces uvarum). We then used the PAML CODEML package (70) on the respective alignments and the corresponding species topology tree and estimated the dN/dS ratio across the respective trees using the M0 model and the F1 × 4 codon frequency model.
Fig. S6.
dN/dS values compared between the Ste50 IDR, the RA domain, and the SAM domain. The dN/dS value for the IDR is higher (0.18) compared with the SAM (0.12) and RA (0.01) domains. However, much of the sequence variation in IDRs comes from the high rates of non–frame-shifting insertions and deletions that we find in these regions (9–13), which would not be captured in the dN/dS analysis. Therefore, dN/dS is likely to overestimate the constraint in disordered regions. Error bars represent 1.96 SE.
Strain Construction and Growth Conditions.
All strains (Table S1) were constructed in the S. cerevisiae BY4741 ssk22∆0::kanMX4 ssk2∆0 background (ssk2 and ssk22 were knocked out to disable the partially redundant SLN1 branch of the HOG pathway, as Ste50 is only active in the SHO1 branch) (71). Mutagenized IDRs, chimeric IDRs, and reporters were constructed using Gibson cloning (72) and standard site-directed PCR mutagenesis and confirmed by Sanger sequencing. IDRs from orthologous proteins were amplified from purified genomic DNA of C. glabrata, L. kluyveri, Zygosaccharomyces rouxii, Lachancea waltii, Lachancea thermotolerans, and Kluyveromyces lactis (Fig. S4 for IDR a.a. boundaries for each species). All transformations were performed using the standard lithium acetate procedure (73). Genomic integration of IDR transformants was done using the seamless Delitto Perfetto in vivo site-directed mutagenesis method (74) at the endogenous Ste50 IDR locus and confirmed by Sanger sequencing. Genomic integration of the pFUS1-GFP reporter was done at the HO locus using a selectable marker (URA3) and confirmed by PCR. Genomic integration of pRPL39-ymCherry and pRPL39-mTagBFP2 was done at the pCAN1 locus using a selectable marker (LEU2) and confirmed by PCR and/or microscopy. Hog1 was tagged with yemGFP at the C terminus using Delitto Perfetto and confirmed by Sanger sequencing.
Table S1.
List of strains used in this study
| Strain | Genotype | Source | Used to assay |
| DMA580 | MATa his3∆1 leu2∆0 ura3∆0 met15∆0 his3∆1 leu2∆0 ura3∆0 met15∆0 SSK22:KanMX4 | Giaever et al., 2002 | N/A |
| YTZ3 | MATa his3∆1 leu2∆0 ura3∆0 met15∆0 SSK22::HisMX3 SSK2∆0 | This study | Morphology |
| YTZ44 | MATa his3∆1 leu2∆0 ura3∆0 met15∆0 SSK22::HisMX3 SSK2∆0 STE50IDR::STE50IDR-S155A,S196A,S202A,T244A,S248A | This study | Morphology |
| YTZ45 | MATa his3∆1 leu2∆0 ura3∆0 met15∆0 SSK22::HisMX3 SSK2∆0 STE50IDR::STE50 Cgla IDR | This study | Morphology |
| YTZ49 | MATa his3∆1 leu2∆0 ura3∆0 met15∆0 SSK22::HisMX3 SSK2∆0 STE50IDR::STE50 Lklu IDR | This study | Morphology |
| YTZ8R | MATa his3∆1 leu2∆0 ura3∆0 met15∆0 SSK22::HisMX3 SSK2∆0 HOG1-Cterm::yemGFP pCAN1::pRPL39-ymCherry-LEU2 | This study | Hog1 signaling dynamics |
| YTZ8B | MATa his3∆1 leu2∆0 ura3∆0 met15∆0 SSK22::HisMX3 SSK2∆0 HOG1-Cterm::yemGFP | This study | Hog1 signaling dynamics |
| YTZ24R | MATa his3∆1 leu2∆0 ura3∆0 met15∆0 SSK22::HisMX3 SSK2∆0 HOG1-Cterm::yemGFP STE50IDR::STE50IDR-S155A,S196A S202AT244A,S248A pCAN1::pRPL39-ymCherry-LEU2 | This study | Hog1 signaling dynamics |
| YTZ24B | MATa his3∆1 leu2∆0 ura3∆0 met15∆0 SSK22::HisMX3 SSK2∆0 HOG1-Cterm::yemGFP STE50IDR::STE50IDR-S155A,S196A,S202AT244A,S248A pCAN1::pRPL39-mTagBFP2-LEU2 | This study | Hog1 signaling dynamics |
| YTZ25R | MATa his3∆1 leu2∆0 ura3∆0 met15∆0 SSK22::HisMX3 SSK2∆0 HOG1-Cterm::yemGFP STE50IDR::STE50 Cgla IDR pCAN1::pRPL39-ymCherry-LEU2 | This study | Hog1 signaling dynamics |
| YTZ25B | MATa his3∆1 leu2∆0 ura3∆0 met15∆0 SSK22::HisMX3 SSK2∆0 HOG1-Cterm::yemGFP STE50IDR::STE50 Cgla IDR pCAN1::pRPL39-mTagBFP2-LEU2 | This study | Hog1 signaling dynamics |
| YTZ29R | MATa his3∆1 leu2∆0 ura3∆0 met15∆0 SSK22::HisMX3 SSK2∆0 HOG1-Cterm::yemGFP STE50IDR::STE50 lKlu IDR pCAN1::pRPL39-ymCherry-LEU2 | This study | Hog1 signaling dynamics |
| YTZ29B | MATa his3∆1 leu2∆0 ura3∆0 met15∆0 SSK22::HisMX3 SSK2∆0 HOG1-Cterm::yemGFP STE50IDR::STE50 lKlu IDR pCAN1::pRPL39-mTagBFP2-LEU2 | This study | Hog1 signaling dynamics |
| YTZ60 | MATa his3∆1 leu2∆0 ura3∆0 met15∆0 SSK22::HisMX3 SSK2∆0 HO::pFUS1-yemGFP-klURA3 | This study | Fus3 basal signaling |
| YTZ62 | MATa his3∆1 leu2∆0 ura3∆0 met15∆0 SSK22::HisMX3 SSK2∆0 STE50IDR::STE50IDR-S155A HO::pFUS1-yemGFP-klURA3 | This study | Fus3 basal signaling |
| YTZ62EE | MATa his3∆1 leu2∆0 ura3∆0 met15∆0 SSK22::HisMX3 SSK2∆0 STE50IDR::STE50IDR- SP155-156EE HO::pFUS1-yemGFP-klURA3 | This study | Fus3 basal signaling |
| YTZ63 | MATa his3∆1 leu2∆0 ura3∆0 met15∆0 SSK22::HisMX3 SSK2∆0 STE50IDR::STE50IDR-S155A,S196A,S202A HO::pFUS1-yemGFP-klURA3 | This study | Fus3 basal signaling |
| YTZ63EE | MATa his3∆1 leu2∆0 ura3∆0 met15∆0 SSK22::HisMX3 SSK2∆0 STE50IDR::STE50IDR- SP155-156EE,SP196-197EE,SP202-203EE HO::pFUS1-yemGFP-klURA3 | This study | Fus3 basal signaling |
| YTZ64 | MATa his3∆1 leu2∆0 ura3∆0 met15∆0 SSK22::HisMX3 SSK2∆0 STE50IDR::STE50IDR-S155A,S196A,S202AT244A,S248A HO::pFUS1-yemGFP-klURA3 | This study | Fus3 basal signaling |
| YTZ64EE | MATa his3∆1 leu2∆0 ura3∆0 met15∆0 SSK22::HisMX3 SSK2∆0 STE50IDR::STE50IDR- SP155-156EE,SP196-197EE,SP202-203EE,TP244-245EE,SP248-249EE HO::pFUS1-yemGFP-klURA3 | This study | Fus3 basal signaling |
| YTZ65 | MATa his3∆1 leu2∆0 ura3∆0 met15∆0 SSK22::HisMX3 SSK2∆0 STE50IDR::Cgla IDR HO::pFUS1-yemGFP-klURA3 | This study | Fus3 basal signaling |
| YTZ66 | MATa his3∆1 leu2∆0 ura3∆0 met15∆0 SSK22::HisMX3 SSK2∆0 STE50IDR::Zrou IDR HO::pFUS1-yemGFP-klURA3 | This study | Fus3 basal signaling |
| YTZ67 | MATa his3∆1 leu2∆0 ura3∆0 met15∆0 SSK22::HisMX3 SSK2∆0 STE50IDR::Lwal IDR HO::pFUS1-yemGFP-klURA3 | This study | Fus3 basal signaling |
| YTZ68 | MATa his3∆1 leu2∆0 ura3∆0 met15∆0 SSK22::HisMX3 SSK2∆0 STE50IDR::Lthe IDR HO::pFUS1-yemGFP-klURA3 | This study | Fus3 basal signaling |
| YTZ69 | MATa his3∆1 leu2∆0 ura3∆0 met15∆0 SSK22::HisMX3 SSK2∆0 STE50IDR::Lklu IDR HO::pFUS1-yemGFP-klURA3 | This study | Fus3 basal signaling |
| YTZ70 | MATa his3∆1 leu2∆0 ura3∆0 met15∆0 SSK22::HisMX3 SSK2∆0 STE50IDR::Klac IDR HO::pFUS1-yemGFP-klURA3 | This study | Fus3 basal signaling |
| YTZ71 | MATa his3∆1 leu2∆0 ura3∆0 met15∆0 SSK22::HisMX3 SSK2∆0 STE50IDR::Scer-Lklu IDR HO::pFUS1-yemGFP-klURA3 | This study | Fus3 basal signaling |
| YTZ72 | MATa his3∆1 leu2∆0 ura3∆0 met15∆0 SSK22::HisMX3 SSK2∆0 STE50IDR::Scer-Zrou IDR HO::pFUS1-yemGFP-klURA3 | This study | Fus3 basal signaling |
| YTZ73 | MATa his3∆1 leu2∆0 ura3∆0 met15∆0 SSK22::HisMX3 SSK2∆0 STE50IDR::Klac-Scer IDR HO::pFUS1-yemGFP-klURA3 | This study | Fus3 basal signaling |
| YTZ3R | MATa his3∆1 leu2∆0 ura3∆0 met15∆0 SSK22::HisMX3 SSK2∆0 pCAN1::pRPL39-ymCherry-LEU2 | This study | Fitness |
| YTZ3B | MATa his3∆1 leu2∆0 ura3∆0 met15∆0 SSK22::HisMX3 SSK2∆0 pCAN1::pRPL39-mTagBFP2-LEU2 | This study | Fitness |
| YTZ44R | MATa his3∆1 leu2∆0 ura3∆0 met15∆0 SSK22::HisMX3 SSK2∆0 STE50IDR::STE50IDR-S155A,S196A,S202AT244A,S248A pCAN1::pRPL39-ymCherry-LEU2 | This study | Fitness |
| YTZ44B | MATa his3∆1 leu2∆0 ura3∆0 met15∆0 SSK22::HisMX3 SSK2∆0 STE50IDR::STE50IDR-S155A,S196A,S202AT244A,S248A pCAN1::pRPL39-mTagBFP2-LEU2 | This study | Fitness |
| YTZ45R | MATa his3∆1 leu2∆0 ura3∆0 met15∆0 SSK22::HisMX3 SSK2∆0 STE50IDR::STE50 Cgla IDR pCAN1::pRPL39-ymCherry-LEU2 | This study | Fitness |
| YTZ45B | MATa his3∆1 leu2∆0 ura3∆0 met15∆0 SSK22::HisMX3 SSK2∆0 STE50IDR::STE50 Cgla IDR pCAN1::pRPL39-mTagBFP2-LEU2 | This study | Fitness |
| YTZ49R | MATa his3∆1 leu2∆0 ura3∆0 met15∆0 SSK22::HisMX3 SSK2∆0 STE50IDR::STE50 Lklu IDR pCAN1::pRPL39-ymCherry-LEU2 | This study | Fitness |
| YTZ49B | MATa his3∆1 leu2∆0 ura3∆0 met15∆0 SSK22::HisMX3 SSK2∆0 STE50IDR::STE50 Lklu IDR pCAN1::pRPL39-mTagBFP2-LEU2 | This study | Fitness |
| YTZ54 | MATa his3∆1 leu2∆0 ura3∆0 met15∆0 SSK22::HisMX3 SSK2∆0 STE50IDR::STE50IDR-S155A,S196A,S202A,TP244-245EE,SP248-249EE | This study | Morphology |
| YTZ74 | MATa his3∆1 leu2∆0 ura3∆0 met15∆0 SSK22::HisMX3 SSK2∆0 STE50IDR::STE50IDR-S155A,S196A,S202A,TP244-245EE,SP248-249EE HO::pFUS1-yemGFP-klURA3 | This study | Fus3 basal signaling |
All experiments were performed on log-phase cells grown at 30 °C in rich (YEP) or synthetic complete (SC) media lacking appropriate nutrients to maintain selection of markers, unless otherwise stated. Two percent (wt/vol) glucose was used as the carbon source for all strains. Where necessary, Geneticin (G418) or 5-Fluoroorotic acid (5-FOA) (75) was used for selection or counterselection, respectively.
Confocal Microscopy and Image Analysis.
All images were acquired on a TCS-SP8 confocal microscope (Leica).
For the morphology experiment, cells were imaged in brightfield on standard, uncoated glass slides. For quantification of morphology, single cells in micrographs were segmented using the thresholding function in ImageJ (76) applied to brightfield images (Fig. S2 for example images) slightly below the focal plane. The features of each segmented cell, particularly the length of the major axis and circularity, were quantified in ImageJ, and Gaussian mixture modeling (using the “mclust” package in R) (77) was used to recognize budding cell (long major axis, lower circularity) and nonbudding cell (shorter major axis, high circularity) clusters for each replicate experiment, which included four micrographs for each of the four genotypes. In each replicate (16 images), we automatically identified 271–532 cells of each of the four genotypes.
Abnormal cells (and missegmented objects) were exclusively assigned to the budding cell cluster by the Gaussian mixture model due to their elongated shape. To identify these abnormal cells, we quantified the Mahalanobis distance of each cell in the budding cell cluster to the center of that cluster (identified independently in each replicate, which includes all four genotypes). The 10% most distant cells to the center of the budding cell cluster were classified as being abnormally shaped (for each replicate). We divided the number of abnormally shaped cells by the total number cells of that genotype and reported the average over the three replicates in Fig. 2C.
To control for possible variation in the fraction of budded cells for each genotype (for example, due to cell cycle effects of the mutations, or other types of variation) that could lead to a bias to identify abnormal cells, we also computed the percentage of budded cells classified as abnormal for each genotype and found the same results as reported above: The 5A strain has a significantly higher fraction of abnormal cells than the WT or orthologous IDR strains.
For the dynamic Hog1 signaling assay, cocultured Hog1-GFP–tagged wild-type and experimental strains (expressing constitutive ymCherry and mTagBFP2, respectively) (Strain Construction and Growth Conditions) were imaged simultaneously on glass dishes coated with 0.1 mg/mL conA as a binding agent (to allow for continuous imaging of the same cells in media over time) (as described in ref. 78). Briefly, glass dishes were spotted with conA solution for 15 min, after which point the conA was aspirated and the spot was washed with sterile water. Once the conA spot was dry, the cells were incubated on the conA spot for 10 min, excess cells were washed off, and the dish was filled with SC media lacking histidine and leucine (the same media in which the cells were cultured). Hog1-GFP was visualized in the cells at baseline levels every 5 min for 10 min, after which NaCl (dissolved in media) was added to the dish on the microscope stage to a final concentration of 0.5 M, serving as the stimulus for the HOG pathway. After addition of NaCl, the same cells were imaged every 5 min for 60 min. Eight evenly spaced z slices covering ∼6 microns in the z plane were imaged, and the maximum projections of these z stacks were used for downstream analysis. After visualization of Hog1-GFP using the 488-nm laser, the 558-nm and 405-nm lasers were switched on to identify the genotype of the cells [wild-type or experimental IDR, based on which fluorescent tag (mCherry or mTagBFP2) was being constitutively expressed]. We sequentially switched on the lasers in this way to prevent the cells from exposure to blue (UV) light during the experiment.
Automated segmentation and quantification of Hog1-GFP time-lapse microscopy images was done using previously described methods (79). Images were manually filtered to remove out-of-focus or missegmented cells as well as buds lacking nuclei. Normalized spatial spread (79) of Hog1-GFP fluorescence was used as a measure of nuclear localization. We plotted this measure over time for each cell and reported the average area under the curve in Fig. 2E. All comparisons are made between cocultured cells that were imaged on the same dish and in the same field of view.
Quantification of Basal FUS1 Expression.
Flow cytometry was performed on a MACSQuant VYB (Miltenyi Biotec Inc.). GFP expression of the integrated pFUS1-GFP reporter (Strain Construction and Growth Conditions) was quantified for 50,000 cells per biological replicate. All GFP intensity values were normalized to the geometric mean wild-type GFP intensity value of the day the experiment was run. Normalized geometric mean GFP intensity values are reported in Fig. 2D.
Quantitative Fitness Assay.
The quantitative fitness assay was adapted from ref. 80. Briefly, individual strains were grown for 48 h at 30 °C in 5 mL of cultures on a rolling wheel. To start the competitive fitness experiment, equal proportions of wild-type and experimental strains (constitutively expressing ymCherry or ymTagBFP2) were mixed in deep 96-well blocks (100 µL of a single ymCherry expressing strain and 100 µL of a single ymTagBFP2 expressing strain into 600 µL of distilled water) at a final 1,024-fold dilution. The cells were then serially diluted 1,024-fold every 24 h. With an estimated 2 × 10⁸ yeast cells per mL at saturation, the population size (Ne) is ∼3.44 × 10⁵.
Each genotype was labeled with both fluorescent proteins, and there were four biological replicates of each competition (two with each color combination). Therefore, we controlled for potential competitive advantage of expressing one fluorescent protein over the other by pooling equal replicates of each color combination (e.g., two biological replicates of blue wild type vs. red experimental strain plus two biological replicates of red wild type vs. blue experimental strain). Using the MACSQuant VYB (Miltenyi Biotec Inc.) flow cytometer, 50,000 cells per competition were counted at the 20th and the 40th generation. We analyzed the data using Flowing software (by Perttu Terho, freely available at flowingsoftware.com) to identify the two differently colored populations of cells. Gates for each population were drawn manually to exclude cells fluorescing in both red and blue channels (dead cells) and were kept consistent throughout the experiment. We then calculated the relative selection coefficient (s) as the increase in logarithmic ratio of the wild-type (WT) and experimental (EXP) cells every generation (81–83), as follows:
where t indicates the number of generations and s is the selection coefficient. We report s in Fig. 3.
Ste50 IDR Sequence Feature Calculations.
We calculated a series of different features for the wild-type Ste50 IDR as well as each IDR that we engineered and regressed the mean pFUS1-GFP levels as a quantitative functional output on these values (correlation shown in Fig. 4). We calculated length; proportion of TP sites, SP sites, or TP/SP sites; number of TP sites, SP sites, or TP/SP sites; net charge of TP sites, SP sites, and TP/SP sites; and net charge plus varying levels of basal phosphorylation on TP sites, SP sites, or TP/SP sites for each IDR. For net charge, we added positively charged residues (lysine, arginine) to negatively charged residues (glutamic acid, aspartic acid) for each IDR, unless otherwise indicated. For net charge with basal phosphorylation (“basal net charge”), we calculated net charge with the above-mentioned method but added a charge of –2 for each phosphorylation site that could potentially be phosphorylated in the IDR. For example, if an IDR had three phosphorylation sites and a net charge of +2 and we considered the net charge with basal phosphorylation of two SP/TP sites, we calculated a value of 2 + 2 * –2 = –2. All trait calculations were made using base functions in R, except the proportion of TP, SP, or TP/SP sites, which was calculated using the “protr” package in R (84); the Henderson–Hasselbalch net charge and hydrophobicity calculations, which were done using the “Peptides” package in ref. 85; and the polarity calculation, which was done using the “alakazam” package in R (86).
Test for Selection on IDR Sequence Features/Quantitative Traits.
To estimate evolutionary time for the phylogenetic comparative method, we assumed that evolutionary distance could serve as a proxy for evolutionary time (following ref. 54). Multiple sequence alignments for Ste5 and its orthologs were obtained from YGOB (66). All evolutionary analyses were performed on only the longest disordered region within Ste5; the boundaries of this region across all orthologs were determined with DISOPRED3 (68) predictions for S. cerevisiae, as with Ste50 (described in Ste50 Alignment and Quantification of Divergence). Evolutionary distances for both Ste50 and Ste5 disordered regions were estimated across the YGOB species’ phylogeny (66) using PAML (70) under the WAG model, with an initial kappa of 2, initial omega of 0.4, and clean data set to 0.
To obtain the expectation of quantitative trait evolution in the absence of selection on the quantitative trait, we simulated a set of 1,000 IDRs, following methods and using software from ref. 56. Briefly, we used a phylogenetic hidden Markov model to infer (i) the location of conserved functional SLiMs, (ii) a column (per site) rate of evolution, and (iii) a local (window of 31 residues) rate of evolution. The simulated disordered regions were generated using the S. cerevisiae disordered region as the root sequence, the constraints inferred from the phylogenetic hidden Markov model, as well as an amino acid substitution model that accounts for the exchangeability of amino acid pairs specific to disordered regions (56).
We applied a BM model to both real and simulated sequences. BM is a model that can be used to describe the evolution of quantitative traits (55). This model is given by the equation: dX(t) = σdB(t), where dX(t) represents the change in a trait value (X) over time (t), σ represents the intensity of random fluctuations, and B(t) is drawn at random from a normal distribution with a mean of 0 and a variance of σ2 (87). We applied this model using the “GEIGER” package in R (88). Basal net charge was calculated (Ste50 IDR Sequence Feature Calculations) assuming basal phosphorylation of up to two “SP” motifs (each phosphorylation event decreases the net charge by 2). As a negative control, we defined another quantitative trait—that is, “scrambled” charge—with positive and negative charges reassigned to four different residues (asparagine, glycine, threonine, alanine) than those known to be charged under physiological pH conditions and assuming basal phosphorylation of up to two “scrambled” phosphorylation sites (PSX motifs, where X is any amino acid other than proline).
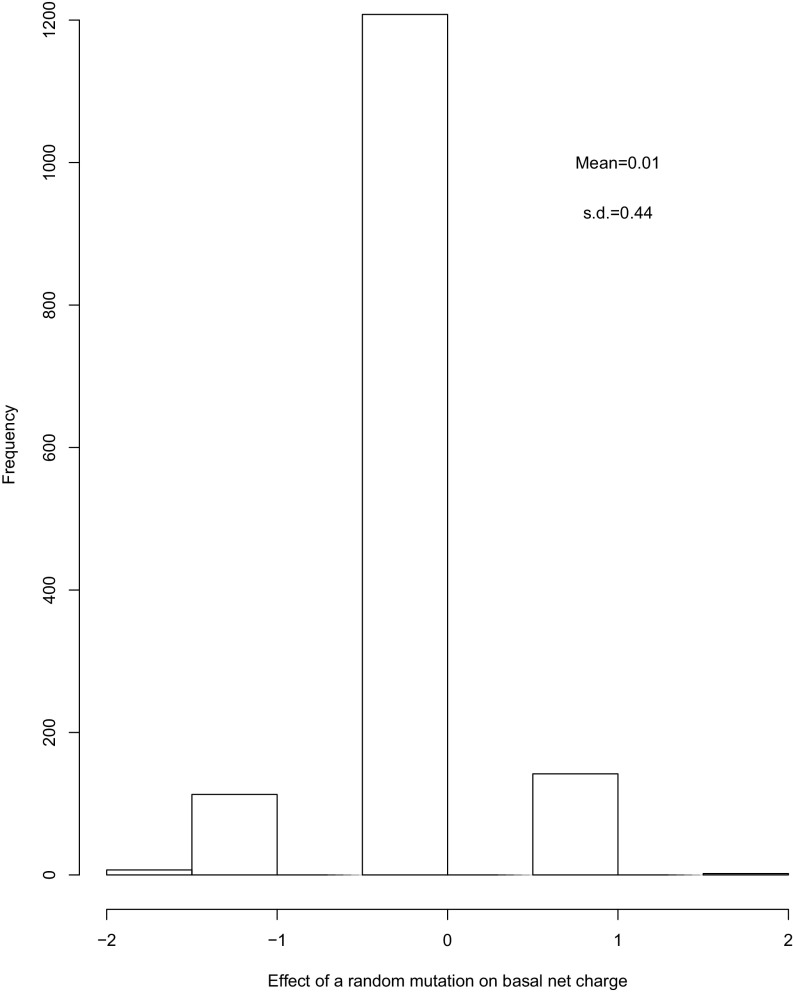
Estimation of evolutionary variance with BM assumes mutations have approximately symmetrically distributed effects on quantitative traits with mean equal to zero. We therefore tested the average effect of a random mutation on the basal net charge trait (Fig. S7). We did this by using evolver in the PAML package (70). We simulated nucleotide evolution using the Ste50 IDR nucleotide sequence as the root sequence, under the HKY85 model with parameters estimated from the Ste50 IDR alignment of sensu stricto species: kappa of 3.36 and base frequencies of 0.20370, 0.31145, 0.31481, and 0.17003 for T, C, A, and G, respectively. We ran the simulation 2,000 times and calculated the difference in basal net charge from the initial root sequence for the 1,472 sequences that only had one mutation.
Fig. S7.
Distribution of effects of a random nucleotide mutation on basal net charge. n = 1,472.
Acknowledgments
Thanks to Henry Hong and Drs. Mojca Mattiazzi Usaj, Yihan Lin, and Michael Elowitz for technical advice and/or assistance with time-lapse microscopy; Dr. Louis-François Handfield and Mitchell Li Cheong Man for advice and assistance with scripts for time-lapse image analysis and phylogenetic comparative analysis, respectively; Drs. Julie Forman-Kay, Sergio Peisajovich, Alan Davidson, and Muluye Liku and other members of the A.M.M. laboratory for helpful discussions; and the Peisajovich lab for use of the MACSQuant VYB flow cytometer. This work was funded by a Natural Sciences and Engineering Research Council (NSERC) doctoral Canada Graduate Scholarship (T.Z.), an Ontario Graduate Scholarship (T.Z.), an NSERC Discovery Grant (to A.M.M.), Canadian Institutes of Health Research Grant PJT-148532 (to A.M.M.), and infrastructure grants from the Canada Foundation for Innovation (to A.M.M.).
Footnotes
The authors declare no conflict of interest.
This article is a PNAS Direct Submission.
This article contains supporting information online at www.pnas.org/lookup/suppl/doi:10.1073/pnas.1614787114/-/DCSupplemental.
References
- 1.Ward JJ, Sodhi JS, McGuffin LJ, Buxton BF, Jones DT. Prediction and functional analysis of native disorder in proteins from the three kingdoms of life. J Mol Biol. 2004;337(3):635–645. doi: 10.1016/j.jmb.2004.02.002. [DOI] [PubMed] [Google Scholar]
- 2.Peng Z, Mizianty MJ, Kurgan L. Genome-scale prediction of proteins with long intrinsically disordered regions. Proteins. 2014;82(1):145–158. doi: 10.1002/prot.24348. [DOI] [PubMed] [Google Scholar]
- 3.Liu J, Faeder JR, Camacho CJ. Toward a quantitative theory of intrinsically disordered proteins and their function. Proc Natl Acad Sci USA. 2009;106(47):19819–19823. doi: 10.1073/pnas.0907710106. [DOI] [PMC free article] [PubMed] [Google Scholar]
- 4.Vavouri T, Semple JI, Garcia-Verdugo R, Lehner B. Intrinsic protein disorder and interaction promiscuity are widely associated with dosage sensitivity. Cell. 2009;138(1):198–208. doi: 10.1016/j.cell.2009.04.029. [DOI] [PubMed] [Google Scholar]
- 5.Forman-Kay JD, Mittag T. From sequence and forces to structure, function, and evolution of intrinsically disordered proteins. Structure. 2013;21(9):1492–1499. doi: 10.1016/j.str.2013.08.001. [DOI] [PMC free article] [PubMed] [Google Scholar]
- 6.Tompa P, Davey NE, Gibson TJ, Babu MM. A million peptide motifs for the molecular biologist. Mol Cell. 2014;55(2):161–169. doi: 10.1016/j.molcel.2014.05.032. [DOI] [PubMed] [Google Scholar]
- 7.Schlessinger A, et al. Protein disorder--A breakthrough invention of evolution? Curr Opin Struct Biol. 2011;21(3):412–418. doi: 10.1016/j.sbi.2011.03.014. [DOI] [PubMed] [Google Scholar]
- 8.Moesa HA, Wakabayashi S, Nakai K, Patil A. Chemical composition is maintained in poorly conserved intrinsically disordered regions and suggests a means for their classification. Mol Biosyst. 2012;8(12):3262–3273. doi: 10.1039/c2mb25202c. [DOI] [PubMed] [Google Scholar]
- 9.de la Chaux N, Messer PW, Arndt PF. DNA indels in coding regions reveal selective constraints on protein evolution in the human lineage. BMC Evol Biol. 2007;7:191. doi: 10.1186/1471-2148-7-191. [DOI] [PMC free article] [PubMed] [Google Scholar]
- 10.Nido GS, Méndez R, Pascual-García A, Abia D, Bastolla U. Protein disorder in the centrosome correlates with complexity in cell types number. Mol Biosyst. 2012;8(1):353–367. doi: 10.1039/c1mb05199g. [DOI] [PubMed] [Google Scholar]
- 11.Light S, Sagit R, Ekman D, Elofsson A. Long indels are disordered: A study of disorder and indels in homologous eukaryotic proteins. Biochim Biophys Acta. 2013;1834(5):890–897. doi: 10.1016/j.bbapap.2013.01.002. [DOI] [PubMed] [Google Scholar]
- 12.Tóth-Petróczy A, Tawfik DS. Protein insertions and deletions enabled by neutral roaming in sequence space. Mol Biol Evol. 2013;30(4):761–771. doi: 10.1093/molbev/mst003. [DOI] [PubMed] [Google Scholar]
- 13.Khan T, Douglas GM, Patel P, Nguyen Ba AN, Moses AM. Polymorphism analysis reveals reduced negative selection and elevated rate of insertions and deletions in intrinsically disordered protein regions. Genome Biol Evol. 2015;7(6):1815–1826. doi: 10.1093/gbe/evv105. [DOI] [PMC free article] [PubMed] [Google Scholar]
- 14.Brown CJ, et al. Evolutionary rate heterogeneity in proteins with long disordered regions. J Mol Evol. 2002;55(1):104–110. doi: 10.1007/s00239-001-2309-6. [DOI] [PubMed] [Google Scholar]
- 15.Beltrao P, Serrano L. Comparative genomics and disorder prediction identify biologically relevant SH3 protein interactions. PLOS Comput Biol. 2005;1(3):e26. doi: 10.1371/journal.pcbi.0010026. [DOI] [PMC free article] [PubMed] [Google Scholar]
- 16.Nguyen Ba AN, et al. Proteome-wide discovery of evolutionary conserved sequences in disordered regions. Sci Signal. 2012;5(215):rs1. doi: 10.1126/scisignal.2002515. [DOI] [PMC free article] [PubMed] [Google Scholar]
- 17.Davey NE, et al. Attributes of short linear motifs. Mol Biosyst. 2012;8(1):268–281. doi: 10.1039/c1mb05231d. [DOI] [PubMed] [Google Scholar]
- 18.Moses AM, Liku ME, Li JJ, Durbin R. Regulatory evolution in proteins by turnover and lineage-specific changes of cyclin-dependent kinase consensus sites. Proc Natl Acad Sci USA. 2007;104(45):17713–17718. doi: 10.1073/pnas.0700997104. [DOI] [PMC free article] [PubMed] [Google Scholar]
- 19.Holt LJ, et al. Global analysis of Cdk1 substrate phosphorylation sites provides insights into evolution. Science. 2009;325(5948):1682–1686. doi: 10.1126/science.1172867. [DOI] [PMC free article] [PubMed] [Google Scholar]
- 20.Beltrao P, et al. Systematic functional prioritization of protein posttranslational modifications. Cell. 2012;150(2):413–425. doi: 10.1016/j.cell.2012.05.036. [DOI] [PMC free article] [PubMed] [Google Scholar]
- 21.Ludwig MZ, Bergman C, Patel NH, Kreitman M. Evidence for stabilizing selection in a eukaryotic enhancer element. Nature. 2000;403(6769):564–567. doi: 10.1038/35000615. [DOI] [PubMed] [Google Scholar]
- 22.Bergman CM, Kreitman M. Analysis of conserved noncoding DNA in Drosophila reveals similar constraints in intergenic and intronic sequences. Genome Res. 2001;11(8):1335–1345. doi: 10.1101/gr.178701. [DOI] [PubMed] [Google Scholar]
- 23.Moses AM, Landry CR. Moving from transcriptional to phospho-evolution: Generalizing regulatory evolution? Trends Genet. 2010;26(11):462–467. doi: 10.1016/j.tig.2010.08.002. [DOI] [PubMed] [Google Scholar]
- 24.Beltrao P, Bork P, Krogan NJ, van Noort V. Evolution and functional cross-talk of protein post-translational modifications. Mol Syst Biol. 2013;9:714. doi: 10.1002/msb.201304521. [DOI] [PMC free article] [PubMed] [Google Scholar]
- 25.Ludwig MZ, Patel NH, Kreitman M. Functional analysis of eve stripe 2 enhancer evolution in Drosophila: Rules governing conservation and change. Development. 1998;125(5):949–958. doi: 10.1242/dev.125.5.949. [DOI] [PubMed] [Google Scholar]
- 26.Charlesworth B. Stabilizing selection, purifying selection, and mutational bias in finite populations. Genetics. 2013;194(4):955–971. doi: 10.1534/genetics.113.151555. [DOI] [PMC free article] [PubMed] [Google Scholar]
- 27.Wray GA. The evolutionary significance of cis-regulatory mutations. Nat Rev Genet. 2007;8(3):206–216. doi: 10.1038/nrg2063. [DOI] [PubMed] [Google Scholar]
- 28.Landry CR, Freschi L, Zarin T, Moses AM. Turnover of protein phosphorylation evolving under stabilizing selection. Front Genet. 2014;5(July):245. doi: 10.3389/fgene.2014.00245. [DOI] [PMC free article] [PubMed] [Google Scholar]
- 29.Jansen G, Bühring F, Hollenberg CP, Ramezani Rad M. Mutations in the SAM domain of STE50 differentially influence the MAPK-mediated pathways for mating, filamentous growth and osmotolerance in Saccharomyces cerevisiae. Mol Genet Genomics. 2001;265(1):102–117. doi: 10.1007/s004380000394. [DOI] [PubMed] [Google Scholar]
- 30.Truckses DM, Bloomekatz JE, Thorner J. The RA domain of Ste50 adaptor protein is required for delivery of Ste11 to the plasma membrane in the filamentous growth signaling pathway of the yeast Saccharomyces cerevisiae. Mol Cell Biol. 2006;26(3):912–928. doi: 10.1128/MCB.26.3.912-928.2006. [DOI] [PMC free article] [PubMed] [Google Scholar]
- 31.Tatebayashi K, et al. Adaptor functions of Cdc42, Ste50, and Sho1 in the yeast osmoregulatory HOG MAPK pathway. EMBO J. 2006;25(13):3033–3044. doi: 10.1038/sj.emboj.7601192. [DOI] [PMC free article] [PubMed] [Google Scholar]
- 32.Hao N, Zeng Y, Elston TC, Dohlman HG. Control of MAPK specificity by feedback phosphorylation of shared adaptor protein Ste50. J Biol Chem. 2008;283(49):33798–33802. doi: 10.1074/jbc.C800179200. [DOI] [PMC free article] [PubMed] [Google Scholar]
- 33.Yamamoto K, Tatebayashi K, Tanaka K, Saito H. Dynamic control of yeast MAP kinase network by induced association and dissociation between the Ste50 scaffold and the Opy2 membrane anchor. Mol Cell. 2010;40(1):87–98. doi: 10.1016/j.molcel.2010.09.011. [DOI] [PubMed] [Google Scholar]
- 34.English JG, et al. MAPK feedback encodes a switch and timer for tunable stress adaptation in yeast. Sci Signal. 2015;8(359):ra5. doi: 10.1126/scisignal.2005774. [DOI] [PMC free article] [PubMed] [Google Scholar]
- 35.Beltrao P, et al. Evolution of phosphoregulation: Comparison of phosphorylation patterns across yeast species. PLoS Biol. 2009;7(6):e1000134. doi: 10.1371/journal.pbio.1000134. [DOI] [PMC free article] [PubMed] [Google Scholar]
- 36.Nguyen Ba AN, Moses AM. Evolution of characterized phosphorylation sites in budding yeast. Mol Biol Evol. 2010;27(9):2027–2037. doi: 10.1093/molbev/msq090. [DOI] [PubMed] [Google Scholar]
- 37.Freschi L, Courcelles M, Thibault P, Michnick SW, Landry CR. Phosphorylation network rewiring by gene duplication. Mol Syst Biol. 2011;7(504):504. doi: 10.1038/msb.2011.43. [DOI] [PMC free article] [PubMed] [Google Scholar]
- 38.Smolka MB, Albuquerque CP, Chen SH, Zhou H. Proteome-wide identification of in vivo targets of DNA damage checkpoint kinases. Proc Natl Acad Sci USA. 2007;104(25):10364–10369. doi: 10.1073/pnas.0701622104. [DOI] [PMC free article] [PubMed] [Google Scholar]
- 39.Albuquerque CP, et al. A multidimensional chromatography technology for in-depth phosphoproteome analysis. Mol Cell Proteomics. 2008;7(7):1389–1396. doi: 10.1074/mcp.M700468-MCP200. [DOI] [PMC free article] [PubMed] [Google Scholar]
- 40.Gnad F, et al. High-accuracy identification and bioinformatic analysis of in vivo protein phosphorylation sites in yeast. Proteomics. 2009;9(20):4642–4652. doi: 10.1002/pmic.200900144. [DOI] [PubMed] [Google Scholar]
- 41.Soulard A, et al. The rapamycin-sensitive phosphoproteome reveals that TOR controls protein kinase A toward some but not all substrates. Mol Biol Cell. 2010;21(19):3475–3486. doi: 10.1091/mbc.E10-03-0182. [DOI] [PMC free article] [PubMed] [Google Scholar]
- 42.Bodenmiller B, et al. Phosphoproteomic analysis reveals interconnected system-wide responses to perturbations of kinases and phosphatases in yeast. Sci Signal. 2010;3(153):rs4. doi: 10.1126/scisignal.2001182. [DOI] [PMC free article] [PubMed] [Google Scholar]
- 43.Kanshin E, Bergeron-Sandoval L-P, Isik SS, Thibault P, Michnick SW. A cell-signaling network temporally resolves specific versus promiscuous phosphorylation. Cell Reports. 2015;10(7):1202–1214. doi: 10.1016/j.celrep.2015.01.052. [DOI] [PubMed] [Google Scholar]
- 44.Hagen DC, McCaffrey G, Sprague GF., Jr Pheromone response elements are necessary and sufficient for basal and pheromone-induced transcription of the FUS1 gene of Saccharomyces cerevisiae. Mol Cell Biol. 1991;11(6):2952–2961. doi: 10.1128/mcb.11.6.2952. [DOI] [PMC free article] [PubMed] [Google Scholar]
- 45.Elion EA, Satterberg B, Kranz JE. FUS3 phosphorylates multiple components of the mating signal transduction cascade: Evidence for STE12 and FAR1. Mol Biol Cell. 1993;4(5):495–510. doi: 10.1091/mbc.4.5.495. [DOI] [PMC free article] [PubMed] [Google Scholar]
- 46.Ferrigno P, Posas F, Koepp D, Saito H, Silver PA. Regulated nucleo/cytoplasmic exchange of HOG1 MAPK requires the importin beta homologs NMD5 and XPO1. EMBO J. 1998;17(19):5606–5614. doi: 10.1093/emboj/17.19.5606. [DOI] [PMC free article] [PubMed] [Google Scholar]
- 47.Strickfaden SC, et al. A mechanism for cell-cycle regulation of MAP kinase signaling in a yeast differentiation pathway. Cell. 2007;128(3):519–531. doi: 10.1016/j.cell.2006.12.032. [DOI] [PMC free article] [PubMed] [Google Scholar]
- 48.Uversky VN. A decade and a half of protein intrinsic disorder: Biology still waits for physics. Protein Sci. 2013;22(6):693–724. doi: 10.1002/pro.2261. [DOI] [PMC free article] [PubMed] [Google Scholar]
- 49.Mittag T, Kay LE, Forman-Kay JD. Protein dynamics and conformational disorder in molecular recognition. J Mol Recognit. 2010;23(2):105–116. doi: 10.1002/jmr.961. [DOI] [PubMed] [Google Scholar]
- 50.Mao AH, Crick SL, Vitalis A, Chicoine CL, Pappu RV. Net charge per residue modulates conformational ensembles of intrinsically disordered proteins. Proc Natl Acad Sci USA. 2010;107(18):8183–8188. doi: 10.1073/pnas.0911107107. [DOI] [PMC free article] [PubMed] [Google Scholar]
- 51.Müller-Späth S, et al. From the cover: Charge interactions can dominate the dimensions of intrinsically disordered proteins. Proc Natl Acad Sci USA. 2010;107(33):14609–14614. doi: 10.1073/pnas.1001743107. [DOI] [PMC free article] [PubMed] [Google Scholar]
- 52.Lande R. Natural selection and random genetic drift in phenotypic evolution. Evolution. 1976;30(2):314–334. doi: 10.1111/j.1558-5646.1976.tb00911.x. [DOI] [PubMed] [Google Scholar]
- 53.Hansen TF. Stabilizing selection and the comparative analysis of adaptation. Evolution. 1997;51(5):1341–1351. doi: 10.1111/j.1558-5646.1997.tb01457.x. [DOI] [PubMed] [Google Scholar]
- 54.Bedford T, Hartl DL. Optimization of gene expression by natural selection. Proc Natl Acad Sci USA. 2009;106(4):1133–1138. doi: 10.1073/pnas.0812009106. [DOI] [PMC free article] [PubMed] [Google Scholar]
- 55.Felsenstein J. Maximum-likelihood estimation of evolutionary trees from continuous characters. Am J Hum Genet. 1973;25(5):471–492. [PMC free article] [PubMed] [Google Scholar]
- 56.Nguyen Ba AN, et al. Detecting functional divergence after gene duplication through evolutionary changes in posttranslational regulatory sequences. PLOS Comput Biol. 2014;10(12):e1003977. doi: 10.1371/journal.pcbi.1003977. [DOI] [PMC free article] [PubMed] [Google Scholar]
- 57.Soskine M, Tawfik DS. Mutational effects and the evolution of new protein functions. Nat Rev Genet. 2010;11(8):572–582. doi: 10.1038/nrg2808. [DOI] [PubMed] [Google Scholar]
- 58.Daughdrill GW, Narayanaswami P, Gilmore SH, Belczyk A, Brown CJ. Dynamic behavior of an intrinsically unstructured linker domain is conserved in the face of negligible amino acid sequence conservation. J Mol Evol. 2007;65(3):277–288. doi: 10.1007/s00239-007-9011-2. [DOI] [PubMed] [Google Scholar]
- 59.Lemas D, Lekkas P, Ballif BA, Vigoreaux JO. Intrinsic disorder and multiple phosphorylations constrain the evolution of the flightin N-terminal region. J Proteomics. 2016;135:191–200. doi: 10.1016/j.jprot.2015.12.006. [DOI] [PMC free article] [PubMed] [Google Scholar]
- 60.Pearlman SM, Serber Z, Ferrell JE., Jr A mechanism for the evolution of phosphorylation sites. Cell. 2011;147(4):934–946. doi: 10.1016/j.cell.2011.08.052. [DOI] [PMC free article] [PubMed] [Google Scholar]
- 61.Das RK, Huang Y, Phillips AH, Kriwacki RW, Pappu RV. Cryptic sequence features within the disordered protein p27 Kip1 regulate cell cycle signaling. Proc Natl Acad Sci USA. 2016;113(20):5616–5621. doi: 10.1073/pnas.1516277113. [DOI] [PMC free article] [PubMed] [Google Scholar]
- 62.Pak CW, et al. Sequence determinants of intracellular phase separation by complex coacervation of a disordered protein. Mol Cell. 2016;63(1):72–85. doi: 10.1016/j.molcel.2016.05.042. [DOI] [PMC free article] [PubMed] [Google Scholar]
- 63.Beaulieu JM, Jhwueng DC, Boettiger C, O’Meara BC. Modeling stabilizing selection: Expanding the Ornstein-Uhlenbeck model of adaptive evolution. Evolution. 2012;66(8):2369–2383. doi: 10.1111/j.1558-5646.2012.01619.x. [DOI] [PubMed] [Google Scholar]
- 64.Cooper N, Thomas GH, Venditti C, Meade A, Freckleton RP. A cautionary note on the use of Ornstein Uhlenbeck models in macroevolutionary studies. Biol J Linn Soc Lond. 2016;118(1):64–77. doi: 10.1111/bij.12701. [DOI] [PMC free article] [PubMed] [Google Scholar]
- 65.Edgar RC. MUSCLE: Multiple sequence alignment with high accuracy and high throughput. Nucleic Acids Res. 2004;32(5):1792–1797. doi: 10.1093/nar/gkh340. [DOI] [PMC free article] [PubMed] [Google Scholar]
- 66.Byrne KP, Wolfe KH. The Yeast Gene Order Browser: Combining curated homology and syntenic context reveals gene fate in polyploid species. Genome Res. 2005;15(10):1456–1461. doi: 10.1101/gr.3672305. [DOI] [PMC free article] [PubMed] [Google Scholar]
- 67.Waterhouse AM, Procter JB, Martin DMA, Clamp M, Barton GJ. Jalview Version 2--A multiple sequence alignment editor and analysis workbench. Bioinformatics. 2009;25(9):1189–1191. doi: 10.1093/bioinformatics/btp033. [DOI] [PMC free article] [PubMed] [Google Scholar]
- 68.Jones DT, Cozzetto D. DISOPRED3: Precise disordered region predictions with annotated protein-binding activity. Bioinformatics. 2015;31(6):857–863. doi: 10.1093/bioinformatics/btu744. [DOI] [PMC free article] [PubMed] [Google Scholar]
- 69.Suyama M, Torrents D, Bork P. PAL2NAL: Robust conversion of protein sequence alignments into the corresponding codon alignments. Nucleic Acids Res. 2006;34(Web Server Issue):609–612. doi: 10.1093/nar/gkl315. [DOI] [PMC free article] [PubMed] [Google Scholar]
- 70.Yang Z. PAML 4: Phylogenetic analysis by maximum likelihood. Mol Biol Evol. 2007;24(8):1586–1591. doi: 10.1093/molbev/msm088. [DOI] [PubMed] [Google Scholar]
- 71.Maeda T, Takekawa M, Saito H. Activation of yeast PBS2 MAPKK by MAPKKKs or by binding of an SH3-containing osmosensor. Science. 1995;269(5223):554–558. doi: 10.1126/science.7624781. [DOI] [PubMed] [Google Scholar]
- 72.Gibson DG, et al. Enzymatic assembly of DNA molecules up to several hundred kilobases. Nat Methods. 2009;6(5):343–345. doi: 10.1038/nmeth.1318. [DOI] [PubMed] [Google Scholar]
- 73.Schiestl RHR, Gietz RDR. High efficiency transformation of intact yeast cells using single stranded nucleic acids as a carrier. Curr Genet. 1989;16(5-6):339–346. doi: 10.1007/BF00340712. [DOI] [PubMed] [Google Scholar]
- 74.Storici F, Lewis LK, Resnick MA. In vivo site-directed mutagenesis using oligonucleotides. Nat Biotechnol. 2001;19(8):773–776. doi: 10.1038/90837. [DOI] [PubMed] [Google Scholar]
- 75.Boeke JD, Trueheart J, Natsoulis G, Fink GR. 5-Fluoroorotic acid as a selective agent in yeast molecular genetics. Methods Enzymol. 1987;154:164–175. doi: 10.1016/0076-6879(87)54076-9. [DOI] [PubMed] [Google Scholar]
- 76.Schneider CA, Rasband WS, Eliceiri KW. NIH Image to ImageJ: 25 years of image analysis. Nat Methods. 2012;9(7):671–675. doi: 10.1038/nmeth.2089. [DOI] [PMC free article] [PubMed] [Google Scholar]
- 77.Fraley C, Raftery AE, Murphy TB, Scrucca L. 2012. mclust Version 4 for R: Normal Mixture Modeling for Model-Based Clustering, Classification, and Density Estimation (University of Washington, Seattle), Tech Rep 597.
- 78.Pemberton LF. Preparation of yeast cells for live-cell imaging and indirect immunofluorescence. Methods Mol Biol. 2014;1205:79–90. doi: 10.1007/978-1-4939-1363-3_6. [DOI] [PubMed] [Google Scholar]
- 79.Handfield LF, Chong YT, Simmons J, Andrews BJ, Moses AM. Unsupervised clustering of subcellular protein expression patterns in high-throughput microscopy images reveals protein complexes and functional relationships between proteins. PLOS Comput Biol. 2013;9(6):e1003085. doi: 10.1371/journal.pcbi.1003085. [DOI] [PMC free article] [PubMed] [Google Scholar]
- 80.Breslow DK, et al. A comprehensive strategy enabling high-resolution functional analysis of the yeast genome. Nat Methods. 2008;5(8):711–718. doi: 10.1038/nmeth.1234. [DOI] [PMC free article] [PubMed] [Google Scholar]
- 81.Hietpas RT, Jensen JD, Bolon DN. Experimental illumination of a fitness landscape. Proc Natl Acad Sci USA. 2011;108(19):7896–7901. doi: 10.1073/pnas.1016024108. [DOI] [PMC free article] [PubMed] [Google Scholar]
- 82.Hegreness M, Shoresh N, Hartl D, Kishony R. An equivalence principle for the incorporation of favorable mutations in asexual populations. Science. 2006;311(5767):1615–1617. doi: 10.1126/science.1122469. [DOI] [PubMed] [Google Scholar]
- 83.Chao L, Cox EC. Competition between high and low mutating strains of Escherichia coli. Evolution. 1983;37(1):125. doi: 10.1111/j.1558-5646.1983.tb05521.x. [DOI] [PubMed] [Google Scholar]
- 84.Xiao N, Cao DS, Zhu MF, Xu QS. protr/ProtrWeb: R package and web server for generating various numerical representation schemes of protein sequences. Bioinformatics. 2015;31(11):1857–1859. doi: 10.1093/bioinformatics/btv042. [DOI] [PubMed] [Google Scholar]
- 85.Osorio D, Rondon-Villarreal P, Torres R. Peptides: A package for data mining of antimicrobial peptides. R J. 2015;7(1):4–14. [Google Scholar]
- 86.Gupta NT, et al. Change-O: A toolkit for analyzing large-scale B cell immunoglobulin repertoire sequencing data. Bioinformatics. 2015;31(20):3356–3358. doi: 10.1093/bioinformatics/btv359. [DOI] [PMC free article] [PubMed] [Google Scholar]
- 87.Butler MA, King AA. Phylogenetic comparative analysis: A modeling approach for adaptive evolution. Am Nat. 2004;164(6):683–695. doi: 10.1086/426002. [DOI] [PubMed] [Google Scholar]
- 88.Harmon LJ, Weir JT, Brock CD, Glor RE, Challenger W. GEIGER: Investigating evolutionary radiations. Bioinformatics. 2008;24(1):129–131. doi: 10.1093/bioinformatics/btm538. [DOI] [PubMed] [Google Scholar]
- 89.Giaever G, et al. Functional profiling of the Saccharomyces cerevisiae genome. Nature. 2002;418(6896):387–391. doi: 10.1038/nature00935. [DOI] [PubMed] [Google Scholar]


