

Abstract
A single-cell optical clearing methodology is developed and demonstrated in hyperspectral dark-field microscopy (HSDFM) and imaging of plasmonic nanoprobes. Our strategy relies on a combination of delipidation and refractive index (RI) matching with highly biocompatible and affordable agents. Before applying the RI-matching solution, the delipidation step by using a mild solvent effectively eliminates those high-density, lipid-enriched granular structures which emit strong scattering. Upon the treatments, the background scattering from cellular organelles could be repressed to a negligible level while the scattering signals from plasmonic nanomaterials increase, leading to a significant improvement on the signal-to-noise ratio (SNR). With this method established, the versatility and applicability of HSDFM are greatly enhanced. In our demonstration, quantitative mapping of the dimerization-activated receptor kinase HER2 is achieved in a single cancer cell by non-fluorescent approach. High-resolution imaging for oncogenic mRNAs, namely ER, PR, and HER2, is performed with single labeling. More importantly, in situ multiplex detection of mRNA and protein is made possible by HSDFM since it overcomes the difficulties of complex staining and signal imbalance suffered by the conventional optical imaging. Last, we show that with optical clearing, characterization of intracellularly grown gold particulates is accomplished at an unprecedented spatiotemporal resolution. Taken together, the uniqueness of optical clearing and HSDFM is expected to open ample avenues for single-cell studies and biomedical engineering.
Keywords: optical clearing, hyperspectral dark-field microscopy, single-molecule detection, plasmonic nanomaterials, single-cell analysis
Graphical abstract
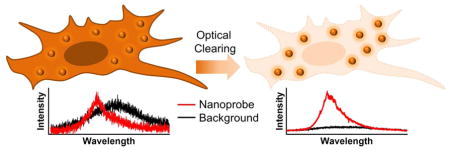
Adapting light-matter interaction is crucial to improving the spatiotemporal resolution and contrast for optical imaging. Scattering, due to RI mismatch between material interfaces, constitutes a major source of noise and the signal-weakening mechanism when imaging heterogeneous biological specimens. According to the Mie theory, scattering becomes dominant if the radius of a spherical particle is on the same order of wavelength as the incident light, i.e., from 5 nm to 50 μm.1 As a 300–700 nm illumination source is commonly implemented in an optical microscope, this spatial range is exactly the size of most intracellular organelles and extracellular matrix molecules. Hence, optical clearing agents and methods are needed to minimize the RI differences and suppress the unwanted background scattering (Fig. 1A).2–4
Figure 1.

Scattering sources inside a mammalian cell and the influence of environmental RI on scattering intensity. (A) Concept of single-cell optical clearing. (B) RI values of the major components in a cell. (C) For a given spherical organelle with a RI of 1.40, its light scattering phase functions within different environmental RIs are simulated. (D) Dark-field images of single cells within different RI-matching solutions (exposure time 0.3 s).
So far, a number of optical clearing protocols have been attempted. In principle, two major mechanisms were employed to reduce the undesired scattering: 1) use of a penetrating high-RI fluid (e.g., glycerol, urea, or fructose) to homogenize intracellular substances; 2) removal of the highly condensed lipid-containing organelles and fiber structures from bulky tissues.3, 5, 6 Basically, optical clearing requires the treatments not to impact the quantity and location of biomolecules within the specimen, such as important nucleic acids and proteins. It is highly preferable that the tertiary or higher-order conformation can be well maintained after clearing treatments. To date few optical clearing agents and methodologies, including BABB,7 Scale,8 ClearT,9 SeeDB,10 CLARITY,6 CUBIC,11 and iDISCO,12 have been designed to enhance the imaging quality. However, most of the protocols were demonstrated using coarse tissue samples and optimized for fluorescence imaging.
Compared to fluorescence microscopy, HSDFM overcomes a multitude of disadvantages such as photo-bleaching and photo-damage (a detailed comparison is summarized in the Supplementary Table 1). Combining plasmonic nanomaterials with HSDFM provides us with tremendous opportunities to quantitate biomolecules and dynamic events at the single-cell level.13–17 However, considering the fact that conventional dark-field imaging non-selectively utilizes natural scattering as its source of contrast, the desired signal from a molecule-targeting nanoprobe, when introduced into biological samples, would be buried in the background.18 Even equipped with a hyper-spectrometer that can characterize the scattering fingerprint, to a great extent the imaging SNR of HSDFM is subjected to severe background interference. In the present work, a simple, fast, and cost-effective optical clearing method is demonstrated to bolster the SNR of HSDFM based on biomolecule-targeting nanoparticles, without losing the primary cell content of nucleic acids and proteins. Our procedure, consisting of a moderate delipidation step and a RI matching step, has shown superiority in revealing the finer structures within a single cell. Subsequent to labeling, optical clearing, imaging, and post-processing, the localization, quantity, and stoichiometry of interested biomarkers can be precisely determined. With this single-cell optical clearing protocol established, quantitative imaging of cell surface markers and cytoplasmic mRNAs was performed, and the intracellular formation of gold particulates was monitored.
RESULTS
RI matching for HSDFM using plasmonic nanomaterials
The mismatch of RIs between different cellular components and the immersion medium constitutes the main source of scattering that can generate a plethora of problems including background scattering, spherical aberration-like blur, and loss-of-signal during optical imaging. Therefore homogenizing the RIs is a pressing task for high-resolution optical microscopy. Regular culture medium (without phenol red) and buffered saline (e.g., phosphate buffered saline PBS) have a RI of around 1.33, whereas the cellular ground matter, nucleus, and most organelles have a RI of 1.37–1.41 (Fig. 1B). When assuming an intracellular organelle as a 500 nm spherical particle with a uniform RI of 1.40, matching its surrounding RI to a similar value can significantly reduce the scattering intensity. It can be clearly seen from Fig. 1C that, as the difference of RIs decreases, the constraint of electromagnetic field for the organelle becomes stronger and the directional scattering angle is reduced, indicating that less scattering would be collected by the objective lens. Experimentally, we validates that compared to the low-RI PBS and other high-RI solutions (i.e., 50% glycerol and 60% sucrose), the ScaleA2 solution (RI = 1.39) reduces the cellular scattering to the greatest extent when observed with a dark-field microscopic observation (Fig. 1D). In the ScaleA2 treated cells, only few granular structures were seen in the cytoplasm after 6 hours of treatment, whereas the traditional clearing agents – glycerol and sucrose – cannot fully suppress the scattering due to the high viscosity-caused slow penetration. As typical granular organelles in a mammalian cell, mitochondria and ribosome contain a moderate concentration of biomolecules, thus having a narrow range of RI (1.38–1.41).19 Hence, we speculated that the unmatched intracellular scatterers by ScaleA2 were organelles with a higher density of contents, such as condensed lipid droplets, late endosomes, and lysosomes.
Featuring the local surface plasmon resonance (LSPR)-induced strong scattering, gold nanoparticles (GNPs) have been extensively exploited as an imaging contrast agent in biomedical research. However, the scattering mechanism of GNPs is physically different from dielectric biomolecules. Due to the resonant interaction between the free electrons in a GNP and the incident photons, the electromagnetic field on the GNP surface could be strongly enhanced and localized, and the electromagnetic oscillations are quite sensitive to minute changes across the boundary, such as differential RIs. In order to obtain high-quality images through the improvement of SNR by optical clearing, it is necessary to understand the influence of varying environmental RI on both GNPs and intracellular scatterers. Hence, we first turned to study the theoretical mechanisms and then exploited the relevant implications for bioimaging.
As shown in Fig. 2, the far-field scattering cross section of an intracellular granule increases sharply as its size increases. When its size is over 500 nm, the far-field scattering cross section within a low RI environment is even larger than that of a 40 nm GNP, which supports the importance of optical clearing to eliminate the scattering noise from intracellular organelles. When inspecting the relation between the far-field scattering cross section and environmental RI, it is interesting to note that the scattering response of GNPs is opposite to that of biological granules. As environmental RI increases, the far-field scattering cross section of biological granules decreases whereas the scattering of GNP is boosted, therefore bringing about a benefit to enhance the SNR for dark-field imaging. These theoretical explorations demonstrate that optical clearing can substantially suppress the background noise from intracellular organelles and in the meantime increase the signal from GNP probes.
Figure 2.

Simulated far-field scattering cross sections of 40 nm GNP and lipid-containing granule with different sizes in varied RIs. Simulation was performed with CST Studio Suite 2014 software. A plane wave incident source with linear polarization in the range of 330 to 660 THz was used for calculation.
Delipidation facilitates the removal of high-density lipid-containing scatterers
In a typical bright-field image, the high-density scattering particles are perceived as dark spots, corresponding to bright spots in a dark-field image (Supplementary Fig. 1). Taking advantage of the label-free stimulated Raman scattering (SRS) imaging, we further identified that the strong light scatterers are rich in both lipid (Raman peak shift of the CH3 stretching vibration at 2845 cm−1) and protein (Raman peak shift of the CH2 stretching vibration at 2950 cm−1).20 Therefore we proposed that a proper, mild delipidation treatment prior to traditional optical clearing would not only decrease the optical density of the granular structures but also facilitate diffusion of the RI-matching solution. Although most long-chain fatty acids in cells are neutral, a considerable number of membrane lipids such as phospholipids are amphipathic, with both non-polar and polar ends (Fig. 3A). Considering the diversity of lipid contents in mammalian cells, a number of solvent agents can be used for delipidation. Isopropyl alcohol (IPA) is a biocompatible, non-toxic solvent with a medium dielectric constant (17.9), which can dissolve a wide range of non-polar compounds including lipids which afterwards evaporate quickly. Despite the fact that other common solvents such as ethanol and dimethyl sulfoxide (DMSO) are able to remove lipid content from cells to achieve similar effects, we choose IPA because it is extensively used as a preservative for biological specimens and better fitted with our methodology (Fig. 3B). After a quick delipidation by IPA, the originally strong scattering speckles were invisible and thus the quality of RI-matching optical clearing was significantly improved as shown in Fig. 3C. Even with a much longer exposure time, the natural scattering from the cells per se was two orders lower in magnitude.
Figure 3.

Improvement of optical clearing by delipidation. (A) The common lipids (upper panel) forming high-density granular structures are revealed by SRS imaging (lower panel): 2950 cm−1, CH-stretching enriched in both protein and lipid; 2845 cm−1, CH2 vibration primarily enriched in lipid. An intensity threshold was preset to only show high-density lipid-containing granules. (B) Removal of the lipid content by several popular solvents is validated. (Scale bars: 10 μm) (C) Combination of delipidation with RI matching suppresses the cellular scattering to a negligible level (exposure time is indicated on each image;)
The key parameter determining the utility of an optical clearing method lies in the extent of damage it might impose onto the natural cell components. After the chemical removal of some lipids with IPA, herein we focused on evaluating the quality of nucleic acids and proteins. 4',6-diamidino-2-phenylindole (DAPI) and propidium iodide (PI) are popular DNA staining dyes but have different intercalation positions. To test the intactness of DNA double-strand helix after our clearing treatments, fluorescence imaging with DAPI and PI were conducted respectively, and the fluorescence intensities from each dye were not detrimentally influenced (Fig. 4A). Since IPA has dehydration effect and this would drive DNA into the A-DNA form that features a narrower and deeper major groove, more PI molecules would be incorporated into the same length of DNA under this circumstance, resulting in a slightly increased PI intensity after optical clearing. Next, HeLa cells transfected with nucleus-localized green fluorescent protein (Nuc-GFP) or membrane-localized GFP (CAAX-GFP) plasmid were assessed by fluorescence lifetime imaging microscopy (FLIM). The fluorescence lifetime of GFP is a robust measure of protein intactness and sensitive to conformational alterations, thus enabling us to evaluate the possible impact of the clearing treatments to cellular proteins. From the FLIM images, no significant changes were observed except a slight to moderate deformation of the cell morphology due to the loss of some membrane lipids (Fig. 4B). In comparison, when we optically cleared the cells with the conventional BABB agents, the cellular deformation and shift in the fluorescence lifetime of GFP were more drastic, especially for the membrane proteins (Supplementary Fig. 2). These experiments therefore proved the biocompatibility of our optical clearing strategy and paved the way for the detection of various biomarkers.
Figure 4.

Preservation of the primary nucleic acid and protein contents after optical clearing. (A) The integrity of nucleic acids was assessed by staining with DAPI (bound to the minor groove of DNA) and PI (intercalating into the major groove of DNA). The fluorescence images of both dyes were obtained before and after the clearing treatment. (B) Possible impacts to proteins upon our optical clearing agents (OCA) are reflected by monitoring the fluorescence lifetimes of transfected GFP proteins in nucleus and on cell membrane. (Scale bars: 10 μm) The histograms of fluorescence lifetime are provided.
Detection of membrane receptor proteins
Accurate determination of relevant surface markers in breast cancer is crucial for effective diagnosis and treatment. Human epidermal growth factor receptor 2 (HER2) is an important transmembrane receptor tyrosine kinase that triggers a signaling pathway for cell proliferation. Amplification or overexpression of HER2 is found in approximately 30% of breast cancer patients who are ideal candidates to receive targeted therapies such as Herceptin. As a key member in the epidermal growth factor family, HER2 proteins function through dimerization or oligomerization to induce autophosphorylation, a critical step to initiating over-proliferation and apoptosis-resistance in cancer cells.21 Hence, detection of HER2 clustering is as important as quantifying its expression level because that will provide additional information on the ratio of activated receptors.22 However, limited techniques are available to directly visualize the dimerization-activated HER2 proteins. Dark-field imaging with GNP-dependent HER2 immuno-labeling made it possible to distinguish HER2 nano-clusters in single cells conveniently.23 The closely coupled GNPs on cell surface due to the HER2 dimerization could lead to significant changes in the local plasmon resonance of probes, thus emitting spectrally shifted scattering signal compared to monomeric GNPs. In conjunction with single-cell optical clearing and hyperspectral analysis, we further improved this methodology and were able to obtain more quantitative information on HER2. As shown in Fig. 5, not only the overall quantities of HER2 in different cell lines can be clearly compared but also the percentage of clustered receptors can be estimated based on the scattering peak in each pixel. Compared with MCF-7 and HeLa cells, SK-BR-3 cells express the highest level of HER2 (supported by fluorescence imaging in the Supplementary Fig. 3) and on the average about 52% of the receptors appear to be activated, inferred by the nanoprobe clustering. In the peak wavelength histogram, a bimodal distribution is noted, supporting the excellent spectral resolution of our method. In addition, the bimodal peaks are not sharply separated, indicating a dynamic, non-synchronous activation of HER2 proteins.
Figure 5.

Dark-field images of the transmembrane receptor protein HER2 in three cell lines. Histogram of scattering peaks was extracted from 15 HER2-positive SK-BR-3 cells. (Scale bars: 5 μm)
Detection of mRNAs
Aside from protein, quantification of important mRNA species is essential for numerous laboratory and biomedical applications. However, in situ hybridization with GNP-tagged nucleic acid probes is hard to perform as a long linear probe could be easily distorted by large GNPs. Optimization for the probe design, i.e., balancing the probe length and targeting specificity, therefore becomes crucial to achieve quantification of mRNA at the single-copy resolution.24 After testing different combinations, we found that labeling 40 nm GNPs with 50 nt probes can realize a high targeting efficiency with negligible non-specific binding. However, the crowded cytoplasmic environment contributed to a poor SNR for our probes (Fig. 6A). After applying the developed optical clearing method, the SNR was significantly improved from ~1 to over 5 (Fig. 6B). Due to this enhancement in SNR, the centroid of a single probe could be precisely determined, and the three key mRNAs – estrogen receptor (ER), progesterone receptor (PR), and HER2 could be unambiguously detected in a cervical cancer cell line (Fig. 6C). Hence, it is clear to compare the expression pattern of these genes, i.e., ER>PR>HER2 in the modified ER-expressing, PR-moderate, and HER2-negative HeLa cells (Supplementary Fig. 4). On the contrary, conventional fluorescence in situ hybridization needs each target mRNA to be labeled by multiple dyes with additional staining steps. Since these three biomarkers are involved in distinct pathways to promote gynecologic malignancies, an understanding of their relative transcription could facilitate a more effective way to guide targeted therapies.
Figure 6.

Detection of single mRNAs with improved SNR. (A) The relative intensity of a single nanoprobe to cell background in a cellular region of interest (ROI) before optical clearing. (B) After clearing treatments, the SNR in cytoplasmic ROI was substantially enhanced. (C) Three key mRNAs relating to gynecological cancers were individually imaged in ER-expressing HeLa cells. Centroid images were reconstructed from the raw images by hyperspectral processing. (Scale bars: 10 μm)
Multiplex Detection
Based on the singleplex detection of proteins and mRNAs, our next interest is in detection of a target at both levels because this could provide precise information on gene expression. In this regard, nanomaterials with distinct scattering patterns were needed and hence we chose gold nanorod (GNR) as the second label in addition to GNP.25 GNRs (44 nm × 16 nm) exhibited a peak scattering at 687 nm that can be readily distinguished from 40 nm GNPs by colorimetric separation (Fig. 7A) or spectral analysis (Fig. 7B). After dual-labeling, the HER2 protein and mRNA were simultaneously detected in SK-BR-3 cells without signal crosstalk (Fig. 7C). One thing should be noted is: considering the optical diffraction limit (~250 nm) and the size of used nanoprobes, a precise quantification for those highly expressed biomarkers, especially when multiple probes exist in a single pixel, needs rigorous spectral characterization to separate the signal composition.
Figure 7.

Multiplex detection of HER2 protein and mRNA in the same cell. (A) Mono-dispersed GNP and GNR probes were characterized under dark-field microscope. (B) Distinct scattering patterns of single probes were extracted as spectral fingerprints. (C) By setting an appropriate wavelength window, HER2 protein and mRNA were well detected in a dual-labeled cell. (Scale bars: 10 μm)
Characterization of intracellularly grown gold particulates
Reduction of chloroaurate ions to gold nanoparticles/clusters by living organisms has been observed and explored to be a potential way for biosensing and metal disposal.26–29 However, the detailed mechanism for the intracellular growth of gold particulates is largely unknown due to limited techniques for in situ characterization. Conventional methods, such as UV-vis spectroscopy and electron microscopy that demand harsh cell lysis, destructive excitation,26, 27 or specialized sample preparation, impede a fast acquisition of the particulate information, such as size, location, and stoichiometry. Our method enables a direct in situ approach to inspect this phenomenon within intact cells (Fig. 8A). A red shift in the scattering spectrum of formed gold particulate along with its stronger scattering intensity could reflect on the enlarging particle size (Fig. 8B). By analyzing the spectral histograms extracted from multiple cells, the time-course process (8–24 h) of the particulate growth could be inferred from the observation that the majority of scattering peaks were gradually moving to longer wavelengths (Fig. 8C–D). Interestingly, cells cultured in a low-nutrient medium gave rise to a larger size and quantity of formed particles, reflected by the further shift in the spectral histogram (Fig. 8D, right panel). Moreover, these particles were predominantly located in cytoplasm while in control cells the formed particles evenly distributed over the entire cell (Fig. 8D, inset images). We speculate that it could be due to a dysfunctional redox homeostasis or an increased glycolytic activity in cytoplasm under low-nutrient stress. In conclusion, our easy-to-apply strategy provides a better contrast and SNR for investigating various nanomaterials in single cells.
Figure 8.

Characterization of the intracellular reduction of chloroaurate ions to form particles and clusters. (A) A representative dark-field image of HeLa cells cultured in 1 mM chloroauric acid with scattered particulates formed. (B) Scattering spectra extracted from two distinct spots exhibit a red shift and enhanced intensity when the particle grows bigger. (C) At 8th and 16th hour, the overall distribution of peak scattering wavelengths was summarized from over 10 cells. (D) Influence of the low-nutrition stress on the growth rate of intracellular gold particles. Histograms of the peak scattering wavelengths are provided along with reconstructed spectral images.
DISCUSSION
The natural scattering of a single cell under optical microscope is mainly attributed to the mismatch of RIs between different substances, especially the strong Mie scattering from small-sized (< 1 μm), condensed granular structures. Although the intrinsic scattering from biological samples makes dark-field microscope a popular label-free imaging technique, the absence of specific labeling leads to a low discernibility and restricts its further expansion. In HSDFM, nanoprobes with a characteristic fingerprint of plasmonic resonance can be distinguished from the background to a better extent.15, 23, 30, 31 However, the strong scattering from intracellular granular structures could still alter or even overwhelm the probe signals.
In this work we present a cost-effective optical clearing method for labeling-based HSDFM. As matching the RIs in a biological specimen with high-RI agents, the scattering cross section of plasmonic nanomaterials (e.g., GNPs) can be favorably enhanced. For a normal dielectric sphere (e.g., a cellular organelle) with a size close to the incident wavelength, the scattering cross section according to the Mie theory can be described as32
| (1) |
where d is the diameter of the sphere, λ is the light wavelength, εd is the permittivity (square of dielectric RI) of the dielectric sphere, ε is the permittivity of the surrounding medium, and g is the scattering anisotropy factor, defined as the mean of the cosine function of the scattering angle. From Eq. (1), it can be concluded that matching the RI of surrounding medium to intracellular organelles will lead to a reduction in the scattering cross section. For GNPs whose size is much smaller than the incident wavelength (d ≪ λ), the scattering cross section can be simplified per the Mie theory and expressed as33
| (2) |
where εm is the permittivity of the GNP and expressed as34
| (3) |
where ε∞ is the high frequency dielectric constant (square of metallic RI), ω is the light frequency, ωp is the plasma frequency, and ωt is the damping frequency. The real part of the permittivity of GNP (Rεm) is negative in value, corresponding to the general local surface plasmon resonance and determining its position. Light scattering occurs when the incident photons oscillate with the electrons inside the gold atoms from which scattered photons are emitted. The number of emitted photons strongly depends on the boundary condition such as shape and refractive index. The negative value of Rεm defines the constraint of electrons at the interface between the surrounding medium and particle, and this intense localization of oscillation can lead to enhanced scattering. Therefore according to Eq. (2) the scattering cross section of GNP will increase with a higher surrounding RI, which is central to the research proposed in this effort.
In conventional optical clearing, another hurdle is the limited penetration efficiency of the applied agents (e.g., BABB or high-concentration glycerol or sucrose), most of which are extremely viscous. In comparison, the urea-based clearing solution can diffuse much faster. However, noted in our experiments, a considerable number of strong scatterers could remain in cells even after the clearing treatment for 24 hours. Considering the fact that lipid is the main structural component of intracellular granules, the optical clearing effect could be greatly improved if a mild solvent is applied prior to RI-matching treatment.11 While a plethora of solvents are able to achieve similar delipidation effects, we choose IPA in our recipe because it is relatively non-toxic, evaporates fast, and has a close RI (~1.38) to Scale solution. The extent of delipidation can be conveniently monitored by label-free SRS imaging to prevent massive structural damages. The successful removal of some lipids consequently lowers the optical density of intracellular granules and facilitates the rapid pervasion of RI-matching solution within the whole cell.
The potential applications of the developed single-cell optical clearing are significant since the methodology is biocompatible, and can substantially enhance the SNR for HSDFM using nanoprobes with a plasmonic fingerprint. As provided in this study, we have successfully demonstrated quantitative imaging of various biomolecules and processes with excellent resolutions. Detection of important mRNAs and protein biomarkers is the major focus of single-cell studies.35 For the transmembrane receptor protein HER2, our method can visualize the difference between monomeric and oligomerized proteins more clearly based on the distinct scattering spectra from GNP probes. With the cellular scattering greatly suppressed, the red-shifted scattering due to receptor activation could even be perceived by our naked eyes. We envision this capability to be a powerful technique for future biomedical research aimed to interrogate the activity of receptor kinases. Furthermore, we show that detection of mRNAs by in situ DNA-GNP hybridization could achieve single-copy resolution. With optical clearing, the SNR from GNPs in cytoplasm can be increased by at least 5–6 folds. This property renders our method an elegant alternative to fluorescence in situ hybridization in which each probe has to be tagged with multiple dye molecules, necessitating additional steps for signal amplification. In our experiments, a number of oncogenic mRNAs were imaged with a high contrast. More potently, we have achieved multiplex detection of mRNAs and proteins for a single gene, by using spectrally differentiable GNPs and GNRs. Given its ease of use, our method holds excellent promise in future clinical diagnostics and precision medicine. Besides the detection of biomarkers, we also proposed to understand the intracellular growth of gold particulates in a more straightforward manner rather than using traditional destructive ways. The in situ spectral characterization of the formed particles provided a unique route to inspect the reduction rate of Au3+ salt in a human cell. In a very preliminary attempt, we further implemented this optical clearing method to intact zebrafish embryo and human tissue slice (Supplementary Fig. 5–6), and we found that the SNR could also be substantially enhanced, giving an imaging depth of about 180 μm. To this end, our efforts to use HSDFM with plasmonic nanoprobes are anticipated to play an increasingly pivotal role in volumetric sectioning for single-cell analysis in the context of whole organism.
CONCLUSIONS
In this work we propose a new single-cell optical clearing strategy and provide a theoretical basis for its implementation with applications in quantitative screening. Our strategy involves highly biocompatible delipidation and RI-matching agents, featuring an excellent improvement on imaging SNR. By physical simulation and experimental validation, we show that reducing the difference in RIs amidst the mounting medium and the majority of cellular components would bring about an extra signal gain for plasmonic nanoprobes. This optical characteristic makes our methodology a standout from the existing protocols as nearly all the conventional optical clearing was designed for fluorescence imaging and the treatment would inevitably impact the quantum efficiency of fluorophores. For those high-density lipid-containing cellular granules that cannot be easily permeated by clearing agents, we apply a mild delipidation solvent to “erode” their optical density and the process is finely controlled by SRS imaging. The preservation of cellular nucleic acids and proteins after optical clearing enables us to quantitatively detect various biomarkers and biological events. Furthermore, we can implement this concept in complex specimens, such as embryos and tissue slices. Hence, we expect this easy-to-use, cost-effective protocol to further popularize the non-fluorescent dark-field imaging to enrich the toolbox for biomedical research.
METHODS AND MATERIALS
1. Simulation of scattering
3D finite-difference time-domain (FDTD) numerical simulation analysis was used to calculate the far-field angular scattering patterns of intracellular granules within different RIs (Fig. 1C), and the scattering cross sections of GNPs and intracellular granules of different size within different RIs (Fig. 2). To match the actual experiments, our model was designed as a 40 nm GNP or a dielectric sphere (RI = 1.40) immersed in infinite background material with different RIs, and Drude model was used to describe the dispersion of gold atoms. A plane wave incident source with linear polarization was applied to calculate the far field angular scattering pattern and scattering cross section. For calculating the far-field angular scattering pattern of intracellular granules, the frequency was set to 545 THz because it is the LSPR wavelength of a 40 nm GNP. The scattering cross sections of GNPs and intracellular granules of different sizes were simulated from 330 to 660 THz, corresponding to our experimental illumination source. A fast perfect boundary approximation mesh was used to eliminate staircase error at the interface for obtaining high accuracy in simulation. A far-field monitor was used to obtain the 3D radar cross section which subsequently determined the far-field angular scattering pattern. The broadband scattering response was extracted using a broadband far-field monitor in combination with the broadband far-field template, which allowed the direct extraction of the extinction cross section and scattering cross section. Since the simulation was calculated based on frequency, a “Mix 1D” result template was then used to convert the x-axis from frequency to wavelength domain in plot.
2. DNA-GNP probe preparation
Sodium citrate, Tris(2-carboxyethyl)phosphine hydrochloride (TCEP), chloroauric acid (HAuCl4) were obtained from Sigma. The targeting oligonucleotide DNA probes used in our experiments were purchased from Integrated DNA Technologies. The GNP colloid was prepared according to the reported method.36 To modify the obtained GNPs with DNA strands, 4 ml of GNP colloid was centrifuged at 8000 rpm for 10 min and the precipitate was re-dispersed in 0.5 ml of 0.6 μM DNA probe solution with the disulfide bonds deprotected by TCEP for 20 min before use. The mixture was kept in room temperature for 2 days, followed by slow injection of 50 μl 0.1 M phosphate buffer and 20 μl 3 M sodium chloride. Next day, the obtained solution was centrifuged and washed with distilled water three times. The prepared DNA-GNP probes were re-dispersed in 10 mM phosphate buffer and the concentration of the DNA-GNP probes was determined by UV-vis spectroscopy per literature.37 The probe sequences used in this study are listed in Table 1. The basic characterization of the DNA-GNP probes was provided in the Supplementary Fig. 7.
Table 1.
Probe sequences used for GNP-DNA conjugation and mRNA detection
| ER | 5’-TCCACCTAGTTTCACAGACACTAGAACAGGTCCTGAGCCACCTATACCAG-3’ |
| PR | 5’-CTGGCAGGGCCGAGGGAAGAGTAGCCCGTCCAGGGAGATAGGTATGGCCG-3’ |
| HER2 | 5’-TTCCTCTACCCTAAGTGACAGAACTGAGATGAGGTGGGGGAGTGGAGTCC-3’ |
3. Sample preparation and optical clearing
HeLa, MCF-7, and SK-BR-3 cells were routinely cultured in DMEM/F-12 medium supplemented with 10% fetal bovine serum, 1% antibiotics, and 5% CO2 at 37°C incubator. The HeLa cell line used here was engineered and induced to be ER-expressing and HER2-negative, while the expression of PR could be moderately activated by the ER pathway.38, 39 After fixation with ice cold 4% paraformaldehyde, cells were labeled with specific nanoprobes targeting different biomarkers. Prior to labeling, the uniformity and mono-dispersion of nanoprobes was confirmed by transmission electron microscopy (see the Supplementary Fig. 9). To label the HER2 protein, 1:1000 diluted rabbit anti-HER2-IgG (Cell Signaling Technology) was incubated with cells for 6 h at 4°C, followed by 3 × 10 min washing with fresh PBS. Then 1:50 diluted anti-rabbit-IgG GNP-conjugate (in single detection) or anti-rabbit-IgG GNR-conjugate (in multiplex detection) was applied for 4 h at room temperature (all antibody conjugates were obtained from Cytodiagnostics). To label mRNAs, cell membrane was permeabilized with 0.25% TritonX-100 for 1 h at room temperature. Then a pM-level DNA-GNP probe solution was applied for 4 h at room temperature (in multiplex detection, this step was combined with the incubation of secondary-antibody). Next, optical clearing was used. A delipidation step (30 min to 2 h) was first performed with IPA at room temperature, where the delipidation time was optimized by using a home-built pump-probe SRS microscope to monitor the removal of high-density lipid-containing granules (see the SRS technical details in the Supplementary Information). In the optimization stage, ethanol and DMSO were tested to be effective as well. The preparation of RI-matching clearing solution followed the ScaleA2 formula: 4 M urea, 10% (w/v) glycerol, and varied TritonX-100 content (0.1% for cultured cells, 0.25% for zebrafish embryos, and 0.5% for tissue slices). The clearing step lasted for 6 to 24 h according to the sample type and staining target prior to imaging. In the control group of cells, BABB solution (a 1:2 mixture of benzyl-alcohol and benzyl-benzoate) was applied as a comparison. After the clearing treatments, the samples were immediately mounted for imaging.
4. FLIM
For assessment of impacts to protein conformation, HeLa cells were transfected with the nucleus-localized Nuc-GFP (Life Technologies) or the membrane-localized CAAX-GFP plasmid (Addgene), referring to our established protocol.40 After the clearing treatments, time-domain fluorescence lifetime measurement was performed with a Microtime200 scanning confocal time-resolved system (PicoQuant GmbH). A 465 nm picosecond pulsed laser was delivered to the sample stage through an apochromatic water immersion objective lens (60×, NA 1.2) to excite GFP, and the emission was collected by the same objective. The emission was separated from the excitation by a dual band dichroic mirror (z467/638rpc, Chroma). A 50 μm pinhole and a band-pass filter (500–540 nm, Chroma) were implemented in front of the single-photon avalanche photodiode detector (SPCM-AQR, PerkinElmer) to block the out-of-focus photons and background noises. Photons were collected from each pixel and registered in a time-correlated single photon counting (TCSPC) format, based on which the fluorescence lifetime can be calculated as the frequency of detected photons decays to 1/e of the original.41 In FLIM images, the pixel-based lifetime values were converted to color coded.
5. HSDFM image acquisition
A HSDFM data set contains three-dimensional (3D) information with the x–y spatial coordinates and the intensity of spectral scattering. Hyperspectral data can be obtained by stacking a series of 1D spectral image along the x-axis (slit) while scanning the sample along the y-axis. In practice, a dark-field image was first obtained to determine the region of interest (ROI). The detector was uniformly illuminated to acquire a flatfield file as a priori to exclude the heterogeneity in signal gain at each pixel for correction. Then a pre-measurement was performed with real-time 1D spectral profiling to adjust the illumination level and exposure time, critical to signal normalization and SNR optimization without saturation. With these preset parameters, a 1D spectral image was obtained by projecting a strip of the image onto a 10 μm slit, followed by dispersion of the slit image with 300 g/mm grating to generate a spectral resolution of 0.5 nm. By scanning the ROI with a 40 nm step size, the spectral information in a 2D image was collected in the wavelength range from 400 nm to 950 nm. A stable mount is important for getting accurate position information when reconstructing hyperspectral images. Images with selected spectral wavelengths can be reconstructed with proper post-processing algorithms. The HSDFM instrumentation and image processing are elaborated in the Supplementary Information.
Supplementary Material
Acknowledgments
We want to thank Dr. David Umulis and Dr. Xu Wang (Purdue University) for providing the zebrafish embryos, Dr. Sunil Badve (Indiana University School of Medicine) for providing the breast tissue slices. Dr. Samrat Roy Choudhury is acknowledged for plasmid maintenance. This study was supported by the W. M. Keck Foundation and funding from Purdue Center for Cancer Research (P30CA023168).
References
- 1.Bohren CF, Huffman DR. Absorption and Scattering of Light by Small Particles. John Wiley & Sons; 2008. [Google Scholar]
- 2.Genina EA, Bashkatov AN, Tuchin VV. Tissue Optical Immersion Clearing. Expert Rev Med Devices. 2010;7:825–842. doi: 10.1586/erd.10.50. [DOI] [PubMed] [Google Scholar]
- 3.Zhu D, Larin KV, Luo Q, Tuchin VV. Recent Progress in Tissue Optical Clearing. Laser Photon Rev. 2013;7:732–757. doi: 10.1002/lpor.201200056. [DOI] [PMC free article] [PubMed] [Google Scholar]
- 4.Kinnunen M, Bykov AV, Tuorila J, Haapalainen T, Karmenyan AV, Tuchin VV. Optical Clearing at Cellular Level. J Biomed Opt. 2014;19:71409. doi: 10.1117/1.JBO.19.7.071409. [DOI] [PubMed] [Google Scholar]
- 5.Tuchin VV. Optical Clearing of Tissues and Blood Using the Immersion Method. J Phys D Appl Phys. 2005;38:2497–2518. [Google Scholar]
- 6.Chung K, Wallace J, Kim SY, Kalyanasundaram S, Andalman AS, Davidson TJ, Mirzabekov JJ, Zalocusky KA, Mattis J, Denisin AK, Pak S, Bernstein H, Ramakrishnan C, Grosenick L, Gradinaru V, Deisseroth K. Structural and Molecular Interrogation of Intact Biological Systems. Nature. 2013;497:332–337. doi: 10.1038/nature12107. [DOI] [PMC free article] [PubMed] [Google Scholar]
- 7.Dodt HU, Leischner U, Schierloh A, Jahrling N, Mauch CP, Deininger K, Deussing JM, Eder M, Zieglgansberger W, Becker K. Ultramicroscopy: Three-Dimensional Visualization of Neuronal Networks in the Whole Mouse Brain. Nat Methods. 2007;4:331–336. doi: 10.1038/nmeth1036. [DOI] [PubMed] [Google Scholar]
- 8.Hama H, Kurokawa H, Kawano H, Ando R, Shimogori T, Noda H, Fukami K, Sakaue-Sawano A, Miyawaki A. Scale: A Chemical Approach for Fluorescence Imaging and Reconstruction of Transparent Mouse Brain. Nat Neurosci. 2011;14:1481–1488. doi: 10.1038/nn.2928. [DOI] [PubMed] [Google Scholar]
- 9.Kuwajima T, Sitko AA, Bhansali P, Jurgens C, Guido W, Mason C. Cleart: A Detergent- and Solvent-Free Clearing Method for Neuronal and Non-Neuronal Tissue. Development. 2013;140:1364–1368. doi: 10.1242/dev.091844. [DOI] [PMC free article] [PubMed] [Google Scholar]
- 10.Ke MT, Fujimoto S, Imai T. Seedb: A Simple and Morphology-Preserving Optical Clearing Agent for Neuronal Circuit Reconstruction. Nat Neurosci. 2013;16:1154–1161. doi: 10.1038/nn.3447. [DOI] [PubMed] [Google Scholar]
- 11.Susaki EA, Tainaka K, Perrin D, Kishino F, Tawara T, Watanabe TM, Yokoyama C, Onoe H, Eguchi M, Yamaguchi S, Abe T, Kiyonari H, Shimizu Y, Miyawaki A, Yokota H, Ueda HR. Whole-Brain Imaging with Single-Cell Resolution Using Chemical Cocktails and Computational Analysis. Cell. 2014;157:726–739. doi: 10.1016/j.cell.2014.03.042. [DOI] [PubMed] [Google Scholar]
- 12.Renier N, Wu Z, Simon DJ, Yang J, Ariel P, Tessier-Lavigne M. Idisco: A Simple, Rapid Method to Immunolabel Large Tissue Samples for Volume Imaging. Cell. 2014;159:896–910. doi: 10.1016/j.cell.2014.10.010. [DOI] [PubMed] [Google Scholar]
- 13.Aaron J, Travis K, Harrison N, Sokolov K. Dynamic Imaging of Molecular Assemblies in Live Cells Based on Nanoparticle Plasmon Resonance Coupling. Nano Lett. 2009;9:3612–3618. doi: 10.1021/nl9018275. [DOI] [PMC free article] [PubMed] [Google Scholar]
- 14.Fairbairn N, Christofidou A, Kanaras AG, Newman TA, Muskens OL. Hyperspectral Darkfield Microscopy of Single Hollow Gold Nanoparticles for Biomedical Applications. Phys Chem Chem Phys. 2013;15:4163–4168. doi: 10.1039/c2cp43162a. [DOI] [PubMed] [Google Scholar]
- 15.Lee K, Cui Y, Lee LP, Irudayaraj J. Quantitative Imaging of Single mRNA Splice Variants in Living Cells. Nat Nanotechnol. 2014;9:474–480. doi: 10.1038/nnano.2014.73. [DOI] [PMC free article] [PubMed] [Google Scholar]
- 16.Wang X, Cui Y, Irudayaraj J. Single-Cell Quantification of Cytosine Modifications by Hyperspectral Dark-Field Imaging. ACS Nano. 2015;9:11924–11932. doi: 10.1021/acsnano.5b04451. [DOI] [PMC free article] [PubMed] [Google Scholar]
- 17.Patskovsky S, Bergeron E, Meunier M. Hyperspectral Darkfield Microscopy of Pegylated Gold Nanoparticles Targeting CD44-Expressing Cancer Cells. J Biophotonics. 2015;8:162–167. doi: 10.1002/jbio.201300165. [DOI] [PubMed] [Google Scholar]
- 18.Wu L, Reinhard BM. Probing Subdiffraction Limit Separations with Plasmon Coupling Microscopy: Concepts and Applications. Chem Soc Rev. 2014;43:3884–3897. doi: 10.1039/c3cs60340g. [DOI] [PMC free article] [PubMed] [Google Scholar]
- 19.Genina EA, Bashkatov AN, Larin KV, Tuchin VV. Light–Tissue Interaction at Optical Clearing. Laser Imaging and Manipulation in Cell Biology. 2010:113–164. [Google Scholar]
- 20.Cheng JX, Xie XS. Vibrational Spectroscopic Imaging of Living Systems: An Emerging Platform for Biology and Medicine. Science. 2015;350:aaa8870. doi: 10.1126/science.aaa8870. [DOI] [PubMed] [Google Scholar]
- 21.Brennan PJ, Kumagai T, Berezov A, Murali R, Greene MI. HER2/Neu: Mechanisms of Dimerization/Oligomerization. Oncogene. 2000;19:6093–6101. doi: 10.1038/sj.onc.1203967. [DOI] [PubMed] [Google Scholar]
- 22.Waterhouse BR, Gijsen M, Barber PR, Tullis ID, Vojnovic B, Kong A. Assessment of EGFR/HER2 Dimerization by FRET-FLIM Utilizing Alexa-Conjugated Secondary Antibodies in Relation to Targeted Therapies in Cancers. Oncotarget. 2011;2:728–736. doi: 10.18632/oncotarget.313. [DOI] [PMC free article] [PubMed] [Google Scholar]
- 23.Wang J, Yu X, Boriskina SV, Reinhard BM. Quantification of Differential ErbB1 and ErbB2 Cell Surface Expression and Spatial Nanoclustering through Plasmon Coupling. Nano Lett. 2012;12:3231–3237. doi: 10.1021/nl3012227. [DOI] [PMC free article] [PubMed] [Google Scholar]
- 24.Liu J, Cho IH, Cui Y, Irudayaraj J. Second Harmonic Super-Resolution Microscopy for Quantification of mRNA at Single Copy Sensitivity. ACS Nano. 2014;8:12418–12427. doi: 10.1021/nn505096t. [DOI] [PMC free article] [PubMed] [Google Scholar]
- 25.Yu C, Nakshatri H, Irudayaraj J. Identity Profiling of Cell Surface Markers by Multiplex Gold Nanorod Probes. Nano Lett. 2007;7:2300–2306. doi: 10.1021/nl070894m. [DOI] [PubMed] [Google Scholar]
- 26.Anshup A, Venkataraman JS, Subramaniam C, Kumar RR, Priya S, Kumar TR, Omkumar RV, John A, Pradeep T. Growth of Gold Nanoparticles in Human Cells. Langmuir. 2005;21:11562–11567. doi: 10.1021/la0519249. [DOI] [PubMed] [Google Scholar]
- 27.Shamsaie A, Jonczyk M, Sturgis J, Paul Robinson J, Irudayaraj J. Intracellularly Grown Gold Nanoparticles as Potential Surface-Enhanced Raman Scattering Probes. J Biomed Opt. 2007;12:020502. doi: 10.1117/1.2717549. [DOI] [PubMed] [Google Scholar]
- 28.Liu Z, Hu C, Li S, Zhang W, Guo Z. Rapid Intracellular Growth of Gold Nanostructures Assisted by Functionalized Graphene Oxide and Its Application for Surface-Enhanced Raman Spectroscopy. Anal Chem. 2012;84:10338–10344. doi: 10.1021/ac3023907. [DOI] [PubMed] [Google Scholar]
- 29.Kitching M, Ramani M, Marsili E. Fungal Biosynthesis of Gold Nanoparticles: Mechanism and Scale Up. Microb Biotechnol. 2015;8:904–917. doi: 10.1111/1751-7915.12151. [DOI] [PMC free article] [PubMed] [Google Scholar]
- 30.Lee K, Drachev VP, Irudayaraj J. DNA-Gold Nanoparticle Reversible Networks Grown on Cell Surface Marker Sites: Application in Diagnostics. ACS Nano. 2011;5:2109–2117. doi: 10.1021/nn1030862. [DOI] [PubMed] [Google Scholar]
- 31.Crow MJ, Seekell K, Ostrander JH, Wax A. Monitoring of Receptor Dimerization Using Plasmonic Coupling of Gold Nanoparticles. ACS Nano. 2011;5:8532–8540. doi: 10.1021/nn201451c. [DOI] [PubMed] [Google Scholar]
- 32.Graaff R, Aarnoudse JG, Zijp JR, Sloot PM, de Mul FF, Greve J, Koelink MH. Reduced Light-Scattering Properties for Mixtures of Spherical Particles: A Simple Approximation Derived from Mie Calculations. Appl Opt. 1992;31:1370–1376. doi: 10.1364/AO.31.001370. [DOI] [PubMed] [Google Scholar]
- 33.Jain PK, Lee KS, El-Sayed IH, El-Sayed MA. Calculated Absorption and Scattering Properties of Gold Nanoparticles of Different Size, Shape, and Composition: Applications in Biological Imaging and Biomedicine. J Phys Chem B. 2006;110:7238–7248. doi: 10.1021/jp057170o. [DOI] [PubMed] [Google Scholar]
- 34.Ordal MA, Long LL, Bell RJ, Bell SE, Bell RR, Alexander RW, Jr, Ward CA. Optical Properties of the Metals Al, Co, Cu, Au, Fe, Pb, Ni, Pd, Pt, Ag, Ti, and W in the Infrared and Far Infrared. Appl Opt. 1983;22:1099–1020. doi: 10.1364/ao.22.001099. [DOI] [PubMed] [Google Scholar]
- 35.Cui Y, Irudayaraj J. Inside Single Cells: Quantitative Analysis with Advanced Optics and Nanomaterials. Wiley Interdiscip Rev Nanomed Nanobiotechnol. 2015;7:387–407. doi: 10.1002/wnan.1321. [DOI] [PMC free article] [PubMed] [Google Scholar]
- 36.Frens G. Controlled Nucleation for the Regulation of the Particle Size in Monodisperse Gold Suspensions. Nature. 1973;241:20–22. [Google Scholar]
- 37.Haiss W, Thanh NT, Aveyard J, Fernig DG. Determination of Size and Concentration of Gold Nanoparticles from UV-Vis Spectra. Anal Chem. 2007;79:4215–4221. doi: 10.1021/ac0702084. [DOI] [PubMed] [Google Scholar]
- 38.Maminta ML, Molteni A, Rosen ST. Stable Expression of the Human Estrogen Receptor in HeLa Cells by Infection: Effect of Estrogen on Cell Proliferation and c-Myc Expression. Mol Cell Endocrinol. 1991;78:61–69. doi: 10.1016/0303-7207(91)90186-v. [DOI] [PubMed] [Google Scholar]
- 39.Flototto T, Niederacher D, Hohmann D, Heimerzheim T, Dall P, Djahansouzi S, Bender HG, Hanstein B. Molecular Mechanism of Estrogen Receptor (ER)Alpha-Specific, Estradiol-Dependent Expression of the Progesterone Receptor (PR) B-Isoform. J Steroid Biochem Mol Biol. 2004;88:131–142. doi: 10.1016/j.jsbmb.2003.11.004. [DOI] [PubMed] [Google Scholar]
- 40.Cui Y, Choudhury SR, Irudayaraj J. Quantitative Real-Time Kinetics of Optogenetic Proteins CRY2 and CIB1/N Using Single-Molecule Tools. Anal Biochem. 2014;458:58–60. doi: 10.1016/j.ab.2014.04.023. [DOI] [PMC free article] [PubMed] [Google Scholar]
- 41.Cui Y, Irudayaraj J. Dissecting the Behavior and Function of MBD3 in DNA Methylation Homeostasis by Single-Molecule Spectroscopy and Microscopy. Nucleic Acids Res. 2015;43:3046–3055. doi: 10.1093/nar/gkv098. [DOI] [PMC free article] [PubMed] [Google Scholar]
Associated Data
This section collects any data citations, data availability statements, or supplementary materials included in this article.