Significance
The room temperature structure of natively formed protein nanocrystals consisting of 9,000 unit cells has been solved to 2 Å resolution using an unattenuated X-ray free-electron laser (XFEL) beam, representing, by far, the smallest protein crystals used for protein structure determination by X-ray crystallography to date. Radiation damage limits structure determination from protein crystals using synchrotron techniques, whereas femtosecond X-ray pulses from free-electron lasers enable much higher tolerable doses, extracting more signal per molecule, allowing the study of submicrometer crystals. Radiation-sensitive features, such as disulfide bonds, are well resolved in the XFEL structure despite the extremely high dose (1.3 GGy) used. Analysis of signal levels obtained in this experiment indicates that structure determination from even smaller protein crystals could be possible.
Keywords: XFEL, nanocrystals, structural biology, bioimaging, SFX
Abstract
To understand how molecules function in biological systems, new methods are required to obtain atomic resolution structures from biological material under physiological conditions. Intense femtosecond-duration pulses from X-ray free-electron lasers (XFELs) can outrun most damage processes, vastly increasing the tolerable dose before the specimen is destroyed. This in turn allows structure determination from crystals much smaller and more radiation sensitive than previously considered possible, allowing data collection from room temperature structures and avoiding structural changes due to cooling. Regardless, high-resolution structures obtained from XFEL data mostly use crystals far larger than 1 μm3 in volume, whereas the X-ray beam is often attenuated to protect the detector from damage caused by intense Bragg spots. Here, we describe the 2 Å resolution structure of native nanocrystalline granulovirus occlusion bodies (OBs) that are less than 0.016 μm3 in volume using the full power of the Linac Coherent Light Source (LCLS) and a dose up to 1.3 GGy per crystal. The crystalline shell of granulovirus OBs consists, on average, of about 9,000 unit cells, representing the smallest protein crystals to yield a high-resolution structure by X-ray crystallography to date. The XFEL structure shows little to no evidence of radiation damage and is more complete than a model determined using synchrotron data from recombinantly produced, much larger, cryocooled granulovirus granulin microcrystals. Our measurements suggest that it should be possible, under ideal experimental conditions, to obtain data from protein crystals with only 100 unit cells in volume using currently available XFELs and suggest that single-molecule imaging of individual biomolecules could almost be within reach.
Imaging of biomolecules using radiation of short enough wavelength to resolve individual atoms is limited by radiation damage, which destroys the very structure being measured. Energy absorption is unavoidable because the ratio of elastic scattering to damaging photoabsorption is an inherent property of atoms. Absorbed dose is therefore proportional to the scattered intensity, and thus the measured signal, used to determine the structure. The maximum tolerable dose that the sample can withstand fundamentally limits atomic resolution structure determination (1). The tolerable dose, and therefore damage, is a function of spatial resolution, with fine detail being destroyed first (2, 3). Radiation damage is typically overcome by distributing the dose over many identical copies of the same molecule, either using crystals containing many aligned copies of the same molecule, or by aligning images of individual molecules in the case of single particle electron microscopy. At room temperature, free radical production after a dose as small as 150 kGy (gray = J˙kg−1 absorbed energy) causes rapid decay of biological samples (4). This decay can be reduced by cooling the sample to below ∼120 K. Doses up to about 30 MGy at synchrotron beam lines are routinely used for atomic structure determination from cryocooled protein crystals larger than about 100 μm3 (3, 5, 6). Similar dose limits apply in single particle cryo-electron microscopy, where individual images must have sufficient contrast to allow alignment before averaging to improve signal-to-noise (7, 8).
Serial femtosecond crystallography (SFX) overcomes radiation damage by using ultrabright X-ray pulses that are shorter in duration than most damage processes (9–14), thereby vastly increasing the tolerable dose and thus the amount of information gathered before the specimen is destroyed. Commonly, crystals in a liquid stream are injected into the X-ray beam, and each crystal diffracts for only a few femtoseconds before being destroyed (12, 15). Each crystal is exposed to at most one X-ray pulse, and diffraction patterns from thousands of crystals in random orientations are combined to form a complete 3D dataset. After indexing and integration, hundreds or even thousands of observations of each individual reflection from different crystals contribute to the final dataset through an averaging and modeling process resulting in a single set of reflection intensities for crystallographic structure determination (16, 17).
Early SFX experiments performed at the Linac Coherent Light Source (LCLS) showed that useful structural information could be obtained from submicrometer-sized crystals (10) using long-wavelength X-ray pulses (2 keV photon energy) at a dose of 700 MGy and from micrometer-sized crystals at an energy and dose similar to cryogenic synchrotron data collection (11, 18, 19) (9.4 keV, 33 MGy). Simulations (20, 21) and experiments (12–14) suggest that it should be possible to outrun radiation damage with short enough pulses using much higher X-ray intensities. Calculations with pulse durations as short as 10 fs predict the possibility of high-resolution structure determination from nanocrystals at doses greater than 10 GGy, and 1-TGy doses should be tolerable with subfemtosecond pulses (22). In this context, it has been proposed that the combination of intense X-ray laser pulses and the serial data collection method could be used to obtain macromolecular structures by single-molecule diffraction (9, 23). Despite being able to measure submicrometer-sized crystals or single molecules, most SFX experiments carried out to date, where structures have been solved to better than 3.5 Å resolution, have used protein crystals of about 1–10 μm in diameter and the full power of the XFEL source must be attenuated to avoid saturating or damaging the detector (11, 18, 19, 24, 25), at least when performing experiments in vacuum using the Cornell-SLAC Pixel Array Detector (CSPAD) detector.
Here, we use unattenuated XFEL pulses to study native occlusion bodies (OBs) of Cydia pomonella granulovirus (CpGV), which are spheroidal ∼265 × 265 × 445 nm semicrystalline particles that each contain a well ordered ∼0.01 µm3 protein lattice encasing a virion. Granulovirus OBs are stable, do not aggregate, and are readily obtainable because the virus is commercially used in horticulture to control codling moth (C. pomonella) in orchards (26). Granuloviruses belong to the Betabaculovirus genus of the Baculoviridae family, a group of insect viruses characterized by viral OBs, infectious microcrystals that form within infected larvae and persist for long periods in the environment (27).
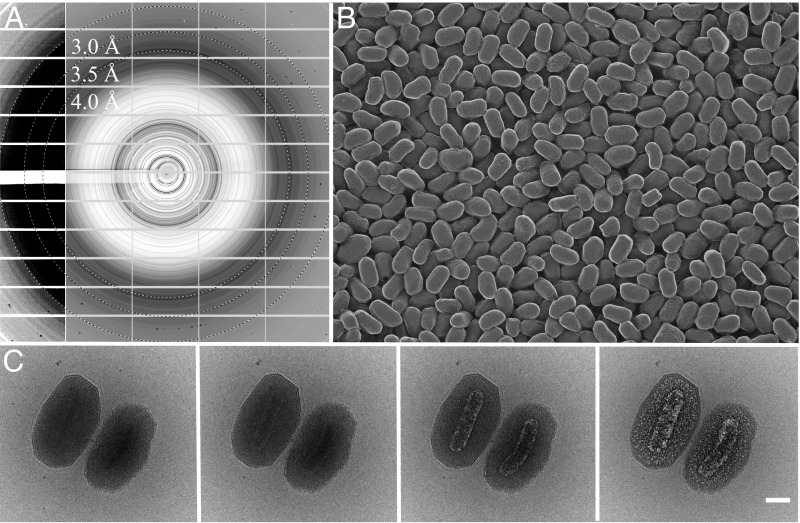
OBs contain membrane-bound virus particles embedded in a crystalline lattice of viral protein molecules (Fig. 1). The OB matrix protein of Betabaculovirus (granulin) is homologous to that of Alphabaculovirus (polyhedrin), sharing ∼60% amino acid sequence identity. Much remains to be learned about OBs, such as how the crystals grow within cells, what controls their size and shape, how the polyhedrin/granulin lattice interacts with the embedded virus particles and the envelope layer that forms the outer surface, and how the OBs disassemble in the alkaline midgut of feeding larvae to release the infectious virus. Such studies would ideally be performed at physiological temperatures and conditions on native OBs rather than recombinantly expressed protein recrystallized into large crystals.
Fig. 1.
Granulovirus OBs contain a single virion surrounded by a crystalline protein layer that diffracts to high resolution. (A) Powder X-ray diffraction from a pellet of granulovirus OBs at 100 K (Materials and Methods). Protein diffraction rings extend to a resolution between 3 and 3.5 Å. The detector panels on the left with enhanced contrast show evidence of diffraction at even higher resolution. Resolution rings are shown at 4, 3.5, and 3 Å. (B) Freeze etch electron micrograph showing the uniform size distribution of the particles (Materials and Methods). (C) Cryo-EM. The sequence of four 20 e/Å2 exposures shows the effects of radiation damage on granulovirus OBs. The crystalline lattice is visible only in the first image and hydrogen gas bubbles produced by radiolysis eventually reveal the virion. (Scale bar, 100 nm.)
Atomic structures for Lepidopteran Alphabaculovirus polyhedrins have been determined using native polyhedral OBs purified from larvae and recombinant microcrystals prepared by expressing polyhedrin in insect cells (28, 29). These revealed a cubic body centered lattice with a 103-Å unit cell densely packed with polyhedrin molecules interconnected by extensive crystal contacts and intermolecular disulfide bonds. The solvent content of only 20% is among the lowest known for protein crystals (30). Although these features are consistent with the extraordinary stability of OBs, these structures are incomplete, with over 30 of the 245 amino acids undefined by electron density.
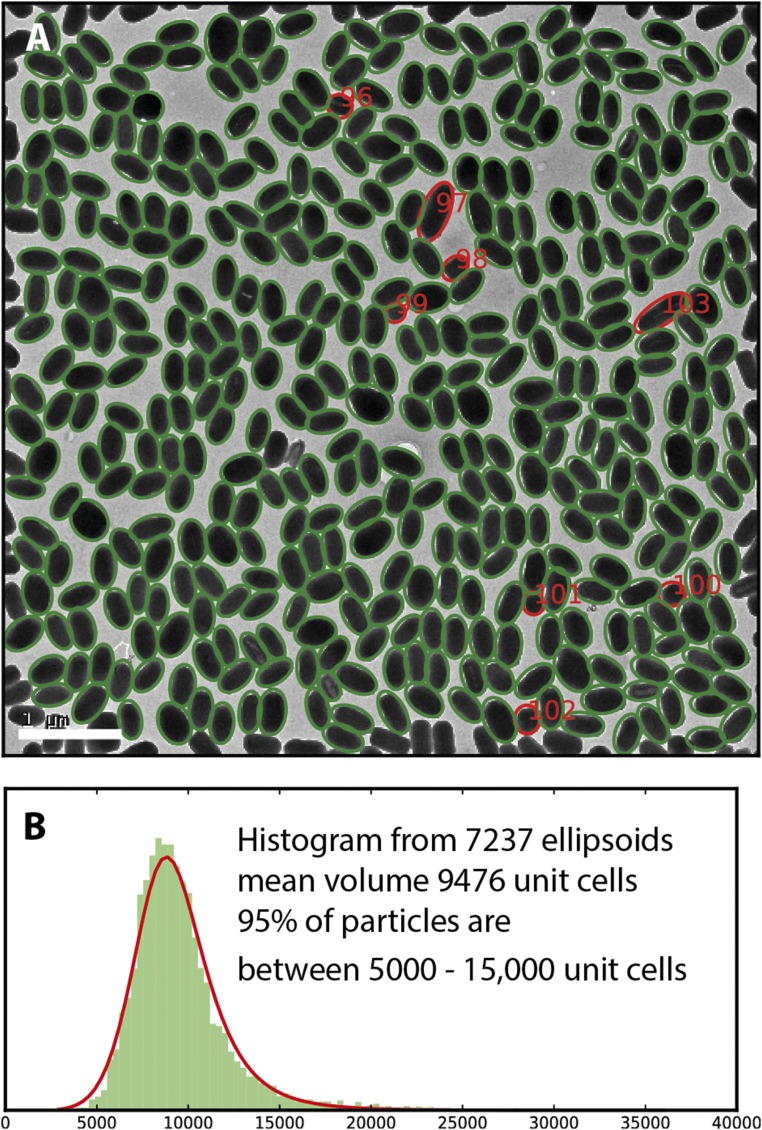
Given the small size and the fact that a membrane-bound virus particle occupies much of the volume, the granulin lattice in granulovirus OBs is surprisingly well ordered. Cryocooled granulovirus OBs pelleted in 50% (vol/vol) ethylene glycol diffract X-rays to at least 3.5 Å (Fig. 1). The size distribution of granulovirus OBs was estimated from electron micrographs (Fig. S1). The granulovirus OB samples were free of aggregates and had a narrow size distribution and did not contain crystals large enough to risk damaging the detector. By modeling cryo-EM images of individual OBs (Fig. 1), we estimate that about 60% of the volume of granulovirus OBs consists of crystalline granulin. The crystalline part of granulovirus OBs is about 1,000th of the volume of most other crystals analyzed so far using femtosecond pulses and provides a means to determine the practical limits of nanocrystallography using the full flux density of the X-ray FEL.
Fig. S1.
(A) Electron micrograph showing granulovirus occlusion bodies outlined by ellipses. The particles shown with red ellipses are outliers. Particles 97 and 103 are unusally large and the other red particles unusually small, probably because they are end-on views. (B) Histogram of volumes derived from 7,237 ellipsoids from particles in 16 similar images. The histogram has been fitted with a log-logistic distribution with mode ∼9,000 unit cells. According to this distribution, 2% of the particles are larger than 16,000 unit cells. (Scale bar, 1 µm.)
Results
XFEL Data Collection and Analysis.
Granulovirus OBs were produced in C. pomonella larvae, purified, and injected into the XFEL beam using a gas dynamic virtual nozzle (GDVN) (31–33) at a concentration of 1013 particles per mL in water at a temperature of 20 °C. A total of 1.5 million detector frames were collected (∼3.5 h of data collection) during experiment L767 using the CXI microfocus instrument at LCLS, from which 487,184 crystal diffraction patterns were identified as crystal diffraction “hits” in the data-processing step using Cheetah (34). We obtained a complete dataset to 2 Å resolution merged from 82,603 indexed crystal diffraction patterns, with an overall Rsplit of 7.89%, demonstrating the overall internal consistency of the data (Table 1).
Table 1.
Crystallographic data collection and refinement statistics
| Metric | GV-SFX | GV-SYN |
| Data collection | ||
| Temperature, K | 293 | 100 |
| Wavelength, Å | 1.56 | 1.00 |
| Beam size, µm2 | 1.3 x 1.3 | 5 x 15 |
| Number of crystals included | 82,603 | 21 |
| Average particle size, µm | 0.2 x 0.2 x 0.4 | 5 x 5 x 5 |
| Crystalline fraction* | 60% | 100% |
| Flux | 1 x 10¹² photons per pulse | 1 x 10¹² photons per s |
| Max dose per crystal, MGy | 1,300 | 30 |
| Space group | I 2 3 | I 2 3 |
| Unit cell, Å | a = b = c = 103.4 | a = b = c = 102.058 |
| Pulse duration | 50 fs | — |
| No. collected images | 1,535,619 | 77 |
| No. hits/indexed images | 487,085/82,603 | — |
| No. total/unique reflections | 77,177,221/12,600 | 182,450/21,007 |
| Resolution, Å | 40–2.00 | 25.51–1.66 |
| Completeness, %† | 100 (99.95) | 100 (100) |
| Multiplicity | 6,008 (1258) | 8.7 (7.5) |
| SNR/<I/σ(I)> | 9.57 (0.89) | 7.52 (1.49) |
| CC1/2 | 0.997 (0.297) | 0.987 (0.434) |
| CC* | 0.999 (0.677) | 0.997 (0.778) |
| Rsplit, % | 7.91 (141.6) | — |
| Rmeas, % | — | 27.52 (166.4) |
| Wilson B-factor, Å2 | 38.34 | 8.28 |
| Refinement | ||
| Resolution range, Å | 27.63–2.00 (2.07–2.00) | 25.51–1.66 (1.72–1.66) |
| Reflections, refinement | 12,596 (1,252) | 21,007 (2,087) |
| Reflections, Rfree | 1,231 (115) | 2,131 (233) |
| Rwork, % | 14.94 (38.56) | 14.91 (24.69) |
| Rfree, % | 18.99 (44.54) | 19.22 (29.62) |
| No. nonhydrogen atoms | 2,127 | 2,045 |
| Protein | 2,030 | 1,926 |
| Water | 97 | 119 |
| B-factors, Å2 | ||
| Overall/protein/water | 39.07, 39.05, 39.35 | 12.04, 11.52, 20.48 |
| R.m.s bonds, Å/angles, ° | 0.004/0.71 | 0.007/0.87 |
| Ramachandran plot, %‡ | ||
| Favored | 96 | 99 |
| Allowed | 3.7 | 0.9 |
| Outliers | 0 | 0 |
The internal virion and surface layer comprise ∼40% of the volume of granulovirus OBs.
Values in parentheses are for the highest resolution shell.
‡From Molprobity (35).
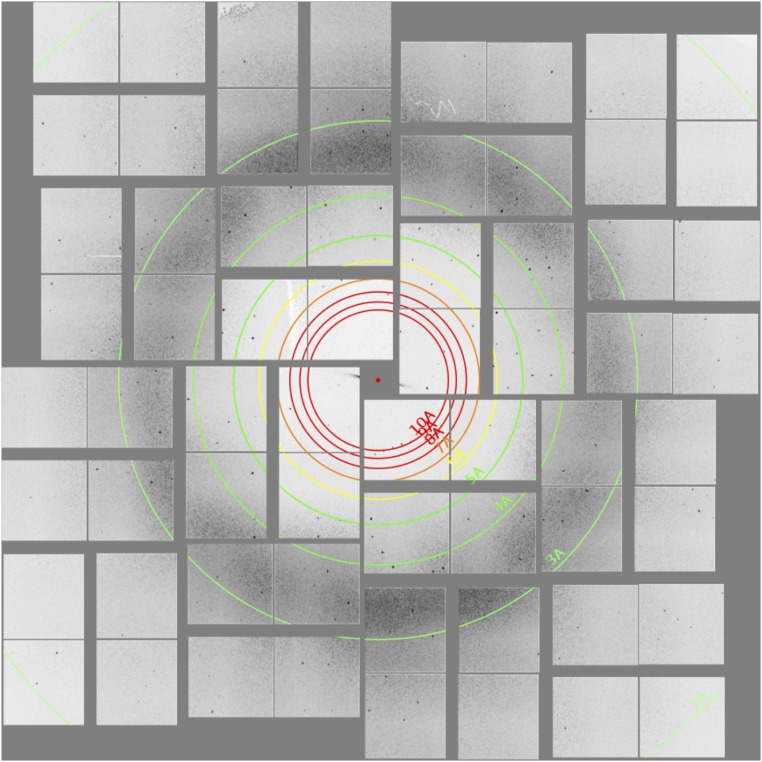
We observe that ∼1% of the indexed diffraction patterns contained visible diffraction peaks extending to the corners of the detector at 1.9 Å resolution (see example in Fig. S2). Crystals are randomly distributed in the 3–4-µm diameter liquid stream, and the XFEL beam is focused to a 1.3-µm FWHM spot, surrounded by a much larger but less intense halo. As a result, many of the observed patterns are probably due to particles that only partially intersect the brightest part of the XFEL beam. We estimate that for uniformly distributed 200 × 200 × 400 nm3 spheroids at the concentration and flow rate used (3–4 μL/min) in these experiments, the expected diffraction intensity distribution would have a larger contribution from exposures with weak illumination, where the crystal is hit by the X-ray beam outside its FWHM. Although granulovirus particles have a narrow size distribution, there is a 1–2% outlier fraction of larger crystals (Fig. S1) that may also have contributed to the strongest diffraction peaks at high resolution. The CrystFEL data processing suite provides an estimated resolution limit of each diffraction pattern. To exclude the possibility that the high-resolution signal was entirely derived from the small population of larger crystals, we identified patterns that extended beyond 2.5 Å. Excluding those patterns did not appreciably alter the structure or other merging figures of merit, leading us to conclude that the structure was indeed derived from the whole population of measured crystals and not dominated by a few strong patterns from outlier larger crystals (Table S1).
Fig. S2.
Example of a high-resolution diffraction pattern collected on the CSPAD, showing intense diffraction into the corners of the detector.
Table S1.
Data statistics after omitting the patterns estimated to diffract to higher than 2.5 Angstrom (merging 72,343 of the 82,603 diffraction patterns of the final data set)
| Rsplit, % | Resolution, Å |
| Overall Rsplit, 6.03% | |
| 2.20 | 7.82 |
| 3.57 | 3.81 |
| 5.46 | 3.19 |
| 11.50 | 2.84 |
| 16.43 | 2.61 |
| 17.46 | 2.44 |
| 26.24 | 2.31 |
| 44.83 | 2.20 |
| 53.53 | 2.11 |
| 97.34 | 2.04 |
| CC* | Resolution, Å |
| Overall CC*, 0.9995 | |
| 0.9996485 | 7.82 |
| 0.9989822 | 3.81 |
| 0.9985906 | 3.19 |
| 0.9925947 | 2.84 |
| 0.9862119 | 2.61 |
| 0.9849561 | 2.44 |
| 0.9664804 | 2.31 |
| 0.8536974 | 2.20 |
| 0.8120955 | 2.11 |
| 0.6569938 | 2.04 |
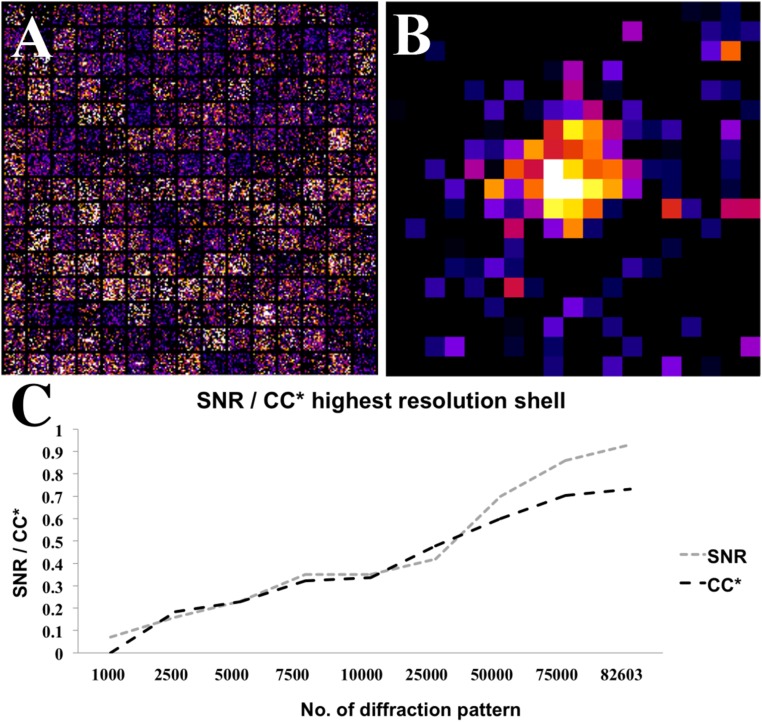
Although the remaining ∼99% of the indexed diffraction patterns showed little evidence of diffraction beyond 3 Å resolution, averaged data from thousands of patterns revealed that granulovirus OBs diffract to at least 2 Å resolution, limited by detector distance. In Fig. 2A we show 25 × 25 pixel regions of 225 detector frames centered at the predicted location of reflection 21 26 29 after first accounting for an indexing ambiguity (Fig. S3). This reflection was predicted to occur in 3,176 frames in the dataset and corresponds to 2.3 Å resolution. The sum of the pixel regions from all 3,176 detector frames is shown in Fig. 2B. A similar improvement occurred in all peaks in this resolution shell, and Fig. 2C shows the dependence of signal-to-noise ratio of reflections in the highest resolution shell on the number of patterns included in the dataset. Averaging over thousands of patterns (Fig. S4) significantly improved data quality, revealing Bragg peaks not visible in individual patterns.
Fig. 2.
Averaging thousands of reflections significantly improved overall resolution estimate. (A) Two hundred and twenty-five randomly selected single images at the predicted location of the 21 26 29 reflection (corresponding to 2.3 Å resolution). (B) Averaged Bragg intensity of the 21 26 29 reflection intensities from 3,176 observed reflections after first rotating them into the common frame of reference of the lattice. (C) Plot of overall signal-to-noise ratio and CC* metric in the 2–2.1 Å resolution shell against the number of indexed diffraction patterns included.
Fig. S3.
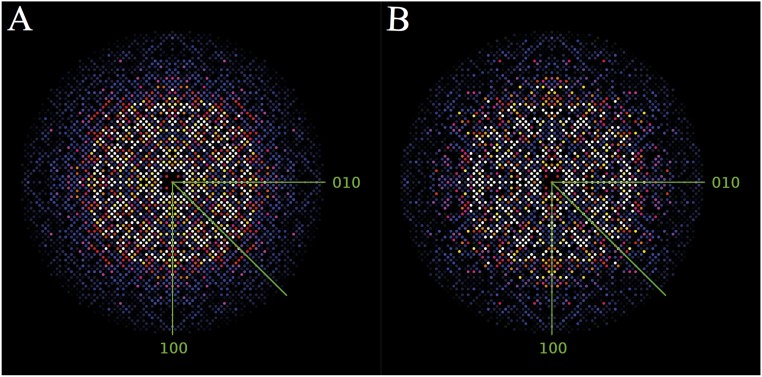
Results of the “detwinning” step of the CpGV dataset by CrystFEL, showing intensities in the hk0 plane after merging symmetry-equivalent reflections in point group (A) before applying ambigator showing an additional, artificial symmetry axis resulting in a fourfold symmetry of the hkl intensities and (B) after ambigator showing the true twofold symmetry.
Fig. S4.
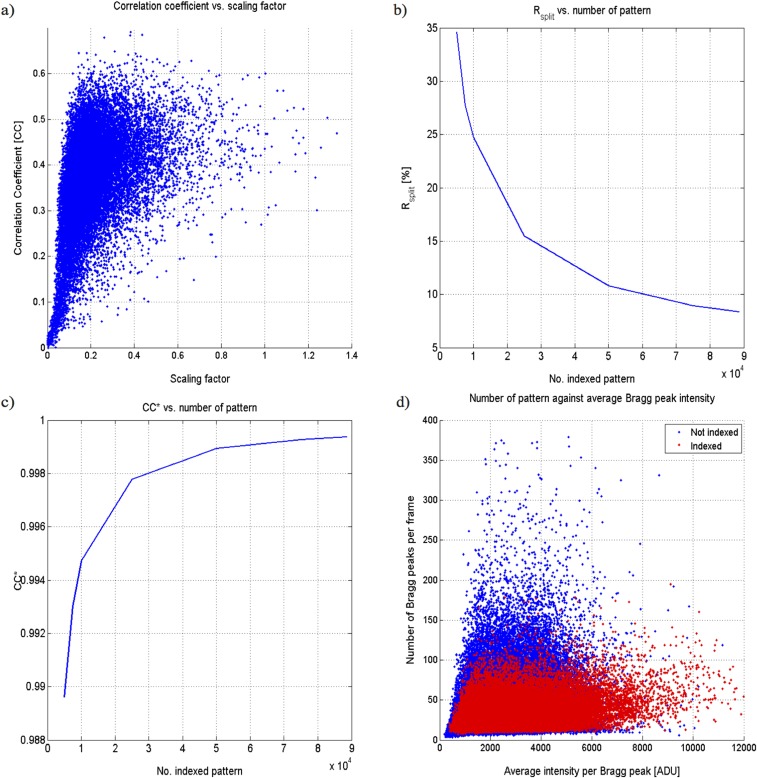
Quality metrics of the final dataset. (A) Correlation coefficient of all indexed patterns to an initially merged set against individual scaling factors. (B) Rsplit vs. number of patterns. (C) CC* vs. number of patterns. (D) Number of patterns vs. average Bragg peak intensity.
Structure Determination of Granulin.
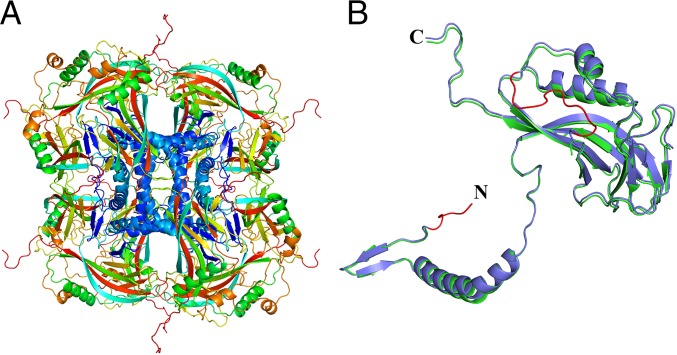
The granulin structure was determined from the XFEL data by molecular replacement using a search model based on Wiseana nucleopolyhedrovirus (WNPV) polyhedrin [Protein Data Bank (PDB) ID code 3JVB] (28), which shares 51.6% overall sequence identity (69.0% overall sequence similarity determined with EMBOSS Needle and the EBLOSUM62 matrix). Automatic model building followed by iterative refinement led to a final model with Rwork/Rfree (%) of 14.9/19.0 to a resolution of 2.0 Å. This model is referred to below as SFX. The SFX structure was compared with a previously determined structure (referred to as SYN) obtained by molecular replacement using the same 3JVB model and 1.66 Å resolution synchrotron data from 21 recombinant ∼5-µm CpGV granulin crystals collected at beamline X06SA at the Swiss Light Source (SI Materials and Methods). The overall SFX electron density is well defined, which allowed all but the five N-terminal residues to be modeled. In the cryocooled SYN structure, 24 of the 248 residues could not be modeled (residues 1–12 of the N terminus and loop residues 177–188) (Figs. 3 and 4).
Fig. 3.
(A) The structure of the biological unit of granulin building blocks forming the crystalline OB. (B) Granulin monomer. The SFX structure is displayed in blue and the SYN structure in green. Regions of granulin that were present in the SFX but not in the SYN structure are highlighted in red.
Fig. 4.
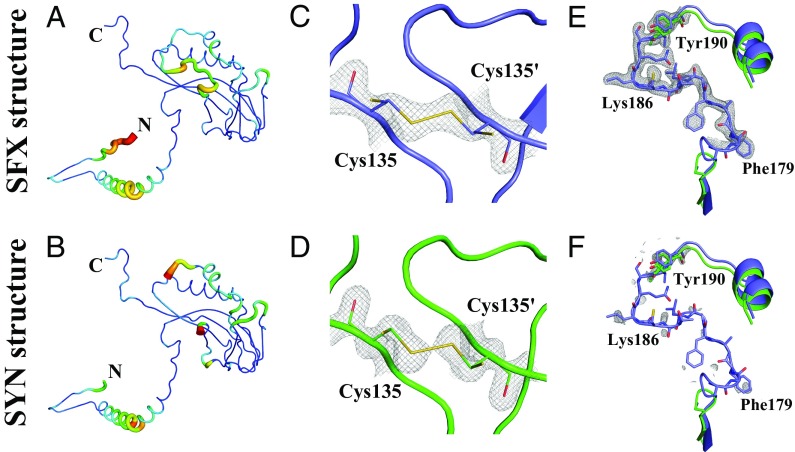
Comparison of the final 2Fo-Fc electron density map and model for the SFX (blue) and SYN (green) structures of granulin. (A) SFX and (B) SYN model with color-map and thickness corresponding to local B-factor. (C and D) Close-up of Cys135 in (C) the SFX (blue) and (D) the SYN structure and (green) embedded in its electron (gray mesh, contoured 1.5 σ). Cys135 adopts two distinct side chain conformations (shown as sticks): The major conformer forms an intermolecular disulfide bond with its counterpart in a neighboring molecule and has a refined occupancy of 0.68 and 0.87 for the SFX and SYN structure, respectively. (E) SFX and (F) SYN comparison of electron density for residues 168–201 (contoured at 1 σ). Electron density defining residues 176–190 was only found for the SFX structure.
Granulin Structure.
The central part of the granulin structure consists of a compact β-sandwich, with two additional α-helices H2/3. Perpendicular to the main body, granulin shows an extruding N terminus, perpendicular to the central part, beginning with a short β-hairpin structure, followed by a long, bent α-helix H1 (Figs. 3 and 4). Granulin shows a high level of structural similarity to WNPV polyhedrin (PDB ID code 3JVB), with a root-mean-square deviation of 0.634 Å across 173 Cα positions (28), as expected from sequence homology. However, three flexible loop regions in the central part (146–149, 176–190, 200–207) as well as several residues at the N terminus (6–13, 41–43) are well defined in the XFEL granulin structure (Figs. 3 and 4) but are completely absent in the WNPV polyhedrin structure.
SI Materials and Methods
Preparation of CpGV Granulin Microcrystals Using Baculovirus Expression System.
Virus and cells.
Recombinant AcMNPV was constructed using the Bac-to-Bac baculovirus expression system (Invitrogen) and maintained in Escherichia coli DH10 as described in the system manual. Spodoptera frugiperda (Sf9) insect cells (Invitrogen) were maintained as a monolayer culture in SF-900II SFM medium (Invitrogen).
Cloning the CpGV granulin ORF.
All primers and T4 DNA ligases were purchased from Invitrogen. Restriction enzymes were ordered from Roche Applied Science.
The granulin ORF1 gene was amplified from purified CpGV genomic DNA by PCR using Prime STAR HS DNA polymerase (Takara) and the following primers: forward primer, GGCCGCCGTCGACATGGGATATAACAAATCT; reverse primer, CCGCGGCAAGCTTTAATAAGCTGGGCCGGTG. The PCR product was digested with HindIII and SalI and then ligated into the HindIII and SalI sites of the pFastBac Dual vector (Invitrogen), under the control of the AcMNPV polyhedrin promoter, to generate the recombinant plasmid, pFBD_Granulin. The pFBD_Granulin plasmid was transformed into E. coli (DH10) competent cells, containing the AcMNPV bacmid and a helper vector, using chemical transformation. The antibiotics (kanamycin, 50 μg/mL; gentamycin, 10 μg/mL; tetracycline, 10 μg/mL), isopropyl β-d-thiogalactopyranoside (IPTG), and X-Gal (Sigma) were used for colony selection.
Bacmid transfection of insect cells.
The recombinant bacmid was isolated from E. coli and transfected into Sf9 cells according to the supplier’s instructions (Invitrogen) with slight modifications. Briefly, Sf9 cells were maintained in tissue culture flasks in SF-900 II SFM media at 28 °C. Approximately 1 × 10⁶ cells per 35-mm well dish were seeded and allowed to attach to the culture dish at 28 °C for 1 h before transfection. For the preparation of the transfection lipid–DNA mixture, 100 μL dilute bacmid solution (4 μg bacmid in 100 μL SF-900 II SFM media) was mixed with an equal volume of the dilute insect GeneJuice transfection reagent (Novagen) (8 μL in100 μL SF-900 II SFM media). The transfection mixture was incubated at 20 °C for at least 30 min and then diluted by adding 800 μL SF-900 II SFM media. Sf9 cells were overlayed with the diluted transfection mixture after careful removal of excess culture medium. The baculovirus-transfected Sf9 cells were incubated at 27 °C for at least 4 h. Then the transfection mixture was removed and another 2 mL of fresh SF-900 II SFM was added, followed by incubation at 28 °C for 3 d.
Amplification of modified AcMNPV with granulin replacing the AcMNPV polyhedrin gene.
After incubation at 28 °C for 3 d, media containing the virus was harvested from the cell culture by centrifugation at 500 g for 5 min and supplemented with 2% (vol/vol) FBS (FCS). For the first round of viral amplification, 500 μL of viral supernatant was mixed with 1.5 mL 1.2 × 10⁶ cells per well in a 35-mm cell culture dish, followed by incubation at 28 °C for at least 48 h (72 h in this case). The virus was harvested as described above and then the fresh viral supernatant diluted 1/1,000–20 mL in Sf9 cells (1.5 × 10⁶ cells per mL), followed by incubation at 28 °C for 72 h. After incubation, amplified viruses were harvested as described above and stored at 4 °C.
Production and harvest of recombinant granulin crystals.
To produce recombinant CpGV granulin, the amplified viral stock was mixed with Sf9 cells (0.9–1.2 × 10⁶ cells per ml) at 1/2,000 dilution in a tissue culture plate. The cell cultures were incubated in SF-900II SFM (Invitrogen) at 28 °C for 4 d. After 48-h infection, the cultures were supplemented with 5 mM Glucose and 5 mM l-glutamine and incubated at 28 °C for a further 2 d. At this, point crystals were visible within the cells by light microscopy.
After 4 d of incubation, the infected Sf9 cells (5 mL) were harvested by centrifugation (500 g) at 4 °C for 5 min. The cell pellet was resuspended in 10 mL MQ H2O followed by a centrifugation (2,350 g, 4 °C) for 5 min. The pellet was washed with 1 mL MQ H2O, followed by a 30-s sonication (Misonix Sonicator 3000; microtip at power setting at 3) on ice. The sample was centrifuged (2,350 g, 4 °C) for 5 min to remove cell debris. The washing and centrifugation steps were repeated to remove remaining cell debris. The resulting pellet of granulin microcrystals was resuspended in 50–100 μL H2O and stored with 0.02% sodium azide at 4 °C.
Sample Preparation of in Vivo Grown Granulovirus OBs.
OBs of CpGV (Mexican strain) were produced by infection of fourth instar larvae of C. pomonella and purified as described in ref. 36. In brief, OBs from raw larval homogenates or from commercial preparations were filtered through cotton wool and repeatedly washed by centrifugation (18,000 g, 30 min) followed by resuspending the pellet in water. The concentrated OB suspension was then purified using a discontinuous glycerol gradient 30–80% (vol/vol). The OB band was collected, resupended in water, and pelleted again (3,200 × g, 45 min). If the required purity was not achieved, the glycerol gradient purification was repeated once. The collected OBs were three times washed by centrifugation (3,200 g, 45 min) followed by resuspending the pellet in water. The OB suspension was stored at –18 °C until use.
Size Estimate of Granulovirus OBs.
Close inspection of electron micrographs like Fig. 1 revealed occasional larger particles with a similar shape and rare elongated particles with similar diameter but up to five times longer than average granulovirus particles. To investigate the possibility that these larger particles may dominate the SFX dataset, we needed unbiased size distribution statistics. We developed a system to dry particles from a thin liquid layer on glow-discharged carbon-coated electron microscope grids so that most of the particles are oriented with the long axis approximately parallel to the grid surface and made low-magnification images like that shown in Fig. S1. We used ImageJ (https://imagej.nih.gov/ij/) to trace the outlines of all of the particles in these images and Python scripts to estimate particle crystal volumes from fitted ellipse outlines.
Powder Diffraction.
CpGV OBs in water were pelleted using a bench top centrifuge and the pellet resuspended in an equal volume of ethylene glycol. The resultant slurry was applied to a MiteGen grid and allowed to dry before cooling by insertion into a 100 K cryostream. The grid was exposed for 15 s to a flux of ∼1.56 × 10¹² 0.97 Å photons per s focused to 80 × 40 microns using the X06SA beamline at the Swiss Light Source synchrotron. The detector used was a Pilatus 6M at a camera length of 630 mm. Repeated exposures did not show evidence of radiation damage.
Data Collection for Synchrotron Structure.
Recombinantly grown CpGV granulin crystals in 50% (vol/vol) ethylene glycol were applied to Mitegen 400/50 mesh grids and cooled in liquid nitrogen before transfer to the cryostream at the MD2 microdiffractometer (Maatel) used for data collection.
Diffraction data for recombinant CpGV granulin at 100 K were collected in 1° rotations from beamline PXI (X06SA) of the Swiss Light Source, Switzerland, with synchrotron radiation (1012 photons per s, beam size of 5 × 15 μm2 FWHM) at a wavelength of 1.0 Å (0.02% bandwidth) using a Mar225 CCD detector (MarResearch). The data were indexed and integrated with XDS (37), scaled and merged with AIMLESS (38), and converted to structure factor amplitudes with CTRUNCATE (39). Merging statistics were calculated with phenix.merging_statistics (40). The structure was determined and refined in the same manner as the XFEL structure.
The high-resolution limit of 1.66 Å for the SYN structure as well as the 2 Å for the SFX structure was determined by paired-refinement and correlation coefficient analysis, ensuring CCwork or CCfree did not exceed CC* across the full resolution range (41).
Data Collection by SFX.
SFX experiments with CpGV OBs were carried out at the CXI instrument of LCLS (beamtime ID: L767), at the SLAC National Accelerator Laboratory. The LCLS X-ray beam with an estimated pulse duration of 50 fs and a photon energy of 7.9 keV was focused using X-ray optics in a Kirkpatrick–Baez geometry to a beam size of about 1.3 × 1.3 μm2 FWHM. The average pulse energy was 2.7 mJ, and the pulse repetition rate was 120 Hz. Granulovirus OBs were injected as a liquid suspension into the X-ray interaction region as a liquid jet formed by a gas-focused nozzle (31–33). In this system, the liquid suspension was pushed through a 50-μm inner diameter capillary to subsequently form a jet of about 3–4 μm diameter at the interaction region by the action of a coaxially flowing helium stream. The flow rate of the sample was 10–15 μL/min. Granulovirus OB settling was prevented by the use of an antisettling sample-delivery instrument (42) equipped with syringe-temperature control (set to 20 °C) for injection. The velocity of the jet was sufficient to fully replenish the sample between X-ray pulses. Diffraction data were collected on CSPAD (43), a multipanel detector consisting of 64 individual tiles. The detector was set to a distance of 130 mm, giving a maximum diffraction resolution of 1.88 Å at its corner.
SFX Data Analysis.
Individual hits, defined as diffraction patterns containing more than 20 Bragg peaks with a signal-to-noise larger than 6, were identified using the software Cheetah (34). The average hit rate fluctuated between 10% and 60% during the experiment, for a total of 487,085 frames containing crystal diffraction. Some of them showed diffraction to the corner of the detector (Fig. S2 as an example). Of these patterns, 82,603 were indexed using CrystFEL (17) (version 0.5.2+93d0472).
Granulin crystals belong to space group I23, a space group with arbitrary choice of two different orientations of the unit-cell axes that are compatible with a particular set of Bragg peak locations in the diffraction pattern. This ambiguity can be overcome by examining the relative intensities of the Bragg peaks. In SFX, this is complicated by the unknown degree of partiality of the recorded Bragg peaks and other sources of error in the individual intensity measurements. The indexing ambiguity was resolved using the CrystFEL “ambigator” tool (44), which uses an algorithm related to that devised by Brehm and Diederichs (45), comparing the average Pearson correlation between a single diffraction pattern and every other in the dataset. As expected, approximately half of the 82,603 frames (42,143) were initially indexed inconsistently and were corrected according to the average correlation coefficients (Fig. S3). The Bragg peaks were integrated using the Monte Carlo approach as implemented in CrystFEL (46). The averaged intensities were converted to structure factor amplitudes by Xdsconv (37). Table 1 shows the quality of the final dataset.
Molecular replacement was performed using Phaser (47) using a search model of a homologous polyhedrin with 52.5% sequence identity (PDB ID code 3JVB). The initial model was subjected to automatic model building using phenix.autobuild (48), followed by iterative cycles of manual model (re)building using Coot (49) and refinement with phenix.refine (50). Positive difference density in five previously undefined regions was identified, which enabled us to model a loop region of 15 residues (176–190; KKGFAFPLTCLQSVY); residues 41–43 (IRE), 146–149 (AHPD), and 200–207 (DVLWPYFY); and additional 8 residues (6–13; SLRYSRHD) at the N terminus. All residues of the granulin amino acid sequence but the first five at the N terminus were defined by electron density and were included in the final model. PISA (51) was used to calculate the biological assembly. Electron density maps were generated with Phenix (50), and figures were generated with Pymol.
The high-resolution limit (2 Å) was determined by paired-refinement and correlation coefficient analysis, ensuring CCwork or CCfree did not exceed CC* across the full resolution range (41), as for the synchrotron structure.
Cryo-EM.
Granulovirus OBs at a concentration of 1 × 10¹¹ OBs per mL were adsorbed to glow-discharged lacey-carbon on 300 mesh copper grids (Ted Pella). After 30-s incubation, the grid was blotted for 2 s using a Vitrobot Mark IV (FEI Company) and then immediately plunge-frozen into liquid ethane. The sample was imaged on a Philips CM200 (FEI Company) transmission electron microscope at an accelerating voltage of 200 kV equipped with a TemCam-F416 (TVIPS) CCD detector. Data were collected at a nominal magnification of 50,000× corresponding to a 2.14 Å pixel size and a defocus of around –2.5 μm.
Simulations.
Diffraction simulations were performed using the MOLTRANS software package, developed by E. Weckert (DESY – available upon request). MOLTRANS calculates the scattered amplitude from each atom of the structure arriving at each pixel of the detector. The complex-valued wavefield scattered from all atoms in one individual unit cell is first calculated, from which the wavefield from the entire crystal is determined through a coherent summation that takes the relative positions of different unit cells in the crystal into account. The intensity at the detector has to be scaled according to the incident pulse flux density and the detection efficiency. The incident flux density depends on the pulse energy, the beamline transmission from the position of the pulse energy monitor (60%, depending on KB mirror efficiency), and the area of the beam at the sample. Both the pulse energy and the overlap of the beam with the sample varies from shot to shot. Therefore, simulations were compared with the brightest patterns to find the photon flux in the center of the beam. At the same time, the patterns with very narrow Bragg peaks, corresponding to the particles with a diameter greater than 400 nm, were excluded from this analysis to avoid attributing the effect of the brightest patterns to the small fraction of bigger granulovirus OBs. Such analysis suggests that the X-ray flux density was close to 1012 photons per µm2.
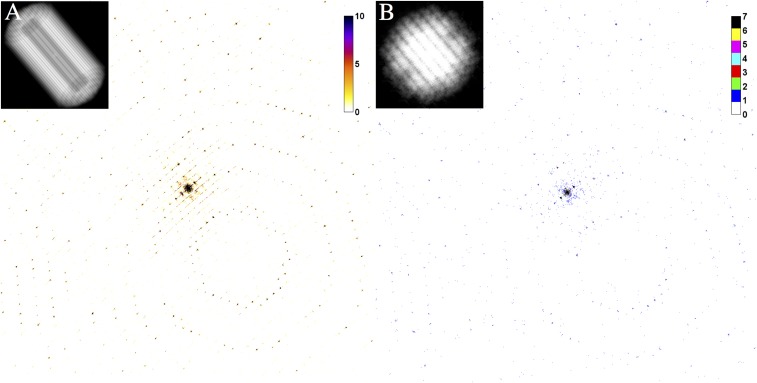
These simulations deliberately omit background scattering and assume an ideal overlap of 1012 photons in a 1-μm2 top-hat X-ray focus with the sample during the exposure. Two different simulations were performed: (i) one dataset calculated for a crystal of 9,000 unit cells, which was used for comparison with the collected data (Fig. S5A), and (ii) one dataset calculated for a very small crystal of spherical shape consisting of 123 unit cells (Fig. S5B).
Fig. S5.
Simulated diffraction patterns of granulin nanocrystals with 9,000 unit cells (A) and 123 unit cells (B). A dose of 1 GGy—color bar indicates the photon count in each pixel. The Inset illustrates the model of the crystals used in the simulations.
For dataset 2, we generated more than 5,000 diffraction patterns from these crystals in random orientation and indexed those (4,350 indexed from 5,043). The fact that indexing was successfully achieved on individual diffraction patterns indicates that such small crystals should be of sufficient size for high-resolution structure determination, given noise-free and background-free detection of the X-ray diffraction patterns.
Discussion
Using submicron-sized (0.01 μm3) naturally occurring granulovirus OBs, where each particle contains only 9,000 unit cells, we have determined the room-temperature structure of granulin to 2-Å resolution using X-ray pulses that imparted a dose of up to 1.3 GGy per crystal. Despite the high dose applied and the small size of the crystals, we obtained a structure of CpGV granulin with good crystallographic statistics (Table 1), revealing features that are absent in the structure of recombinant granulin (Figs. 3 and 4). The final dataset contained 82,603 indexed diffraction patterns. Our analysis clearly shows that averaging over more diffraction patterns improves all figures of merit (Fig. S4), with an improvement of signal-to-noise ratio increasing with the square root of the number of patterns (Fig. 2C).
The 82,603 crystals contributing to the final dataset represent a maximum probed crystalline volume of less than 900 μm3, equivalent to a single cube-shaped crystal of ∼10 μm per side. Room-temperature measurement from a single large crystal of equivalent volume using conventional (rotation) data collection would be severely limited in resolution and completeness, because of radiation-induced damage accumulating over many exposures of a single crystal. Exposing many small crystals to femtosecond-duration X-ray pulses using serial crystallography is possible because of the tolerance of a much higher dose.
Given the high dose per crystal used in the SFX measurements, we looked for evidence of predicted local radiation damage (13, 14) in the vicinity of radiation-sensitive disulfide bonds. Fig. 4 shows that the disulfide bond between the two Cys135 molecules is largely intact in the SFX structure (occupancy 0.68), indicating that the structure is preserved even at sites of atoms that are strongly photo-absorbing, such as sulfur, despite the high dose used in the SFX experiment.
This 2-Å structure, obtained from 0.01 μm3-size crystals, raises the following question: How small is the smallest crystal that could be studied at an XFEL facility? As the crystal size diminishes, so too does the intensity of the Bragg spots, and thus the size of the smallest crystal depends on the number of patterns that can be measured and indexed to build up a sufficiently accurate estimate of the integrated intensity. Assuming that indexing can be carried out, two other parameters that determine the ability to accurately estimate structure factors are the incident pulse flux density and the background level of the diffraction pattern (e.g., from scattering from the jet carrier liquid).
To further study this scaling, we simulated diffraction patterns from a perfect granulin crystal of 9,000 unit cells (Materials and Methods) and compared the average Bragg peak counts from individual diffraction patterns with our measured data. From this comparison we conclude that the incident flux density was of the order of 1012 photons per 1 µm2. A second simulation using the same beam parameters and zero background shows that a crystal of 123 unit cells would be sufficient to produce “indexable” diffraction patterns using the same dose of 1.3 GGy (Fig. S5) and that these data could be assembled into a complete high-resolution dataset given a sufficient number of measurements. Using the same beam parameters and focus size, it might therefore be possible to study crystals with 100 times smaller volume than those studied here, containing as few as 123 unit cells.
Going further, these rough estimates indicate that single-molecule imaging of a protein of molecular weight equal to one unit cell of granulin would require at least a 100–10,000-fold increase in X-ray peak flux density incident on a single unit cell to obtain continuous diffraction pattern with comparable numbers of scattered photons.
Additionally, single-molecule diffraction would require reducing the background scattering to much lower levels than achieved in serial crystallography measurements with a liquid microjet. Indeed, the goal is to achieve background-free injection, where photon-counting statistics are predicted to become the dominant source of error. Additionally, detector performance must be sufficiently well controlled to detect the presence of these particles and determine their orientation. A factor of 100 increase in X-ray intensity (which would impart a dose of 100 GGy) can in principle already be delivered in the 100-nm FWHM focus chamber of the CXI instrument under ideal conditions and perfect focus. Our simple scaling calculations indicate that at least a perfect focus, background-free measurements, and a noise-free detector capable of measuring single photons would be needed to perform single-molecule imaging of larger molecular weight macromolecules at LCLS, properties that are yet to be satisfied both individually and simultaneously.
Under the described limitations and assumptions, it should be possible to reach the border between crystallography and the field of single-particle X-ray imaging at ambient temperatures. Further increasing the flux density in parallel with improved signal-to-noise ratio of the data will open completely novel routes to structure determination of biological molecules at room temperature. The short pulses available from free-electron lasers allow structure determination from crystals much smaller or more radiation sensitive than previously considered possible for study by X-ray diffraction as well as time-resolved experiments on the ultrafast timescale.
Materials and Methods
A more detailed description of the sample preparation and diffraction experiments can be found in SI Materials and Methods.
Synchrotron experiments of recombinantly grown CpGV granulin in vivo crystals were carried out at the microfocus beamline (X06SA) Swiss Light Source, where a total of 21 crystals (77 frames, 1° oscillation per frame) were merged to a final dataset to 1.66 Å resolution.
SFX experiments were carried out at the CXI instrument of LCLS at the SLAC National Accelerator Laboratory. With a repetition rate of 120 Hz, a total of 487,085 diffraction patterns were collected with a CSPAD detector, of which finally 82,603 were indexed using the CrystFEL software package (17). A final dataset was merged with an estimated resolution of 2 Å.
Acknowledgments
We thank Ilme Schlichting, Thomas Barends, Nadrian Seeman, Jens Birktoft, Jennifer Padilla, Nam Nguyen, Michael J. Bogan, Guangmei Huang, Adrian Turner, Chitra Rajendran, Martin Middleditch, James Dickson, Nobuhiro Morone, and John Heuser for their assistance in preparation and during the experiment. We want to especially thank Birgit Weihrauch for her support with sample preparation. Data for this paper were collected during LCLS experiment L767 of Nadrian Seeman. C.G. kindly thanks the Partnership for Innovation, Education, and Research (PIER) Helmholtz Graduate School as well as the Helmholtz Association for financial support. This work was supported by the Science and Technology Center Program of the National Science Foundation through BioXFEL under Agreement 1231306, the National Institutes of Health Award R01GM095583. P.M. thanks The Royal Society of NZ Marsden Grant UOA1221 for financial support. Use of the LCLS, SLAC National Accelerator Laboratory, is supported by the US Department of Energy, Office of Science, Office of Basic Energy Sciences under Contract DE-AC02-76SF00515.
Footnotes
The authors declare no conflict of interest.
This article is a PNAS Direct Submission.
Data deposition: The atomic coordinates and structure factors have been deposited in the Protein Data Bank, www.pdb.org [PDB ID code 5G0Z (SFX structure) and 5G3X (SYN structure)].
This article contains supporting information online at www.pnas.org/lookup/suppl/doi:10.1073/pnas.1609243114/-/DCSupplemental.
References
- 1.Henderson R. The potential and limitations of neutrons, electrons and X-rays for atomic resolution microscopy of unstained biological molecules. Q Rev Biophys. 1995;28(2):171–193. doi: 10.1017/s003358350000305x. [DOI] [PubMed] [Google Scholar]
- 2.Howells MR, et al. An assessment of the resolution limitation due to radiation-damage in x-ray diffraction microscopy. J Electron Spectrosc Relat Phenom. 2009;170(1-3):4–12. doi: 10.1016/j.elspec.2008.10.008. [DOI] [PMC free article] [PubMed] [Google Scholar]
- 3.Holton JM. A beginner’s guide to radiation damage. J Synchrotron Radiat. 2009;16(Pt 2):133–142. doi: 10.1107/S0909049509004361. [DOI] [PMC free article] [PubMed] [Google Scholar]
- 4.Warkentin M, Hopkins JB, Haber JB, Blaha G, Thorne RE. Temperature-dependent radiation sensitivity and order of 70S ribosome crystals. Acta Crystallogr D Biol Crystallogr. 2014;70(Pt 11):2890–2896. doi: 10.1107/S1399004714017672. [DOI] [PMC free article] [PubMed] [Google Scholar]
- 5.Henderson R. Cryo-protection of protein crystals against radiation damage in electron and X-ray diffraction. Proc Biol Sci. 1990;241(1300):6–8. [Google Scholar]
- 6.Garman EF. Radiation damage in macromolecular crystallography: What is it and why should we care? Acta Crystallogr D Biol Crystallogr. 2010;66(Pt 4):339–351. doi: 10.1107/S0907444910008656. [DOI] [PMC free article] [PubMed] [Google Scholar]
- 7.Scheres SH. Beam-induced motion correction for sub-megadalton cryo-EM particles. eLife. 2014;3:e03665. doi: 10.7554/eLife.03665. [DOI] [PMC free article] [PubMed] [Google Scholar]
- 8.Grant T, Grigorieff N. Measuring the optimal exposure for single particle cryo-EM using a 2.6 Å reconstruction of rotavirus VP6. eLife. 2015;4:e06980. doi: 10.7554/eLife.06980. [DOI] [PMC free article] [PubMed] [Google Scholar]
- 9.Neutze R, Wouts R, van der Spoel D, Weckert E, Hajdu J. Potential for biomolecular imaging with femtosecond X-ray pulses. Nature. 2000;406(6797):752–757. doi: 10.1038/35021099. [DOI] [PubMed] [Google Scholar]
- 10.Chapman HN, et al. Femtosecond X-ray protein nanocrystallography. Nature. 2011;470(7332):73–77. doi: 10.1038/nature09750. [DOI] [PMC free article] [PubMed] [Google Scholar]
- 11.Boutet S, et al. High-resolution protein structure determination by serial femtosecond crystallography. Science. 2012;337(6092):362–364. doi: 10.1126/science.1217737. [DOI] [PMC free article] [PubMed] [Google Scholar]
- 12.Barty A, et al. Self-terminating diffraction gates femtosecond X-ray nanocrystallography measurements. Nat Photonics. 2012;6(1):35–40. doi: 10.1038/nphoton.2011.297. [DOI] [PMC free article] [PubMed] [Google Scholar]
- 13.Lomb L, et al. Radiation damage in protein serial femtosecond crystallography using an x-ray free-electron laser. Phys Rev B. 2011;84(21):214111. doi: 10.1103/PhysRevB.84.214111. [DOI] [PMC free article] [PubMed] [Google Scholar]
- 14.Nass K, et al. Indications of radiation damage in ferredoxin microcrystals using high-intensity X-FEL beams. J Synchrotron Radiat. 2015;22(2):225–238. doi: 10.1107/S1600577515002349. [DOI] [PubMed] [Google Scholar]
- 15.Stan CA, et al. Liquid explosions induced by X-ray laser pulses. Nat Phys. 2016 doi: 10.1038/nphys3779. [DOI] [Google Scholar]
- 16.Kirian RA, et al. Femtosecond protein nanocrystallography-data analysis methods. Opt Express. 2010;18(6):5713–5723. doi: 10.1364/OE.18.005713. [DOI] [PMC free article] [PubMed] [Google Scholar]
- 17.White TA, et al. CrystFEL : A software suite for snapshot serial crystallography. J Appl Cryst. 2012;45(2):335–341. [Google Scholar]
- 18.Redecke L, et al. Natively inhibited trypanosoma brucei cathepsin B structure determined by using an X-ray laser. Science. 2013;339(6116):227–230. doi: 10.1126/science.1229663. [DOI] [PMC free article] [PubMed] [Google Scholar]
- 19.Liu W, Wacker D, Wang C, Abola E, Cherezov V. Femtosecond crystallography of membrane proteins in the lipidic cubic phase. Philos Trans R Soc Lond B Biol Sci. 2014;369(1647):20130314–20130314. doi: 10.1098/rstb.2013.0314. [DOI] [PMC free article] [PubMed] [Google Scholar]
- 20.Caleman C, et al. Ultrafast self-gating Bragg diffraction of exploding nanocrystals in an X-ray laser. Opt Express. 2015;23(2):1213–1231. doi: 10.1364/OE.23.001213. [DOI] [PubMed] [Google Scholar]
- 21.Chapman HN, Caleman C, Timneanu N. Diffraction before destruction. Philos Trans R Soc Lond B Biol Sci. 2014;369(1647):20130313. doi: 10.1098/rstb.2013.0313. [DOI] [PMC free article] [PubMed] [Google Scholar]
- 22.Son S-K, Young L, Santra R. Impact of hollow-atom formation on coherent x-ray scattering at high intensity. Phys Rev A. 2011;83(3):33402. [Google Scholar]
- 23.Aquila A, et al. The linac coherent light source single particle imaging road map. Struct Dyn. 2015;2(4):041701. doi: 10.1063/1.4918726. [DOI] [PMC free article] [PubMed] [Google Scholar]
- 24.Zhang H, et al. Structure of the Angiotensin receptor revealed by serial femtosecond crystallography. Cell. 2015;161(4):833–844. doi: 10.1016/j.cell.2015.04.011. [DOI] [PMC free article] [PubMed] [Google Scholar]
- 25.Ginn HM, et al. Structure of CPV17 polyhedrin determined by the improved analysis of serial femtosecond crystallographic data. Nat Commun. 2015;6:6435. doi: 10.1038/ncomms7435. [DOI] [PMC free article] [PubMed] [Google Scholar]
- 26.Gebhardt MM, Eberle KE, Radtke P, Jehle JA. Baculovirus resistance in codling moth is virus isolate-dependent and the consequence of a mutation in viral gene pe38. Proc Natl Acad Sci USA. 2014;111(44):15711–15716. doi: 10.1073/pnas.1411089111. [DOI] [PMC free article] [PubMed] [Google Scholar]
- 27.Rohrmann G. 2013. Baculovirus Molecular Biology (National Center for Biotechnology Information, Bethesda), 3rd Ed. [Google Scholar]
- 28.Coulibaly F, et al. The atomic structure of baculovirus polyhedra reveals the independent emergence of infectious crystals in DNA and RNA viruses. Proc Natl Acad Sci USA. 2009;106(52):22205–22210. doi: 10.1073/pnas.0910686106. [DOI] [PMC free article] [PubMed] [Google Scholar]
- 29.Ji X, et al. How baculovirus polyhedra fit square pegs into round holes to robustly package viruses. EMBO J. 2010;29(2):505–514. doi: 10.1038/emboj.2009.352. [DOI] [PMC free article] [PubMed] [Google Scholar]
- 30.Trillo-Muyo S, et al. Ultratight crystal packing of a 10 kDa protein. Acta Crystallogr D Biol Crystallogr. 2013;69(Pt 3):464–470. doi: 10.1107/S0907444912050135. [DOI] [PMC free article] [PubMed] [Google Scholar]
- 31.DePonte DP, et al. Gas dynamic virtual nozzle for generation of microscopic droplet streams. J Phys D Appl Phys. 2008;41(19):195505. [Google Scholar]
- 32.Weierstall U, Spence JCH, Doak RB. Injector for scattering measurements on fully solvated biospecies. Rev Sci Instrum. 2012;83(3):035108. doi: 10.1063/1.3693040. [DOI] [PubMed] [Google Scholar]
- 33.Gañán-Calvo AM. Generation of steady liquid microthreads and micron-sized monodisperse sprays in gas streams. Phys Rev Lett. 1998;80(2):285–288. [Google Scholar]
- 34.Barty A, et al. Cheetah: Software for high-throughput reduction and analysis of serial femtosecond X-ray diffraction data. J Appl Cryst. 2014;47(Pt 3):1118–1131. doi: 10.1107/S1600576714007626. [DOI] [PMC free article] [PubMed] [Google Scholar]
- 35.Chen VB, et al. MolProbity: All-atom structure validation for macromolecular crystallography. Acta Crystallogr D Biol Crystallogr. 2010;66(Pt 1):12–21. doi: 10.1107/S0907444909042073. [DOI] [PMC free article] [PubMed] [Google Scholar]
- 36.Eberle KE, Wennmann JT, Kleespies RG, Jehle JA. A Manual of Techniques in Invertebrate Pathology. 2nd Ed. Academic Press; San Diego: 2012. pp. 15–74. [Google Scholar]
- 37.Kabsch W. XDS. Acta Crystallogr D Biol Crystallogr. 2010;66(Pt 2):125–132. doi: 10.1107/S0907444909047337. [DOI] [PMC free article] [PubMed] [Google Scholar]
- 38.Evans PR, Murshudov GN. How good are my data and what is the resolution? Acta Crystallogr D Biol Crystallogr. 2013;69(Pt 7):1204–1214. doi: 10.1107/S0907444913000061. [DOI] [PMC free article] [PubMed] [Google Scholar]
- 39.Winn MD, et al. Overview of the CCP4 suite and current developments. Acta Crystallogr D Biol Crystallogr. 2011;67(Pt 4):235–242. doi: 10.1107/S0907444910045749. [DOI] [PMC free article] [PubMed] [Google Scholar]
- 40.Adams PD, et al. PHENIX: A comprehensive Python-based system for macromolecular structure solution. Acta Crystallogr D Biol Crystallogr. 2010;66(Pt 2):213–221. doi: 10.1107/S0907444909052925. [DOI] [PMC free article] [PubMed] [Google Scholar]
- 41.Karplus PA, Diederichs K. Linking crystallographic model and data quality. Science. 2012;336(6084):1030–1033. doi: 10.1126/science.1218231. [DOI] [PMC free article] [PubMed] [Google Scholar]
- 42.Lomb L, et al. An anti-settling sample delivery instrument for serial femtosecond crystallography. J Appl Cryst. 2012;45(4):674–678. [Google Scholar]
- 43.Hart P, et al. 2012. The CSPAD Megapixel X-ray Camera at LCLS, eds Moeller SP, Yabashi M, Hau-Riege, SP (SPIE Press, San Diego) Vol 8054, pp 85040C.
- 44.White TA, et al. Recent developments in CrystFEL. J Appl Cryst. 2016;49(Pt 2):680–689. doi: 10.1107/S1600576716004751. [DOI] [PMC free article] [PubMed] [Google Scholar]
- 45.Brehm W, Diederichs K. Breaking the indexing ambiguity in serial crystallography. Acta Crystallogr D Biol Crystallogr. 2014;70(Pt 1):101–109. doi: 10.1107/S1399004713025431. [DOI] [PubMed] [Google Scholar]
- 46.White TA, et al. Crystallographic data processing for free-electron laser sources. Acta Crystallogr D Biol Crystallogr. 2013;69(Pt 7):1231–1240. doi: 10.1107/S0907444913013620. [DOI] [PMC free article] [PubMed] [Google Scholar]
- 47.McCoy AJ, et al. Phaser crystallographic software. J Appl Cryst. 2007;40(Pt 4):658–674. doi: 10.1107/S0021889807021206. [DOI] [PMC free article] [PubMed] [Google Scholar]
- 48.Terwilliger TC, et al. Iterative model building, structure refinement and density modification with the PHENIX AutoBuild wizard. Acta Crystallogr D Biol Crystallogr. 2008;64(Pt 1):61–69. doi: 10.1107/S090744490705024X. [DOI] [PMC free article] [PubMed] [Google Scholar]
- 49.Emsley P, Lohkamp B, Scott WG, Cowtan K. Features and development of Coot. Acta Crystallogr D Biol Crystallogr. 2010;66(Pt 4):486–501. doi: 10.1107/S0907444910007493. [DOI] [PMC free article] [PubMed] [Google Scholar]
- 50.Afonine PV, et al. Towards automated crystallographic structure refinement with phenix.refine. Acta Crystallogr D Biol Crystallogr. 2012;68(Pt 4):352–367. doi: 10.1107/S0907444912001308. [DOI] [PMC free article] [PubMed] [Google Scholar]
- 51.Krissinel E, Henrick K. Inference of macromolecular assemblies from crystalline state. J Mol Biol. 2007;372(3):774–797. doi: 10.1016/j.jmb.2007.05.022. [DOI] [PubMed] [Google Scholar]


