Significance
Gadolinium (Gd)-based contrast agents (GBCAs) are currently the mainstream clinical MRI contrast agents. Some GBCAs have shown a long-term toxicity—nephrogenic systemic fibrosis (NSF)—and Gd depositions in the brain. The NSF has triggered a Food and Drug Administration (FDA) black-box warning and a contraindication of some GBCAs. The finding of Gd depositions led to an ongoing FDA investigation to monitor their possible long-term adverse effects. Here, we present T1-weighted contrast-enhanced MR imaging and angiography using zwitterion-coated exceedingly small superparamagnetic iron oxide nanoparticles (ZES-SPIONs) in mice and rats. Renal clearance and biodistribution results further demonstrate that ZES-SPIONs are qualitatively different from previously reported SPIONs. This work may open up opportunities to develop exceedingly small SPIONs that show effective T1 contrast as Gd-free alternatives to GBCAs.
Keywords: exceedingly small iron oxide nanoparticles, renal clearance, gadolinium-free positive MR contrast agent, preclinical magnetic resonance imaging
Abstract
Medical imaging is routine in the diagnosis and staging of a wide range of medical conditions. In particular, magnetic resonance imaging (MRI) is critical for visualizing soft tissue and organs, with over 60 million MRI procedures performed each year worldwide. About one-third of these procedures are contrast-enhanced MRI, and gadolinium-based contrast agents (GBCAs) are the mainstream MRI contrast agents used in the clinic. GBCAs have shown efficacy and are safe to use with most patients; however, some GBCAs have a small risk of adverse effects, including nephrogenic systemic fibrosis (NSF), the untreatable condition recently linked to gadolinium (Gd) exposure during MRI with contrast. In addition, Gd deposition in the human brain has been reported following contrast, and this is now under investigation by the US Food and Drug Administration (FDA). To address a perceived need for a Gd-free contrast agent with pharmacokinetic and imaging properties comparable to GBCAs, we have designed and developed zwitterion-coated exceedingly small superparamagnetic iron oxide nanoparticles (ZES-SPIONs) consisting of ∼3-nm inorganic cores and ∼1-nm ultrathin hydrophilic shell. These ZES-SPIONs are free of Gd and show a high T1 contrast power. We demonstrate the potential of ZES-SPIONs in preclinical MRI and magnetic resonance angiography.
MRI signal arises from the excitation of low-energy nuclear spins, which are formed in a permanent magnetic field, by applying radiofrequency pulses followed by the measurement of the spin relaxation processes (i.e., T1 recovery or T2 decay) (1, 2). Different chemical environments as well as water concentration result in different signal strengths and therefore provide contrast between fat, tissue, and bones. Paramagnetic compounds can be used to enhance the contrast of MR images by promoting relaxation of water near the compound. MRI contrast agents are classified as either T1 (i.e., positive) or T2 (i.e., negative). Radiologists strongly prefer T1 contrast agents because T2 contrast shows as darkened areas, which can be difficult to distinguish from internal bleeding, air–tissue boundaries (3), or other susceptibility artifacts, resulting in less accurate patient diagnosis. We also note that progress has been made to generate positive contrast by artificially turning dark and susceptibility-related negative contrast bright (4). Moreover, T1 relaxation times in animal tissues are generally much longer than their T2 relaxation times, meaning that the relaxivity of the T1 contrast agent can be smaller than that for a T2 agent to obtain the same amount of change in image intensity. All gadolinium (Gd)-based contrast agents (GBCAs) (5–9) used in the clinic today are T1 contrast agents (10), whereas GBCAs still have a small risk of adverse effects including nephrogenic systemic fibrosis (11, 12) and Gd deposition in the human brain (13–16).
Superparamagnetic iron oxide nanoparticles (SPIONs) are single-domain magnetic iron oxide particles with hydrodynamic diameters (HDs) ranging from single nanometers to >100 nm (17–19). SPIONs can be monodisperse and coated by biologically compatible ligands, are chemically and biologically stable, and are generally nontoxic in vivo (20). However, commercially available SPION contrast agents are composed of polydisperse inorganic cores with large HD, ranging from ∼16 to ∼200 nm. Generally, large SPIONs function as T2 contrast agents, whereas small SPIONs have limited T2 activity and therefore are potential T1 contrast agents. In addition, due to their large HD, existing SPIONs (21) prevent efficient renal clearance after i.v. administration, greatly differing from GBCA elimination pathways. As a result, large HD SPIONs predominately accumulate in the body (22) and can cause a persistent negative contrast over several weeks or months, which prevents repeated imaging studies and limits the clinical management of patients. Furthermore, current SPION formulations are almost quantitatively metabolized and absorbed into the iron pool with the potential of clinical side effects from iron overload (22). We note that the development and production of existing SPION-based MRI contrast agents, including Resovist, Feridex, Combidex, Supravist, Clariscan (21), and Gastromark (23, 24), has largely ceased. Hence, there is a perceived need for developing Gd-free SPIONs that are exceedingly small for T1-weighted MRI and as a potential substitute for GBCAs. In contrast to previous large HD SPIONs, and to address the perceived need for a Gd-free positive contrast agent, we have designed zwitterion-coated exceedingly small superparamagnetic iron oxide nanoparticles (ZES-SPIONs) with two considerations: (i) optimizing T1 contrast and (ii) enabling renal clearance. Optimizing T1 contrast (25) for SPIONs translates into minimizing the ratio r2/r1 while preserving an absolute r1 value similar to GBCAs, where r2 and r1 are the transverse and longitudinal relaxivities, respectively (26). We achieve this by using the less magnetic maghemite (Fe2O3) structure, which shows a lower magnetization at clinical strength (1.5 T) applied magnetic fields (27, 28), as opposed to the magnetite (Fe3O4) structure (29), and this translates into a correspondingly low T2 effect (30, 31). To enable renal clearance, ZES-SPIONs must have a HD below ∼5.5 nm and show minimal nonspecific interactions (i.e., minimal biofouling) in vivo (32), which renders ZES-SPIONs as ideal candidates for future targeted imaging applications. Most existing SPIONs described for biomedical applications (21) have an HD greater than 7 nm. Hence, there is a perceived need for developing Gd-free SPIONs that are exceedingly small for T1-weighted MRI and enhanced renal clearance as potential substitutes for GBCAs. Here, we show that ZES-SPIONs as T1 contrast agents are indeed qualitatively different from existing SPIONs (21) and indeed approach the performance properties of GBCAs.
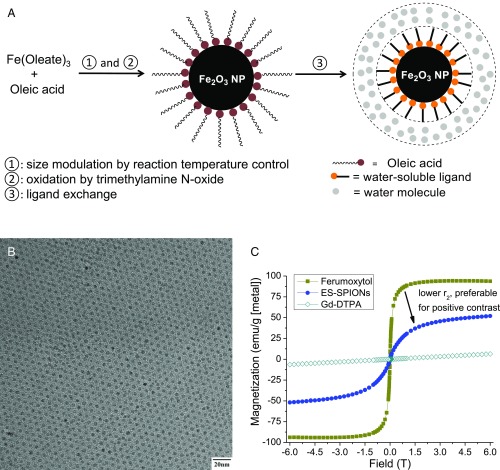
Our SPIONs were synthesized from the thermal decomposition of Fe(oleate)3 in the presence of oleic acid and in solvent mixtures rationally designed for tuning their boiling point. This is followed by oxidation with trimethylamine N-oxide (Fig. 1A) (33). The oxidation step ensures particles with a maghemite structure. Syntheses of SPIONs with a range of ∼2.5- to ∼7.0-nm inorganic core diameters were produced with narrow size distribution by adjusting the solvent mixture boiling point, using mixtures of 1-tetradecene (TDE), 1-hexadecene (HDE), and 1-octadecene (ODE), keeping both the concentration of precursors and growth time constant (Fig. S1) (34, 35). Fig. 1B shows a high-resolution transmission electron microscopy (HR-TEM) image of ∼3.0-nm SPIONs. Relaxivity results at 7 T show that this size provides good T1-weighted MRI signal (Table S1). We characterized the magnetic behavior of ∼3.0-nm SPIONs coated in native ligands at room temperature (298K) using a superconducting quantum interference device (SQUID) and compared it to the commercially available and US Food and Drug Administration (FDA)-approved ferumoxytol (Feraheme), which consists of 3- to 10-nm mixed magnetite/maghemite cores [confirmed by X-ray powder diffraction (XRD) in Fig. S2]. In Fig. 1C, the superparamagnetism of our ∼3-nm SPIONs at room temperature is confirmed by the absence of a hysteresis loops near zero field. Fig. 1C also shows that Gd-DTPA (Magnevist) has a small magnetization (M), desired for T1-weighted MRI. In the range of clinical magnetic field strengths (1.5–3 T), Fig. 1C shows that the M of magnetite-containing ferumoxytol is 94 emu/g [Fe], whereas the M of our ∼3-nm SPIONs is only 35 emu/g [Fe]. Assuming the magnetic volume/field gradient and water-SPION interaction are largely unchanged, this low M would yield a reduced r2 relaxivity and an enhanced T1-weighted MRI signal, a strategy that has been successfully used for doped ferritin-based SPIONs (36).
Fig. 1.
(A) Rationally designed synthetic route of ZDS-coated SPIONs, (B) HR-TEM images of SPIONs with ∼3.0-nm inorganic core diameter, and (C) SQUID curves of 3-nm ES-SPIONs, ferumoxytol (Feraheme), as well as Gd-DTPA (Magnevist).
Fig. S1.
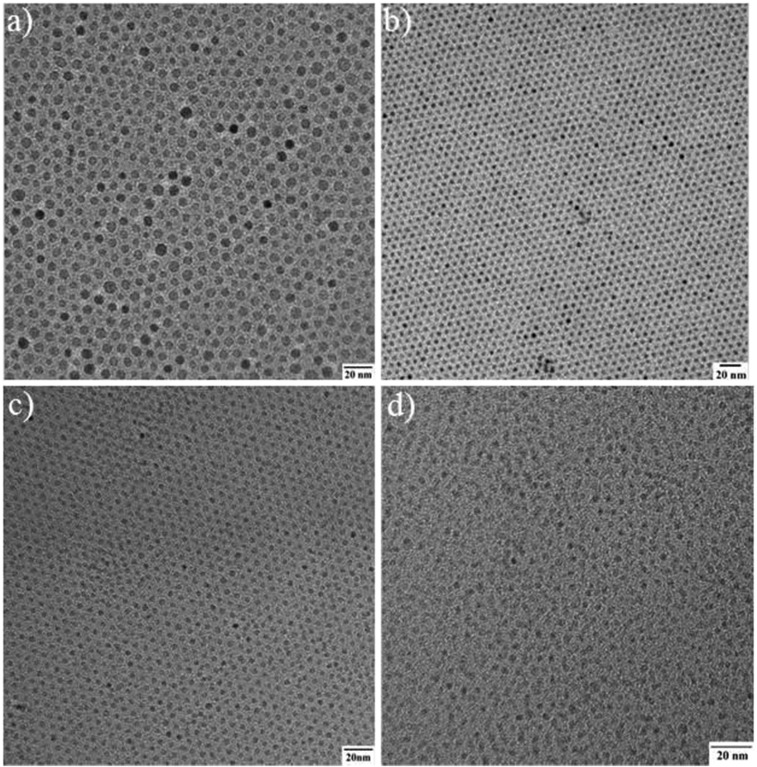
(A–D) TEM images of SPIONs with ∼7.0-, 5.5-, 3.0-, and 2.5-nm core diameters, respectively.
Table S1.
r1 and r2 relaxivity measurements of a series of iron oxide nanoparticles at 7 T
| Nanoparticles | Core, nm | r1, s−1⋅mM−1 | r2, s−1⋅mM−1 | r2/r1 |
| Feraheme | ∼3–10 | 3.1 | 68 | 22 |
| Our SPIONs | ∼7 | 3.4 | 60 | 18 |
| Our SPIONs | ∼5.5 | 2.9 | 51 | 18 |
| Our SPIONs | ∼3 | 1.5 | 17 | 11 |
| Our SPIONs | ∼2.5 | 1.3 | 17 | 13 |
Fig. S2.
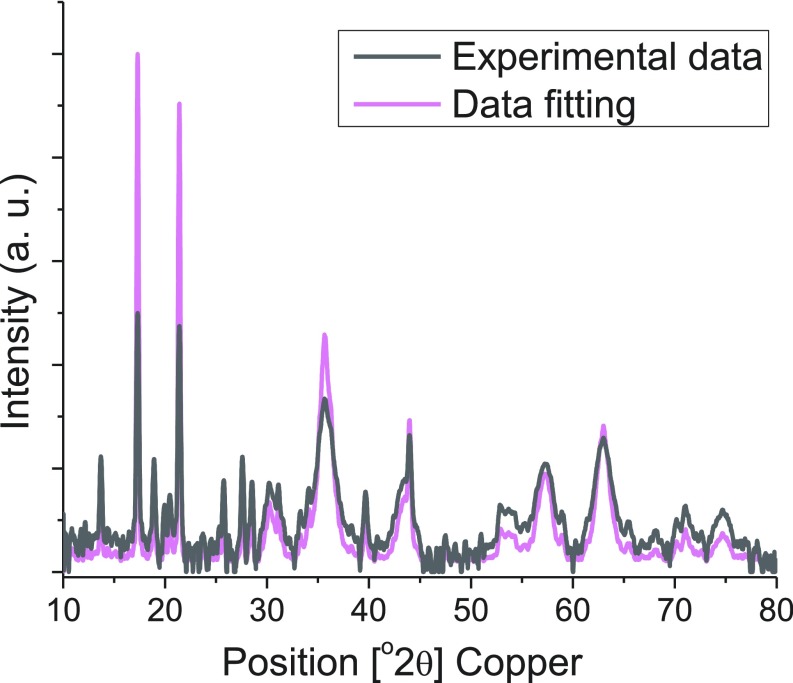
XRD of ferumoxytol.
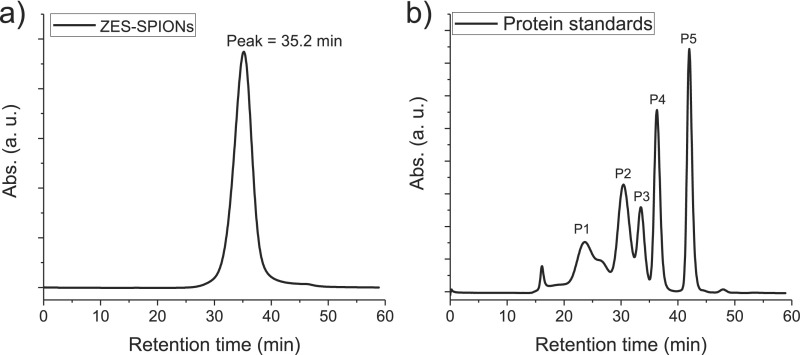
After synthesizing the above inorganic core SPIONs, the native hydrophobic oleic acid coating was exchanged with a zwitterionic dopamine sulfonate (ZDS) that we have previously developed and described (35, 37). Our prior studies have demonstrated that ZDS-coated SPIONs show small HDs, low nonspecific interactions in vitro with cells and in vivo in mice, offering the opportunity for specific labeling, and stability with respect to time, pH, and salinity. Moreover, ZDS-coated SPIONs can retain the magnetic properties of as-synthesized hydrophobic SPIONs, making them useful for MRI. The biocompatibility of ZDS was also confirmed by other research groups on several types of nanoparticles (10, 38, 39). Fig. S3 shows the result of using HPLC with a size exclusion column to determine the HD of ∼3-nm core particles coated with ZDS (ZES-SPIONs), giving an average HD of 4.7 nm.
Fig. S3.
(A) GFC curve of ZDS-coated SPIONs with 3-nm inorganic core diameters (ZES-SPIONs) and (B) the calibration curve of HD vs. retention time by using protein standards.
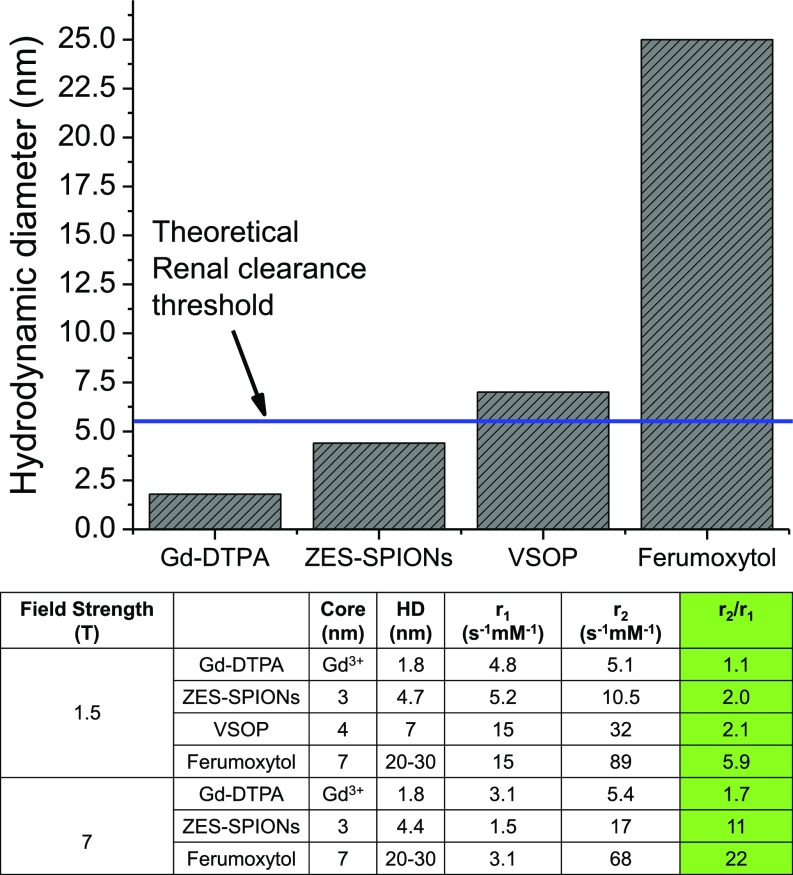
To quantitatively evaluate (40) the T1 contrast power of ZES-SPIONs and differentiate it with previously reported agents, we compare the r1 and r2 values of ZES-SPIONs and other types of T1 contrast agents (3, 30, 41). The data for ferumoxytol (42, 43), very-small iron oxide nanoparticles (VSOPs) (44), as well as Gd-DTPA (Magnevist) (24, 45) are either measured or taken from the published literature. As shown in Fig. 2, at 1.5 T, which is the field strength of most clinical MRI scanners, ZES-SPIONs with a 3-nm inorganic core and a 4.7-nm HD have an r1 of 5.2 s−1⋅mM−1 and r2 of 10.5 s−1⋅mM−1, leading to an r2/r1 of 2.0, which is three times smaller than the r2/r1 of the commercially available SPION-based ferumoxytol. The r2/r1 of ZES-SPIONs is slightly lower and therefore slightly better than that of VSOP (44), a state-of-the-art SPION-based T1 contrast agent. The r2/r1 of our ZES-SPIONs is more preferable than that of other SPION-based MRI contrast agents including Feraheme, Resovist, Feridex, Combidex, Supravist, Clariscan, and others (3, 8, 9, 21, 46, 47). Furthermore, as shown in Fig. 2, the r2/r1 of ZES-SPIONs at 1.5 T is within a factor of 2 to that of gadolinium-based chelates (GBCAs) such as Gd-DTPA. Crucially, not only do our ZES-SPIONs show a more promising r2/r1 than previous SPIONs, but they are also smaller and qualitatively different; unlike previous SPION-based T1 contrast agents, the HD of ZES-SPIONs falls below the effective, expected renal clearance cutoff (i.e., the glomerular filtering threshold) of ∼5.5 nm as detailed below (32). The HD of ZES-SPIONs is 4.7 nm, which is approximately two times smaller than the HD of VSOP, and approximately six times smaller than the HD of ferumoxytol, respectively (Fig. 2).
Fig. 2.
HD and T1 contrast power of different contrast agents (ferumoxytol, Feraheme; Gd-DTPA, Magnevist; VSOP, very small iron oxide nanoparticles; ZES-SPIONs, zwitterion-coated exceedingly small iron oxide nanoparticles).
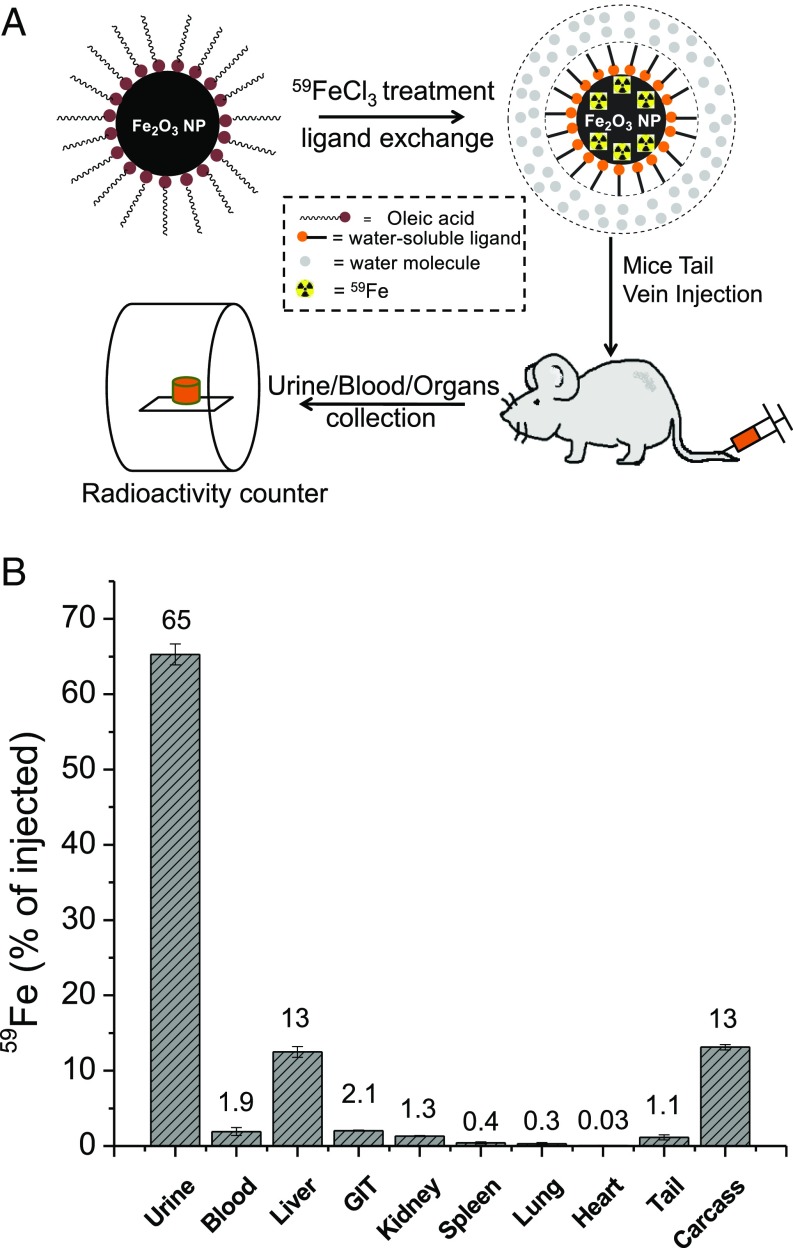
To assess the in vivo stability of our ZES-SPION formulation, we designed and performed a biodistribution experiment using 59Fe radioisotope-labeled ZES-SPIONs. As shown in Fig. 3A, ES-SPIONs were first labeled with 59Fe (48) and then ligand exchanged with ZDS. The resulting radioactive ZES-SPIONs were analyzed by gel filtration chromatography (GFC) equipped with a size exclusion column, which showed the simultaneous elution of high radioactivity and ZES-SPIONs, indicating the successful incorporation of 59Fe. The 59Fe-labeled ZES-SPIONs were i.v. injected into mice. After 4 and 24 h, the urine and feces were collected and separated, and the 59Fe concentration was measured by a radioactivity counter. As reported in Fig. 3B, 65 ± 1.4% of the injected 59Fe-labeled ZES-SPIONs was renally cleared (most of it within 4 h). Organs and blood were collected 24 h postinjection, and the 59Fe activity was measured to determine the biodistribution. Fig. 3B shows that, 24 h after injection, 13 ± 0.70% of the injected 59Fe remained in the liver. However, the combination of blood, spleen, kidney, lung, gastrointestinal tract, heart, and tail had around 12%. The remaining carcass had around 13% of the injected 59Fe. These results suggest that the majority of ZES-SPIONs are cleared through the renal route.
Fig. 3.
(A) Schematic of mouse biodistribution study using 59Fe-labeled ZES-SPIONs, and (B) the percentages of 59Fe-labeled ZES-SPIONs that stay in urine, blood, and organs, compared with the total amount of 59Fe-labeled ZES-SPIONs injected (GIT, gastrointestinal tract). After 24 h following injection, 12.5 ± 0.7% of the injected 59Fe-labeled ZES-SPIONs remained in the liver. The combination of blood, spleen, kidney, lung, gastrointestinal tract, heart, carcass, and tail had less than 25% of the injected 59Fe-labeled ZES-SPIONs.
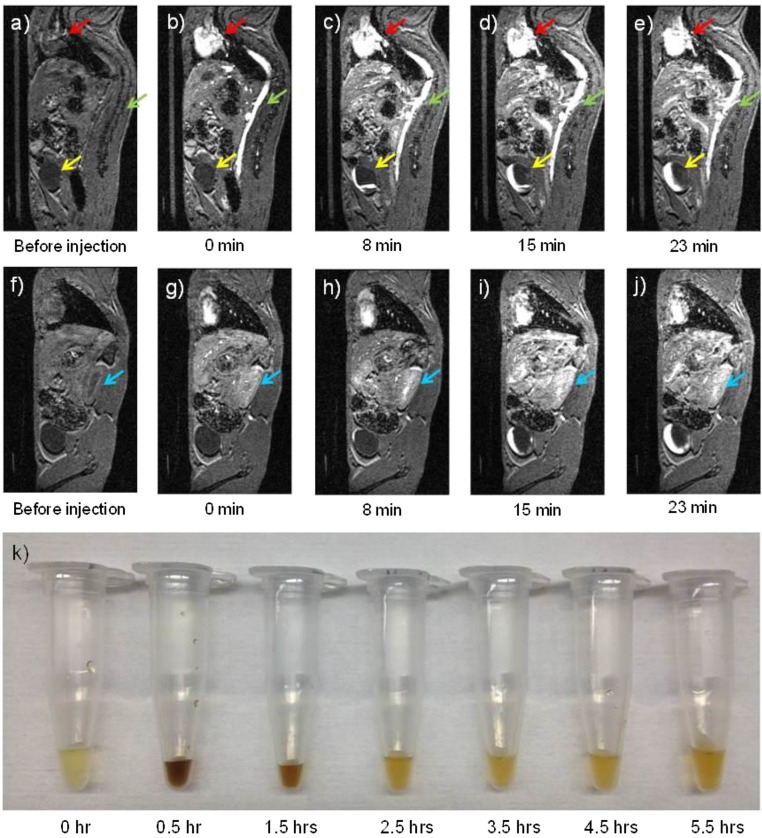
To further visualize renal clearance, our ZES-SPIONs were i.v. injected into mice and their urine was collected at different time points. Fig. 4K shows normal urine color before injection. At 30 min and 1.5 h postinjection, the urine becomes dark brown, which is characteristic of ZES-SPIONs elution. After 2.5 h postinjection, the urine returns to its normal yellow color, indicating that the particle excretion happens mostly within the first 2.5 h, which is in agreement with the radioactive biodistribution data. Moreover, we performed relaxivity measurements on the ZES-SPIONs that were renally cleared (Table S2). The results show that the ZES-SPIONs in urine have an r2/r1 of 1.9, very close to the r2/r1 of ZES-SPIONs in PBS before injection. Together, these results indicate that ZES-SPIONs clear through the kidney efficiently as particles and their MR contrast power remains largely unchanged.
Fig. 4.
(A–J) T1-weighted MR images of a mouse injected with ZDS-coated exceedingly small SPIONs (ZES-SPIONs) at 7 T. Time points underneath each image: the time after ZES-SPIONs injection: (A–E) one sagittal slice showing the heart (red arrow), the vena cava (green arrow), and the bladder (yellow arrow), and (F–J) another sagittal slice showing the kidney (blue arrow); (K) urine samples from mice taken at different time points after injection showing renal clearance of ZES-SPIONs in vivo. Before the injection of ZES-SPIONs, the heart (red arrow), the vena cava (green arrow), and the bladder (yellow arrow) do not show appreciable positive contrast. After injection, the heart and the vena cava display high positive contrast immediately after injection. At 8 min after injection, the bladder displays some positive contrast, indicating an excretion of urine containing ZES-SPIONs. With the increase of time postinjection, Fig. 4 D and E shows that the positive contrast region of the bladder increases, suggesting an accumulation of urine with ZES-SPIONs.
Table S2.
r1 and r2 relaxivity measurements of ZES-SPIONs (3-nm core and 4.7-nm HD) at 7 T
| Nanoparticles | Batch no. | r1, s−1⋅mM−1 | r2, s−1⋅mM−1 | r2/r1 |
| ZES-SPIONs in PBS | ① | 5.0 | 9.9 | 2.0 |
| ZES-SPIONs in PBS | ② | 4.1 | 7.8 | 1.9 |
| ZES-SPIONs in PBS | ③ | 6.6 | 13.8 | 2.1 |
| Average of ①, ②, and ③ | 5.2 | 10.5 | 2.0 | |
| ZES-SPIONs in urine | ③ | 4.7 | 9.1 | 1.9 |
Next, we demonstrate the preclinical potential of our ZES-SPIONs as positive contrast agent for MR imaging (49, 50) in an animal model. We used a MRI scanner to image mice injected with ZES-SPIONs at a concentration of 0.2 mmol [Fe]/kg, comparable to the concentrations of GBCAs (∼0.1–0.25 mmol [metal]/kg) administered in the clinic. The T1-weighted MR images of one of the mice are shown in Fig. 4 and in Movies S1–S3. Fig. 4A shows a sagittal slice before the injection of ZES-SPIONs. Before injection the heart (red arrow), the vena cava (green arrow) and the bladder (yellow arrow) do not show appreciable positive contrast, as expected. Fig. 4B shows that the heart and the vena cava display strong positive contrast immediately after injection. Fig. 4C shows that, at 8 min after injection, the bladder displays some positive contrast, indicating an excretion of ZES-SPIONs. With the increase of time postinjection, Fig. 4 D and E show that the positive contrast in the bladder increases, suggesting an accumulation of ZES-SPIONs (see Movies S1–S3 and Fig. S4 for additional rat and mouse MRI data).
Fig. S4.
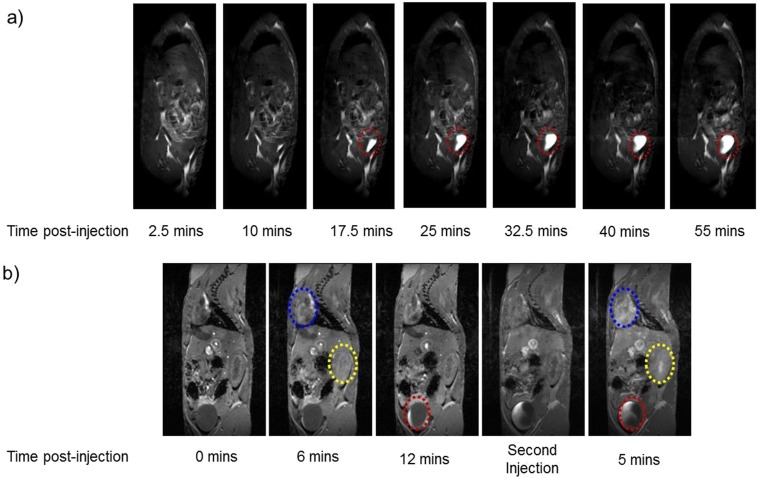
T1-weighted MRI in vivo in (A) rat and (B) mouse (heart, blue oval; kidney, yellow oval; bladder, red oval) injected with ZES-SPIONs.
Fig. 4 F–J show a different sagittal slice at the same time points. Fig. 4F shows the absence of contrast before injection for the kidney (blue arrow). Immediately after injection, the kidney displays strong positive contrast enhancement. With increasing time postinjection, Fig. 4 G–J demonstrates continuing positive contrast enhancement in the kidney (Fig. S5A). These results suggest that our ZES-SPIONs can clear through the kidney at a rate that is consistent with the timescales used in multiphase dynamic imaging. Previously reported SPIONs have all have HDs that are larger than 5.5 nm, whereas the ZES-SPIONs here have a qualitatively smaller HD of 4.7 nm, which is smaller than the glomerular filtering threshold.
Fig. S5.
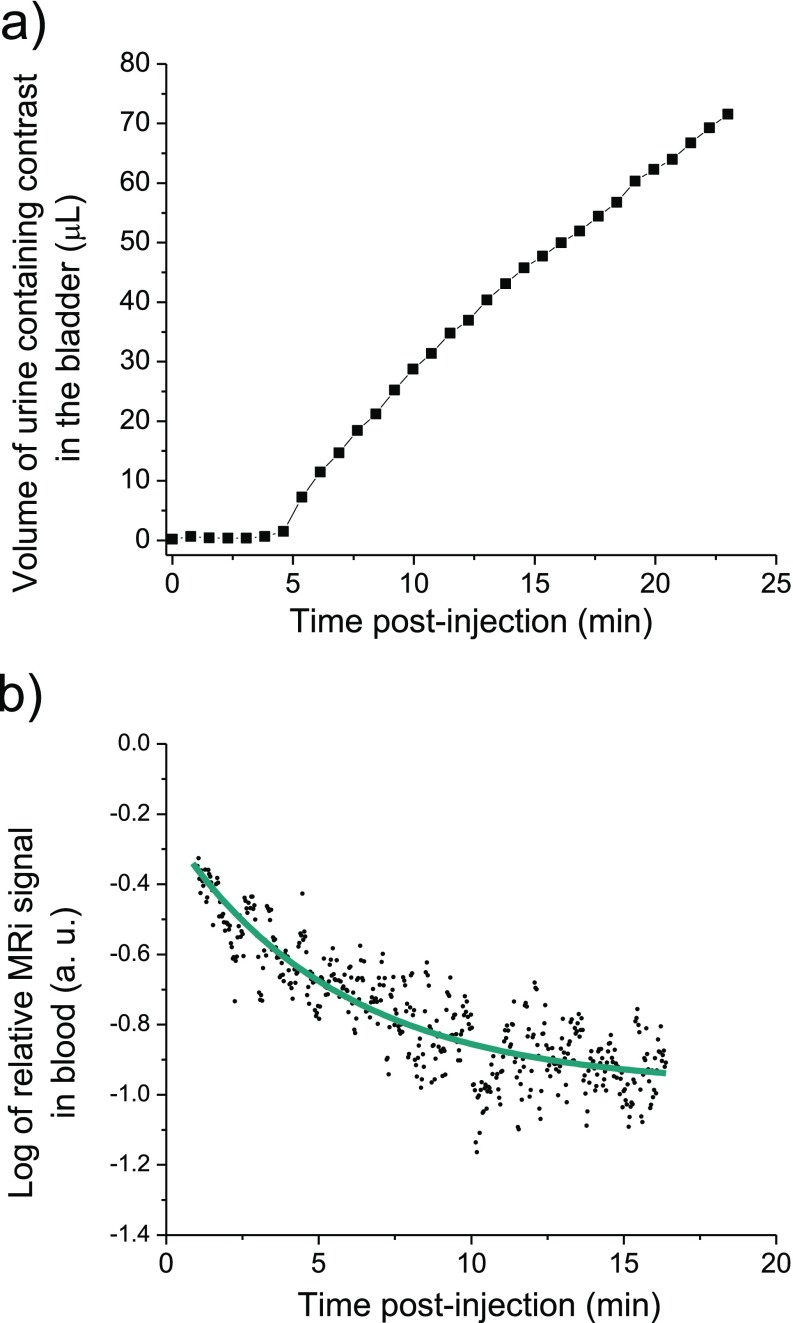
(A) The volume of urine containing contrast in the bladder of a mouse injected with ZES-SPIONs vs. time measured by MRI and (B) the decay of the log of relative MRI signal (T2*) in mice blood after particles injection.
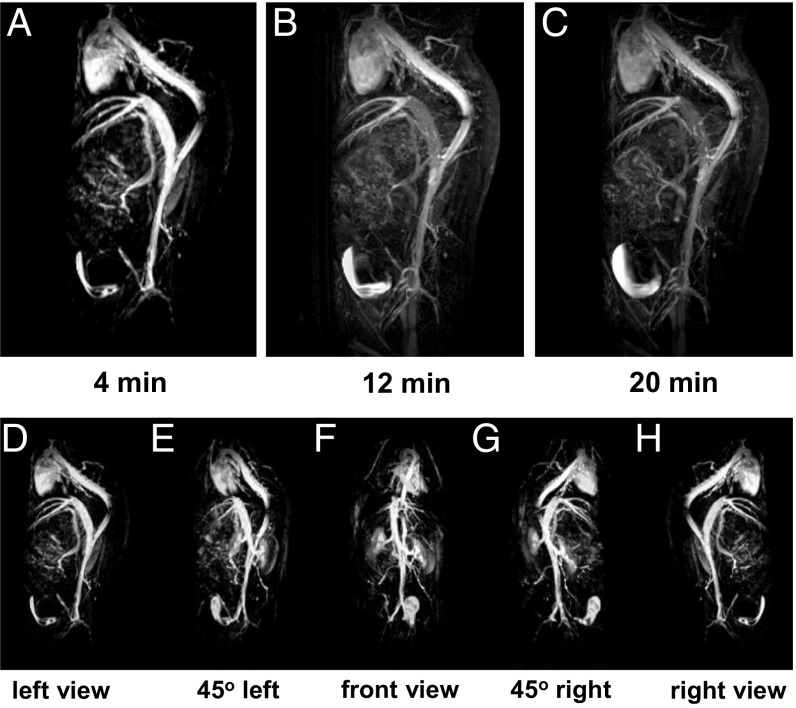
We further demonstrate the future preclinical potential of our ZES-SPIONs in T1-weighted magnetic resonance angiography (MRA), an important clinical use of T1-weighted contrast (51). Fig. 5 A–C shows MRA of a mouse injected with ZES-SPIONs at different time points. Due to the strong T1 contrast and a circulation time that is sufficiently long, the blood vessels in this MRA study can be imaged with a spatial resolution of ∼0.2 mm. Fig. 5 A–C shows strong positive contrast of the heart and blood vessels, which fades in time while the signal from the bladder increases, again consistent with a renal excretion pathway. The application of ZES-SPIONs as a blood pool agent can be further described by comparing signal-to-noise ratios (SNRs) in the vascular system and the less perfused tissues. Fig. 5 D–H shows different spatial perspectives of the MRA extracted from a three-dimensional (3D) scan (see Movies S4 and S5 for the full 3D scan). Here, contrast-to-noise ratio (CNR) between blood in the vena cava and muscle tissue increases from 4 (before injection) to 55 (after injection). The initial SNRs were 13 for blood and 9 for muscle, respectively; and after ZES-SPION administration, the SNRs were 65 and 10, respectively, showing a relative signal enhancement of fivefold in blood and essentially no pronounced signal enhancement in muscle. We note here also that the longer circulation times (the half-life in blood is ∼19 min, which was measured by monitoring the T2* signal over time as shown in Fig. S5B) of ZES-SPIONs relative to the very rapid clearance of some Gd-based contrast agents such as Gd-DTPA (∼2 min blood half-life) may provide an advantage in angiography. Moreover, the blood half-life of ZES-SPIONs is comparable to that of Gadofosveset [Ablavar; ∼23 min (52)], a type of GBCA used for angiography. In addition, our future efforts will be geared toward the development of targeted formulations based on the presented ZES-SPIONs, such as by using thiol-maleimide conjugation strategies.
Fig. 5.
(A–C) T1-weighted magnetic resonance angiography (MRA) of a mouse injected with ZDS-coated exceedingly small SPIONs (ZES-SPIONs) at 7 T. The time points beneath each image are the time after injection of the ZES-SPIONs. (D–H) Five different perspectives of the MRA, which are extracted from the 3D scan, at the 4-min mark. A clear positive contrast of the heart and blood vessels are seen, and this positive contrast fades in time while the signal from the bladder increases, consistent with a renal excretion pathway.
In summary, our results demonstrate that ZES-SPIONs have a small enough HD to show kidney clearance, and that their T1 contrast power is high enough that these particles can be used for MRA and conventional positive MRI contrast. This is an example of a class of Gd-free MRI contrast agents that could be used for MRA in a way that is similar to the GBCAs. Furthermore, unlike existing SPION-based MRI contrast agents, which exhibit prolonged contrast and a potential for iron overload, the pharmacokinetic properties of ZES-SPIONs are such that long-term contrast changes may be avoided, and the iron dose that remains in the body can be kept in a safe range. This material system can be the basis for developing positive Gd-free MRI contrast agents as alternatives to GBCAs in the clinic.
Materials and Methods
Chemicals were obtained from Sigma-Aldrich and used as received unless specified. Air-sensitive materials were handled under dry nitrogen atmosphere with oxygen levels <0.2 ppm in an Omni-Lab VAC glove box. All solvents were purchased from EMD Biosciences and spectrophotometric grade. TEM images and energy-dispersive X-ray spectroscopy (EDX) of the SPIONs were obtained with a JEOL 200CX electron microscope operated at 120 kV and a JEOL 2010 electron microscope operated at 200 kV. ζ-Potential measurements were performed on a Malvern Instruments Nano-ZS90. Magnetization measurements were performed on a Quantum Design MPMS-XL SQUID. Mice for urine study were acquired from Charles River Laboratories International, and they were housed in the Division of Comparative Medicine at Massachusetts Institute of Technology in an Association for Assessment and Accreditation of Laboratory Animal Care-accredited facility. All mice were studied in accordance with approved institutional protocols at Massachusetts Institute of Technology and University Medical Center Hamburg–Eppendorf. Mice and rats were anesthetized by either i.p. injection of ketamine and xylazine or inhalation of isoflurane and oxygen gas. Additional experimental details about synthesis, characterizations, relaxivity measurements, and MR imaging are provided in Supporting Information.
Synthesis of SPIONs
Using ∼3-nm SPIONs as an example, 0.900 g of Fe(oleate)3 and 190 µL of oleic acid were added into a mixture of 4.0 mL of 1-tetradecene and 1.0 mL of 1-hexadecene at room temperature (RT). After 30-min degassing at 100 °C, the temperature of reaction mixture was rapidly increased to a final temperature of 270 °C, and then kept constant for 1 h. Then the reaction mixture was allowed to cool to RT upon the completion of the reaction, followed by the addition of 0.113 g of (CH3)3NO oxidizing agent (33). The reaction temperature was then increased to 130 °C and held constant for 1 h to fully oxidize the particles. The reaction mixture was then allowed to cool to RT. Approximately 40 mL of acetone was added, and the resulting mixture was centrifuged. The supernatant was then discarded and the SPION pellet was dispersed and stored in hexane. Energy-dispersive X-ray spectroscopy (EDX) results show that ∼3-nm SPIONs have 18.33% Fe and 81.67% O (by weight), where the excess amount of oxygen should be from organic ligands.
Organic Ligands and Ligand Exchange
Zwitterionic dopamine sulfonate (ZDS) (Mr: ∼300 g/mol) was synthesized and ZDS-coated SPIONs were prepared according to the protocol in the supporting information in a previously published manuscript (37). The ζ-potential of ZDS-coated ∼3-nm SPIONs was measured to be −5.02 ± 0.20 mV, which is almost neutral.
Gel Filtration Chromatography and Hydrodynamic Diameter Measurements
Gel filtration chromatography (GFC) measurements with a size-exclusion column were done by using the protocols in our prior publications (35, 37). After being filtered by Whatman 0.02-µm filter, ZDS-coated ∼3.0-nm core SPIONs [zwitterionic dopamine sulfonate-coated exceedingly small SPIONs (ZES-SPIONs)] in PBS (pH 7.4) have a narrow size distribution with a retention time peak of 35.2 min, as shown in Fig. S3A. In Fig. S3B, after calibrating the size-exclusion column with protein standards (Bio-Rad; catalog #151-1901) containing thyroglobulin [P1, hydrodynamic diameter (HD) = 18.8 nm], γ-globulin (P2, HD = 11.1 nm), ovalbumin (P3, HD = 6.1 nm), myoglobin (P4, HD = 3.8 nm), and vitamin B12 (P5, HD = 1.67 nm), it can be found that the relationship between retention time (in minutes) and HD (in nanometers) is as follows: HD = −80.6291 + 11.79692*time − 0.43275*time2 + 0.00473*time3. Therefore, a retention time peak of 35.2 min corresponds to an averaged HD of 4.7 nm. These results suggest that the ZDS ligand only contributes ∼1 nm to the overall radius, and the size change induced by the ZDS ligand and their stability are consistent with our prior study (35, 37); in particular, these ZDS-coated SPIONs can have a HD smaller than the ∼5.5-nm threshold for efficient renal clearance (32).
In Vitro MR Relaxivity Measurements at 7 T
The r1 and r2 relaxivities of our ZDS-coated SPIONs were measured on a 7-T MRI scanner to evaluate their performance as T1 contrast agents (40). Samples were linearly diluted in PBS (pH 7.4) to span concentrations. SPION dilutions were then added to the center of a 384-well microtiter plate (BD Falcon). Remaining wells were filled with PBS to reduce susceptibility-based image artifacts and improve shimming efficiency. Relaxivity data were collected at ambient temperatures on a Bruker Avance III 7T MRI scanner with a 20-cm bore and using a Bruker Biospin MRI coil. A 2-mm horizontal slice was imaged through the center of the filled wells with a spin echo pulse sequence using a 10-ms echo time (TE) and a 73-ms to 3-s repetition time (TR = 73, 116, 186, 298, 477, 763, 1,220, 1,953, and 3,125 ms) to collect T1 relaxation times. Meanwhile, TE = 10 ms, 30 echos, and TR = 3,125 ms were used to collect T2 relaxation time. Thirty time points of 2D Carr–Purcell–Meiboom–Gill (CPMG) echo images (TE = 10–300 ms with 10-ms interval) were collected as 256 × 256-point matrices. All data were subsequently analyzed using custom Matlab (Mathworks) routines. The echo time vs. integrated intensity from imaged wells was fit to an exponential to obtain transverse (R2) and longitudinal (R1) relaxation rates for each sample. The reported relaxivities, r1 and r2, are computed from the slope of the relationship between relaxation rate and iron concentration for each sample dilution. As shown in Table S1, the r2/r1 ratio of our ZDS-coated SPIONs can be tuned between 11 and 18 at 7 T, and the r2/r1 ratio of Feraheme is 22 at 7 T.
MR Relaxivity Measurements at 1.5 T and Mouse Urine Study
The relaxivity measurements were performed on a 1.5-T (clinical magnetic field strength) bench-top Bruker minispec relaxometer, and the results were averaged based on three batches of ZES-SPIONs that were individually synthesized using the same protocol. After relaxivity measurements, ZES-SPIONs were digested by hydrochloric acid and their iron concentrations were determined by bathophenanthroline assay according to the protocols in our previous publication (3). As shown in Table S2, batch ① (e.g., used for MRI and MR angiography): r1 = 5.0 mM−1⋅s−1, r2 = 9.9 mM−1⋅s−1, r2/r1 = 2.0; batch ② (e.g., used for 59Fe-labeled biodistribution): r1 = 4.1 mM−1⋅s−1, r2 = 7.8 mM−1⋅s−1, r2/r1 = 1.9; batch ③ (e.g., used for mouse urine study): r1 = 6.6 mM−1⋅s−1, r2 = 13.8 mM−1⋅s−1, r2/r1 = 2.1. Therefore, on average, the relaxivities of ZES-SPIONs at 1.5 T in PBS are as follows: r1 = 5.2 mM−1⋅s−1, r2 = 10.5 mM−1⋅s−1, r2/r1 = 2.0. Moreover, in a mouse urine study, ZES-SPIONs (batch ③) were i.v. injected into four mice separately, and their urine was collected after 2.5 h. The relaxivities of ZES-SPIONs in urine (after renal clearance) were again measured on a 1.5-T bench-top Bruker minispec relaxometer, and their iron concentrations were also determined, yielding the results: r1 = 4.7 mM−1⋅s−1, r2 = 9.1 mM−1⋅s−1, r2/r1 = 1.9. During the iron determination process of urine samples, we note that the acidified mouse urine generally forms white precipitates and has a brown color of supernatants, upon the addition of hydrochloric acid. So the as-determined iron concentrations of urine samples may include some systematic errors, and therefore we use the r2/r1 ratio, which is independent of iron concentration results, for comparison.
In Vivo MRI of Rat (Fig. S4A) and Mouse (Fig. S4B)
MRI studies were accomplished using small-animal MRI systems at 7 T (Bruker) with a mouse body coil and at 9.4 T (Bruker) with a rat body coil. The dosage was 0.2 mmol [Fe]/kg animal. Mice and rats were anesthetized by the inhalation of 98% oxygen and 2% isoflurane (500 mL/min). The respiration rate was maintained at 30 beats per min by adjusting the concentration of isoflurane, and mice and rats were kept warm at ∼37 °C in the experiments. Respiration gating on MRI was enabled by the use of a pressure pad (SA Instrument). On the 7-T scanner, sagittal 3D spoiled gradient echo sequence (FLASH) was used: field of view (FOV), 50 mm × 29.7 mm; matrix, 256 × 152; number of slices, 10; slice thickness, 220 µm; TR = 6 ms; TE = 2 ms; flip angle, 30°; number of average, 1; dynamics, 40; resulting in a scan time of 30 min by a temporal resolution of 46 s per 3D volume and a voxel size 195 × 195 × 220 µm3. For scanning at 9.4 T, the following parameters were used: multi slice multi echo sequence (MSME); FOV, 120 mm × 120 mm; matrix, 256 × 256; spatial resolution, 469 × 469 µm; number of slices, 12; slice thickness, 2 mm; TR = 298 ms; TE = 10.7 ms; flip angle, 166.5°; number of averages, 2; scan time per image, 2 min, 32.6 s. Eight scans were collected and were spaced 5 min apart for the total experiment time of ∼1 h. By using MRI scanners, the T1-weighted MR images of rat and mouse injected with ZES-SPIONs are shown in Fig. S4. It can be seen in Fig. S4A that ZES-SPIONs first circulate in the blood vessels and that, beginning at 10 min postinjection, ZES-SPIONs begin to accumulate in the bladder (red oval) showing strong positive contrast, indicating a renal clearance and a high T1 contrast. A similar phenomenon was observed in mouse with a 7-T MRI scanner: in Fig. S4B, at 6 min postinjection, ZES-SPIONs are observed in the heart (blue oval) and kidney (yellow oval), showing positive contrast. At 12 min postinjection, ZES-SPIONs begin to accumulate in the bladder (red oval). After the ZES-SPIONs are cleared from heart and kidney, a second injection of ZES-SPIONs was introduced. At 5 min post-second injection, ZES-SPIONs are again observed in the heart (blue oval) and kidney (yellow oval).
SNR was measured by the mean signal intensity of a region of interest divided by the SD in air. CNR is the difference of two SNR values. Relative signal enhancement is the signal intensity change due to the injection divided by the signal intensity before the injection. In Fig. 4 angiography data, the brightness in the images was adjusted by using the auto window function of ImageJ by putting a region of interest over the aorta descendants and the surrounding tissue: baseline images were averaged and used to be subtracted from the images to produce background-free images. In the next step, maximum intensity projections under various view angles were produced.
Quantitative Analysis of Mouse Urine with Contrast in the Bladder
A quantitative analysis was performed on the MRI scan in Fig. 4 A–J. For a specific time point, the area of urine (region of interest with positive contrast) was first calculated for each sagittal slice and then multiplied by the thickness of one sagittal slice (220 μm); the volume of urine with contrast is given by the sum of the results of all sagittal slices. Fig. S5A shows that iron oxide nanoparticles begin to accumulate in the bladder at 5 min, increasing until the last time point at 23 min. The volume of urine with contrast is expected to decrease upon the excretion of urine at later time points, as shown in Fig. 4K. Fig. S5B reports that the blood half-life of ZES-SPIONs in mice is ∼19 min.
Quantitative Biodistribution of ES-SPIONs by 59Fe Labeling
Incorporation of 59Fe into the PEG-coated ES-SPION (intermediate ligand during ligand exchange) was performed according to previously published methods (48). 59Fe incorporation into the ES-SPION inorganic core was confirmed by GFC, which showed radioactivity solely in the fraction containing ES-SPIONs. Five mice received tail vein injection of 0.02 mmol [Fe]/kg of radiolabeled ES-SPIONs followed by whole-body and cage radioactivity measurement at 4 and 24 h, during which time mice were awake. After 24 h, mice were euthanized in accordance with approved institutional protocols at University Medical Center Hamburg-Eppendorf, and organs were harvested for individual organ radioactivity measurements.
XRD of Ferumoxytol
XRD measurement was performed on ferumoxytol (>2-y shelf life) by using a PANalytical X’Pert Pro platform. Its composition was analyzed by PANalytical HighScore Plus software, yielding the result of 68% magnetite and 32% maghemite. This result suggests that the majority of ferumoxytol is magnetite, which remained stable in air over an extended period.
Supplementary Material
Acknowledgments
H.W. thanks Dr. Yong Zhang for his assistance with acquiring transmission electron microscopy images and Patrick Boisvert for his help with SQUID measurements. This work was supported by Massachusetts Institute of Technology (MIT)–Harvard NIH Center for Cancer Nanotechnology Excellence Grant 1U54-CA119349 (to M.G.B.), the Army Research Office through the Institute for Soldier Nanotechnologies (Grant W911NF-07-D-0004, to M.G.B.), the NIH-funded Laser Biomedical Research Center through Grant 9-P41-EB015871-26A1 (to M.G.B.), the MIT Deshpande Center Innovation Grant (to M.G.B.), NIH Grants R01-MH103160 and R01-DA028299 (to A.J.), and the European Union Seventh Framework Programme (FP7) Project RESOLVE (FP7-HEALTH-2012-305707) (to M.H.). O.T.B. was supported in part by a European Molecular Biology Organization long-term fellowship. D.M.M. was supported in part by a National Science Foundation graduate fellowship. S.O. was supported by a Japan Society for the Promotion of Science Postdoctoral Fellowship for Research Abroad.
Footnotes
The authors declare no conflict of interest.
This article contains supporting information online at www.pnas.org/lookup/suppl/doi:10.1073/pnas.1620145114/-/DCSupplemental.
References
- 1.Harisinghani MG, et al. Noninvasive detection of clinically occult lymph-node metastases in prostate cancer. N Engl J Med. 2003;348(25):2491–2499. doi: 10.1056/NEJMoa022749. [DOI] [PubMed] [Google Scholar]
- 2.Centers for Medicare and Medicaid Services 2014 2014 ASP Drug Pricing Files. Available at https://www.cms.gov/Medicare/Medicare-Fee-for-Service-Part-B-Drugs/McrPartBDrugAvgSalesPrice/2014ASPFiles.html. Accessed June 16, 2015.
- 3.Kim BH, et al. Large-scale synthesis of uniform and extremely small-sized iron oxide nanoparticles for high-resolution T1 magnetic resonance imaging contrast agents. J Am Chem Soc. 2011;133(32):12624–12631. doi: 10.1021/ja203340u. [DOI] [PubMed] [Google Scholar]
- 4.Lin CH, Cai SH, Feng JH. Positive contrast imaging of SPIO nanoparticles. J Nanomater. 2012;2012:734842. [Google Scholar]
- 5.Seo WS, et al. FeCo/graphitic-shell nanocrystals as advanced magnetic-resonance-imaging and near-infrared agents. Nat Mater. 2006;5(12):971–976. doi: 10.1038/nmat1775. [DOI] [PubMed] [Google Scholar]
- 6.McDonald MA, Watkin KL. Investigations into the physicochemical properties of dextran small particulate gadolinium oxide nanoparticles. Acad Radiol. 2006;13(4):421–427. doi: 10.1016/j.acra.2005.11.005. [DOI] [PubMed] [Google Scholar]
- 7.Bridot JL, et al. Hybrid gadolinium oxide nanoparticles: Multimodal contrast agents for in vivo imaging. J Am Chem Soc. 2007;129(16):5076–5084. doi: 10.1021/ja068356j. [DOI] [PubMed] [Google Scholar]
- 8.Hifumi H, Yamaoka S, Tanimoto A, Citterio D, Suzuki K. Gadolinium-based hybrid nanoparticles as a positive MR contrast agent. J Am Chem Soc. 2006;128(47):15090–15091. doi: 10.1021/ja066442d. [DOI] [PubMed] [Google Scholar]
- 9.Na HB, et al. Development of a T1 contrast agent for magnetic resonance imaging using MnO nanoparticles. Angew Chem Int Ed Engl. 2007;46(28):5397–5401. doi: 10.1002/anie.200604775. [DOI] [PubMed] [Google Scholar]
- 10.Caravan P, Ellison JJ, McMurry TJ, Lauffer RB. Gadolinium(III) chelates as MRI contrast agents: Structure, dynamics, and applications. Chem Rev. 1999;99(9):2293–2352. doi: 10.1021/cr980440x. [DOI] [PubMed] [Google Scholar]
- 11.Todd DJ, Kagan A, Chibnik LB, Kay J. Cutaneous changes of nephrogenic systemic fibrosis: Predictor of early mortality and association with gadolinium exposure. Arthritis Rheum. 2007;56(10):3433–3441. doi: 10.1002/art.22925. [DOI] [PubMed] [Google Scholar]
- 12.Perez-Rodriguez J, Lai S, Ehst BD, Fine DM, Bluemke DA. Nephrogenic systemic fibrosis: Incidence, associations, and effect of risk factor assessment—report of 33 cases. Radiology. 2009;250(2):371–377. doi: 10.1148/radiol.2502080498. [DOI] [PMC free article] [PubMed] [Google Scholar]
- 13.McDonald RJ, et al. Intracranial gadolinium deposition after contrast-enhanced MR imaging. Radiology. 2015;275(3):772–782. doi: 10.1148/radiol.15150025. [DOI] [PubMed] [Google Scholar]
- 14.Kanda T, et al. High signal intensity in dentate nucleus on unenhanced T1-weighted MR images: Association with linear versus macrocyclic gadolinium chelate administration. Radiology. 2015;275(3):803–809. doi: 10.1148/radiol.14140364. [DOI] [PubMed] [Google Scholar]
- 15.Kanal E, Tweedle MF. Residual or retained gadolinium: Practical implications for radiologists and our patients. Radiology. 2015;275(3):630–634. doi: 10.1148/radiol.2015150805. [DOI] [PubMed] [Google Scholar]
- 16.Errante Y, et al. Progressive increase of T1 signal intensity of the dentate nucleus on unenhanced magnetic resonance images is associated with cumulative doses of intravenously administered gadodiamide in patients with normal renal function, suggesting dechelation. Invest Radiol. 2014;49(10):685–690. doi: 10.1097/RLI.0000000000000072. [DOI] [PubMed] [Google Scholar]
- 17.Frey NA, Peng S, Cheng K, Sun S. Magnetic nanoparticles: Synthesis, functionalization, and applications in bioimaging and magnetic energy storage. Chem Soc Rev. 2009;38(9):2532–2542. doi: 10.1039/b815548h. [DOI] [PMC free article] [PubMed] [Google Scholar]
- 18.Park J, et al. One-nanometer-scale size-controlled synthesis of monodisperse magnetic iron oxide nanoparticles. Angew Chem Int Ed Engl. 2005;44(19):2873–2877. doi: 10.1002/anie.200461665. [DOI] [PubMed] [Google Scholar]
- 19.Kim BH, et al. Sizing by weighing: Characterizing sizes of ultrasmall-sized iron oxide nanocrystals using MALDI-TOF mass spectrometry. J Am Chem Soc. 2013;135(7):2407–2410. doi: 10.1021/ja310030c. [DOI] [PubMed] [Google Scholar]
- 20.McCarthy JR, Weissleder R. Multifunctional magnetic nanoparticles for targeted imaging and therapy. Adv Drug Deliv Rev. 2008;60(11):1241–1251. doi: 10.1016/j.addr.2008.03.014. [DOI] [PMC free article] [PubMed] [Google Scholar]
- 21.Ittrich H, Peldschus K, Raabe N, Kaul M, Adam G. Superparamagnetic iron oxide nanoparticles in biomedicine: Applications and developments in diagnostics and therapy. RoFo Fortschr Geb Rontgenstr Nuklearmed. 2013;185(12):1149–1166. doi: 10.1055/s-0033-1335438. [DOI] [PubMed] [Google Scholar]
- 22.Weissleder R, et al. Superparamagnetic iron oxide: Pharmacokinetics and toxicity. AJR Am J Roentgenol. 1989;152(1):167–173. doi: 10.2214/ajr.152.1.167. [DOI] [PubMed] [Google Scholar]
- 23.Wang YXJ, Hussain SM, Krestin GP. Superparamagnetic iron oxide contrast agents: Physicochemical characteristics and applications in MR imaging. Eur Radiol. 2001;11(11):2319–2331. doi: 10.1007/s003300100908. [DOI] [PubMed] [Google Scholar]
- 24.US Securities and Exchange Commission 2014 US Securities and Exchange Commission Filings, Item 8. Financial Statements and Supplementary Data. (AMAG Pharmaceuticals, Inc, Waltham, MA). Available at https://www.sec.gov/Archives/edgar/data/792977/000104746915000871/a2223053z10-k.htm. Accessed January 5, 2016.
- 25.Cunningham CH, et al. Positive contrast magnetic resonance imaging of cells labeled with magnetic nanoparticles. Magn Reson Med. 2005;53(5):999–1005. doi: 10.1002/mrm.20477. [DOI] [PubMed] [Google Scholar]
- 26.Gossuin Y, Gillis P, Hocq A, Vuong QL, Roch A. Magnetic resonance relaxation properties of superparamagnetic particles. Wiley Interdiscip Rev Nanomed Nanobiotechnol. 2009;1(3):299–310. doi: 10.1002/wnan.36. [DOI] [PubMed] [Google Scholar]
- 27.Hyeon T, Lee SS, Park J, Chung Y, Na HB. Synthesis of highly crystalline and monodisperse maghemite nanocrystallites without a size-selection process. J Am Chem Soc. 2001;123(51):12798–12801. doi: 10.1021/ja016812s. [DOI] [PubMed] [Google Scholar]
- 28.Hao R, et al. Synthesis, functionalization, and biomedical applications of multifunctional magnetic nanoparticles. Adv Mater. 2010;22(25):2729–2742. doi: 10.1002/adma.201000260. [DOI] [PubMed] [Google Scholar]
- 29.Park J, et al. Ultra-large-scale syntheses of monodisperse nanocrystals. Nat Mater. 2004;3(12):891–895. doi: 10.1038/nmat1251. [DOI] [PubMed] [Google Scholar]
- 30.Tromsdorf UI, Bruns OT, Salmen SC, Beisiegel U, Weller H. A highly effective, nontoxic T1 MR contrast agent based on ultrasmall PEGylated iron oxide nanoparticles. Nano Lett. 2009;9(12):4434–4440. doi: 10.1021/nl902715v. [DOI] [PubMed] [Google Scholar]
- 31.Tromsdorf UI, et al. Size and surface effects on the MRI relaxivity of manganese ferrite nanoparticle contrast agents. Nano Lett. 2007;7(8):2422–2427. doi: 10.1021/nl071099b. [DOI] [PubMed] [Google Scholar]
- 32.Choi HS, et al. Renal clearance of quantum dots. Nat Biotechnol. 2007;25(10):1165–1170. doi: 10.1038/nbt1340. [DOI] [PMC free article] [PubMed] [Google Scholar]
- 33.Woo K, et al. Easy synthesis and magnetic properties of iron oxide nanoparticles. Chem Mater. 2004;16(14):2814–2818. [Google Scholar]
- 34.Schladt TD, Graf T, Tremel W. Synthesis and characterization of monodisperse manganese oxide nanoparticles-evaluation of the nucleation and growth mechanism. Chem Mater. 2009;21(14):3183–3190. [Google Scholar]
- 35.Wei H, Bruns OT, Chen O, Bawendi MG. Compact zwitterion-coated iron oxide nanoparticles for in vitro and in vivo imaging. Integr Biol. 2013;5(1):108–114. doi: 10.1039/c2ib20142a. [DOI] [PMC free article] [PubMed] [Google Scholar]
- 36.Clavijo Jordan MV, Beeman SC, Baldelomar EJ, Bennett KM. Disruptive chemical doping in a ferritin-based iron oxide nanoparticle to decrease r2 and enhance detection with T1-weighted MRI. Contrast Media Mol Imaging. 2014;9(5):323–332. doi: 10.1002/cmmi.1578. [DOI] [PMC free article] [PubMed] [Google Scholar]
- 37.Wei H, et al. Compact zwitterion-coated iron oxide nanoparticles for biological applications. Nano Lett. 2012;12(1):22–25. doi: 10.1021/nl202721q. [DOI] [PMC free article] [PubMed] [Google Scholar]
- 38.Satat G, et al. Locating and classifying fluorescent tags behind turbid layers using time-resolved inversion. Nat Commun. 2015;6:6796. doi: 10.1038/ncomms7796. [DOI] [PubMed] [Google Scholar]
- 39.Chen O, et al. Magneto-fluorescent core-shell supernanoparticles. Nat Commun. 2014;5:5093. doi: 10.1038/ncomms6093. [DOI] [PMC free article] [PubMed] [Google Scholar]
- 40.Strijkers GJ, Mulder WJ, Kluza E, Nicolay K. Proceedings of the International Society for Magnetic Resonance in Medicine. Vol 14. The International Society for Magnetic Resonance in Medicine; Concord, CA: 2006. The optimization of liposomal formulations for molecular MR imaging; p. 1835. [Google Scholar]
- 41.Lee H, Shin TH, Cheon J, Weissleder R. Recent developments in magnetic diagnostic systems. Chem Rev. 2015;115(19):10690–10724. doi: 10.1021/cr500698d. [DOI] [PMC free article] [PubMed] [Google Scholar]
- 42.Khurana A, et al. Ferumoxytol: A new, clinically applicable label for stem-cell tracking in arthritic joints with MRI. Nanomedicine (Lond) 2013;8(12):1969–1983. doi: 10.2217/nnm.12.198. [DOI] [PMC free article] [PubMed] [Google Scholar]
- 43.Weinstein JS, et al. Superparamagnetic iron oxide nanoparticles: Diagnostic magnetic resonance imaging and potential therapeutic applications in neurooncology and central nervous system inflammatory pathologies, a review. J Cereb Blood Flow Metab. 2010;30(1):15–35. doi: 10.1038/jcbfm.2009.192. [DOI] [PMC free article] [PubMed] [Google Scholar]
- 44.Schnorr J, et al. Cardiac magnetic resonance angiography using blood-pool contrast agents: Comparison of citrate-coated very small superparamagnetic iron oxide particles with gadofosveset trisodium in pigs. Rofo. 2012;184(2):105–112. doi: 10.1055/s-0031-1281982. [DOI] [PubMed] [Google Scholar]
- 45.Kalavagunta C, Metzger GJ. Proceedings of The International Society for Magnetic Resonance in Medicine. Vol 18. The International Society for Magnetic Resonance in Medicine; Concord, CA: 2010. A field comparison of r1 and r2* relaxivities of Gd-DTPA in aqueous solution and whole blood: 3T versus 7T; p. 4990. [Google Scholar]
- 46.Bennett CL, et al. Gadolinium-induced nephrogenic systemic fibrosis: The rise and fall of an iatrogenic disease. Clin Kidney J. 2012;5(1):82–88. doi: 10.1093/ckj/sfr172. [DOI] [PMC free article] [PubMed] [Google Scholar]
- 47.Gaglia JL, et al. Noninvasive mapping of pancreatic inflammation in recent-onset type-1 diabetes patients. Proc Natl Acad Sci USA. 2015;112(7):2139–2144. doi: 10.1073/pnas.1424993112. [DOI] [PMC free article] [PubMed] [Google Scholar]
- 48.Freund B, et al. A simple and widely applicable method to 59Fe-radiolabel monodisperse superparamagnetic iron oxide nanoparticles for in vivo quantification studies. ACS Nano. 2012;6(8):7318–7325. doi: 10.1021/nn3024267. [DOI] [PubMed] [Google Scholar]
- 49.Turetschek K, et al. Tumor microvascular characterization using ultrasmall superparamagnetic iron oxide particles (USPIO) in an experimental breast cancer model. J Magn Reson Imaging. 2001;13(6):882–888. doi: 10.1002/jmri.1126. [DOI] [PubMed] [Google Scholar]
- 50.Huzjan R, Sala E, Hricak H. Magnetic resonance imaging and magnetic resonance spectroscopic imaging of prostate cancer. Nat Clin Pract Urol. 2005;2(9):434–442. doi: 10.1038/ncpuro0296. [DOI] [PubMed] [Google Scholar]
- 51.Goyen M. Gadofosveset-enhanced magnetic resonance angiography. Vasc Health Risk Manag. 2008;4(1):1–9. doi: 10.2147/vhrm.2008.04.01.1. [DOI] [PMC free article] [PubMed] [Google Scholar]
- 52.Parmelee DJ, Walovitch RC, Ouellet HS, Lauffer RB. Preclinical evaluation of the pharmacokinetics, biodistribution, and elimination of MS-325, a blood pool agent for magnetic resonance imaging. Invest Radiol. 1997;32(12):741–747. doi: 10.1097/00004424-199712000-00004. [DOI] [PubMed] [Google Scholar]
Associated Data
This section collects any data citations, data availability statements, or supplementary materials included in this article.


