Significance
Approximately 3.5-Ga sedimentary rocks surveyed by the Mars Science Laboratory rover in Gale Crater, Mars, contain secondary mineral phases indicating aqueous alteration and release of cations from mafic minerals during sediment deposition in lakes. However, carbonate phases are not detected, and our model calculations indicate atmospheric CO2 levels at the time of sediment deposition 10s to 100s of times lower than those required by climate models to warm early Mars enough to maintain surficial water. Our results offer a ground-based reference point for the evolution of martian atmospheric CO2 and imply that other mechanisms of warming Hesperian Mars, or processes that allowed for confined hydrological activity under cold conditions, must be sought.
Keywords: Hesperian Mars, martian atmosphere, Mars Science Laboratory, Gale Crater, carbon dioxide
Abstract
Carbon dioxide is an essential atmospheric component in martian climate models that attempt to reconcile a faint young sun with planetwide evidence of liquid water in the Noachian and Early Hesperian. In this study, we use mineral and contextual sedimentary environmental data measured by the Mars Science Laboratory (MSL) Rover Curiosity to estimate the atmospheric partial pressure of CO2 (PCO2) coinciding with a long-lived lake system in Gale Crater at ∼3.5 Ga. A reaction–transport model that simulates mineralogy observed within the Sheepbed member at Yellowknife Bay (YKB), by coupling mineral equilibria with carbonate precipitation kinetics and rates of sedimentation, indicates atmospheric PCO2 levels in the 10s mbar range. At such low PCO2 levels, existing climate models are unable to warm Hesperian Mars anywhere near the freezing point of water, and other gases are required to raise atmospheric pressure to prevent lake waters from being lost to the atmosphere. Thus, either lacustrine features of Gale formed in a cold environment by a mechanism yet to be determined, or the climate models still lack an essential component that would serve to elevate surface temperatures, at least locally, on Hesperian Mars. Our results also impose restrictions on the potential role of atmospheric CO2 in inferred warmer conditions and valley network formation of the late Noachian.
More than four decades of orbital imaging of Mars provide geomorphological evidence of a more active hydrological cycle and larger inventory of water during the Noachian and Early Hesperian (1, 2). The widespread distribution of hydrous clay minerals in martian terrains of this age and their subsequent demise provide pivotal supporting evidence (3, 4), but the clay mineral-bearing deposits also present a paradox in that carbonate minerals, expected coprecipitates in surficial settings in communication with a CO2-bearing atmosphere, are typically absent (5). Atmospheric reconstructions using carbon isotopic measurements and global inventories of martian carbon also indicate 100s mbar CO2 levels (5, 6). This leads to the question of how the surface of ancient Mars, faintly heated by a young sun, was kept warm enough to allow an active hydrological cycle, without substantial amounts of a key greenhouse gas in the atmosphere. However, the breadth of available constraints on carbon sinks (6) and potential clay mineral formation in subsurface settings uninfluenced by the atmosphere (7) introduce uncertainties to estimates and the periods to which they apply. In this work we use mineralogical and sedimentological data from ∼3.5 Ga martian lake sediments to obtain a reference point for the evolution of martian PCO2.
During its traverse to the lower slopes of Aeolis Mons (informally known as Mt. Sharp), the MSL team documented a ∼70 m sedimentary section of mudstones, siltstones, sandstones, and conglomerates deposited by lakes and rivers on the floor of Gale crater between 3.8 and 3.1 Ga (8). Sedimentary rocks analyzed by the CheMin X-ray diffraction (XRD) instrument during the traverse share many of the same components including (i) crystalline silicates including pigeonite, intermediate calcic plagioclase, and olivine from a basaltic source or sources; (ii) poorly crystalline clay minerals; (iii) various Fe oxides including magnetite; (iv) Ca–sulfate minerals, which mainly occur in cross-cutting fractures and veins; and (v) an X-ray amorphous component (9, 10). Thus far, carbonate minerals have not been definitively detected in Gale Crater sedimentary rocks. This is surprising given the reactivity of minerals making up sediments to carbonic acid.
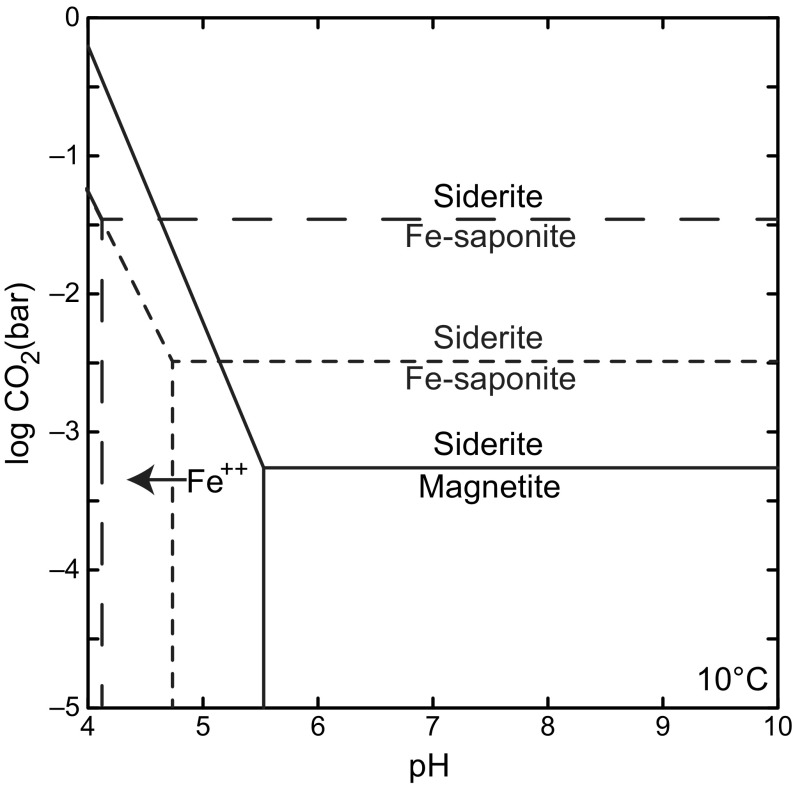
Of the phases present, smectitic clay minerals and magnetite provide a potential means of estimating ancient PCO2 by constraining dissolved inorganic carbon (DIC) levels in the pore fluids of Gale Crater sediments. It is proposed that isochemical alteration during the deposition of lacustrine mudstone at YKB involved dissolution of Fe2+-bearing olivine (Fo62) providing a source of Fe2+ and Mg2+ in pore waters for subsequent coeval precipitation of magnetite and Fe2+-bearing, ferrian saponite–type clay minerals (9, 11–14). The detection of these secondary phases indicates anoxic to poorly oxidizing conditions (13), and places lower limits on the pore water activity of Fe2+ and Mg2+ released from olivine. Therefore, the thermodynamic stability fields of ferrian saponite and magnetite with respect to Fe and Mg carbonates can be used as the basis of estimates of atmospheric PCO2 at the time of Sheepbed deposition. Ferrian saponite and magnetite are thermodynamically unstable with respect to Fe and Mg carbonates, such as siderite and magnesite, between 10−5 to 10−2 bar PCO2 depending on assumed activity of silica and Al3+ of pore waters (Fig. 1).
Fig. 1.
Thermodynamic stability of secondary minerals (magnetite and Fe saponite) detected in the Sheepbed member, Yellowknife Bay with respect to siderite under varying pH and gaseous CO2 levels. The threshold PCO2 at which siderite is favored over ferrian saponite is dependent on aqueous silica and Al3+ activity. The threshold is higher when SiO2(aq) is saturated with respect to amorphous silica (long dashed line) rather than quartz (short dashed line). In both cases Al3+ is set to saturation with respect to albite—reasonable given that the Sheepbed contains ∼20 wt % plagioclase feldspar (9). In drawing the stability boundaries for magnetite, redox state is set at the magnetite/hematite boundary, as detailed in the main text. All thermodynamic data come from the Lawrence Livermore National Laboratory dataset (15) with the exception of Fe saponite (Na0.35Fe3Al0.35Si3.65O10OH2) determined by Wilson et al. (16). Diagram produced using Geochemist Work Bench 9.
Estimates of PCO2 on the Archean (>2.5 Ga) Earth, derived from paleosols and banded iron formations, also use the thermodynamic stability of clay minerals and magnetite (17–19), but are criticized because they rely on assumptions of mineral equilibrium and do not account for enhanced delivery of carbon and reducing power to sediments via biological activity (20, 21). Metamorphic overprinting of original mineral assemblages in terrestrial rocks this old is ubiquitous and complicates interpretations further (22).
In many ways, deriving PCO2 estimates from Gale Crater sedimentary rocks is more straightforward than doing so in their terrestrial equivalents. Examination of ancient sediments at YKB shows that they, despite their age, have been subject to minimal burial diagenetic alteration and heated to no more than 70 °C (9, 12, 13) consistent with reconstructed burial history and estimates of ancient geothermal gradients (23). The observed persistence of smectite clay minerals, magnetite, levels of hematite at CheMin’s detection limit of ∼1 wt % and absence of cation leaching in YKB sediments revealed by bulk geochemistry (9, 11) is inconsistent with pervasive postdepositional chemical weathering or alteration that may have otherwise had the potential to dissolve authigenic carbonate minerals.
In addition, MSL has not detected signs of biological influence on the Gale Crater sediments. In particular, the organic molecules observed by the Sample Analysis at Mars (SAM) instrument suite are extremely localized and restricted to simple structures (e.g., C1-C4 alkyl and single-ring aromatic hydrocarbons and chlorohydrocarbons; ref. 24) that lack source information. As such, they may be derived from meteoritic, abiogenic, or geologically reworked biological inputs to the sediments.
Assuming that sedimentary mineral assemblages were in thermodynamic equilibrium with the atmosphere remains problematic, however. Even with martian PCO2 levels above thermodynamic thresholds for carbonate stability, notoriously slow precipitation kinetics of Fe and Mg carbonates may have been a barrier to producing detectable quantities in Gale Crater sediments before burial and isolation from an atmospheric carbon source. For example, magnesite requires temperatures greater than ∼70 °C for direct precipitation in the laboratory (25). Siderite forms under ambient laboratory conditions at rates ∼4 orders of magnitude slower than calcite (26).
Here we take a step beyond assuming mineral equilibrium and combine estimated sedimentation rates, afforded by detailed sedimentary facies analysis (8, 12), with carbonate precipitation kinetics and observed mineralogy to estimate ancient PCO2 using a geochemical reaction–transport model.
Model Summary
Our models are constructed to determine threshold PCO2 levels that would permit the precipitation of detectable amounts of siderite by CheMin. For samples bearing the mixture of phases observed within Sheepbed mudstone (9), CheMin has a detection limit of ∼1 wt % siderite. The SAM instrument detects release of CO2 upon sample heating, which can, in part, be derived from decomposition of carbonate minerals. The results of SAM analyses of YKB sediments provide no clear indication of Fe carbonate, but the expected CO2 signal for carbonates may be masked by other CO2 sources thus permitting the presence of Fe carbonates at abundances below the CheMin detection limit (27).
Precipitation rates and therefore accumulation of carbonates depend on the saturation state of pore water with respect to a particular carbonate phase (Ω), given by
| [1] |
where Ksp is the solubility product of the carbonate in question and M2+ represents the concentration of the metal cation in pore water.
Ω is linked to carbonate precipitation rate (Rcarbprec) by the expression,
| [2] |
where Kcarbprec is the rate constant and n is the order of the reaction.
Our models calculate [] by simulating advection, diffusion, and reaction of DIC species, including precipitation of carbonate, in a one-dimensional porous sedimentary profile subject to active sedimentary accumulation and burial (detailed in SI Text, Model Details). Diffusion and advection from the upper model boundary actively replenish DIC (including ) lost from pore waters during carbonate precipitation and transport and, thus, are of critical importance in modeling the total carbonate accumulation. Upper model boundary conditions are set to simulate a well-mixed lake in equilibrium with an assigned PCO2 atmosphere. This is a valid representation given the absence of glaciogenic sedimentary features, such as dropstones, ice wedges, and glacial tills, in Gale lake deposits that would indicate ice cover, and the meter-scale thicknesses of delta deposits that indicate water depths of the same order (8).
We can make broad inferences about lake water chemistry at the time of YKB formation deposition. Salinity appears to have been low based on limited Cl and S concentration in the sedimentary matrix and the lack of detection of evaporative minerals in the mudstone (9, 11, 12). This is compatible with bulk geochemical evidence of limited chemical alteration of sediments during erosion and transport from the source area (11). The observed stability of clay minerals and magnetite in the sediments implies circum-neutral pH pore waters (Fig. 1) that were not overwhelmed by hypothesized surficial sources of acidity sometimes invoked for Mars aqueous environments (28, 29). Thus, DIC speciation and concentrations at the upper model boundary (representing lake water) are calculated over a range of assigned pHs and atmospheric PCO2 levels, with the lowest pH of 5 corresponding to the lower stability field of magnetite (Fig. 1).
A variety of approaches to estimate the activity of metal cations required to calculate the saturation states and accumulation rates of carbonates are possible (Eqs. 1 and 2). For example, in a full kinetic model, metal cation activities are calculated as a function of competing mineral dissolution and precipitation reactions, and in the case of Fe2+, the redox state of pore waters. Although this approach provides the most mathematically complete model of a given system, the assigned kinetic parameters are subject to significant uncertainty. For instance, the rate laws governing saponite precipitation are unknown and must be guessed through comparison with other clay minerals that differ in terms of chemistry and crystal structure (e.g., ref. 30). Moreover, order-of-magnitude differences between kinetic rate laws determined in the laboratory and observed in natural systems are a well-documented challenge for reaction–transport models.
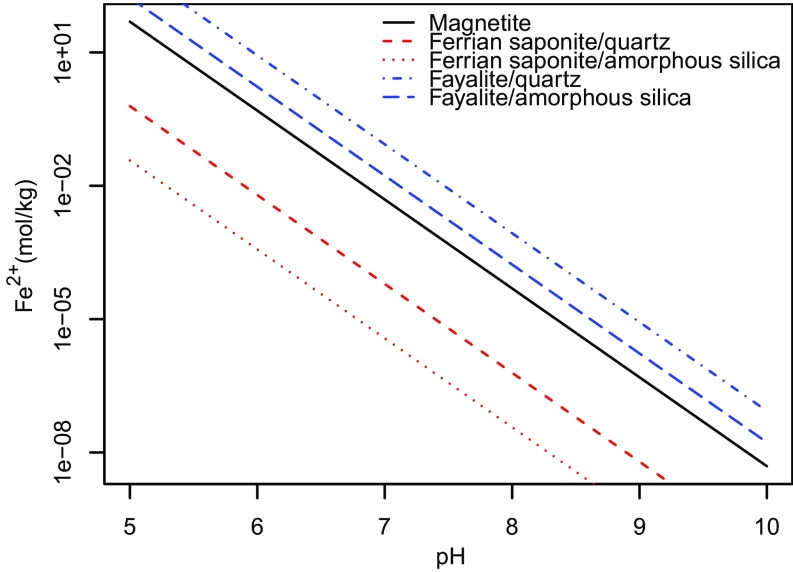
Alternatively, if the goal of the model is to obtain an absolute upper threshold of PCO2 consistent with nondetection of carbonates at Gale Crater, then our preferred hybrid kinetic model formulation becomes suitable. Calculating an upper PCO2 threshold requires a minimum bound on the activity of metal cations in solution. For the sediments at YKB, where evidence of magnetite and saponite precipitation at the time of deposition is documented, a minimum bound can be placed on Fe2+ activity in pore water by assuming that both magnetite and ferrian saponite are at or above saturation levels. Fig. S1 shows that with expected activities of silica and Al3+, ferrian saponite is always supersatured when [Fe2+] is at saturation with respect to magnetite. Thus, [Fe2+] is calculated in the model assuming that pore waters are saturated with respect to magnetite. We note that in a full kinetic model [Fe2+] would approach magnetite saturation in a situation where precipitation of magnetite and saponite outcompeted siderite for [Fe2+].
Fig. S1.
Thermodynamic stability diagram showing the Fe2+ concentration required to be in equilibrium with various minerals and silica activities ranging from quartz to amorphous silica, as a function of pH. Lines show saturation values at 10 °C and a salinity of 10 g/kg. Minerals are supersaturated above their respective equilibrium lines. All thermodynamic data come from ref. 53 with the exception of Fe saponite (Na0.35Fe3Al0.35Si3.65O10OH2) determined in ref. 16. In drawing the stability boundaries for magnetite, redox state is set at the magnetite/hematite boundary, as detailed in the main text. In defining equilibrium lines for ferrian saponite, Al3+ is set to saturation with respect to albite, which is reasonable given that the Sheepbed contains ∼20 wt % plagioclase feldspar (9).
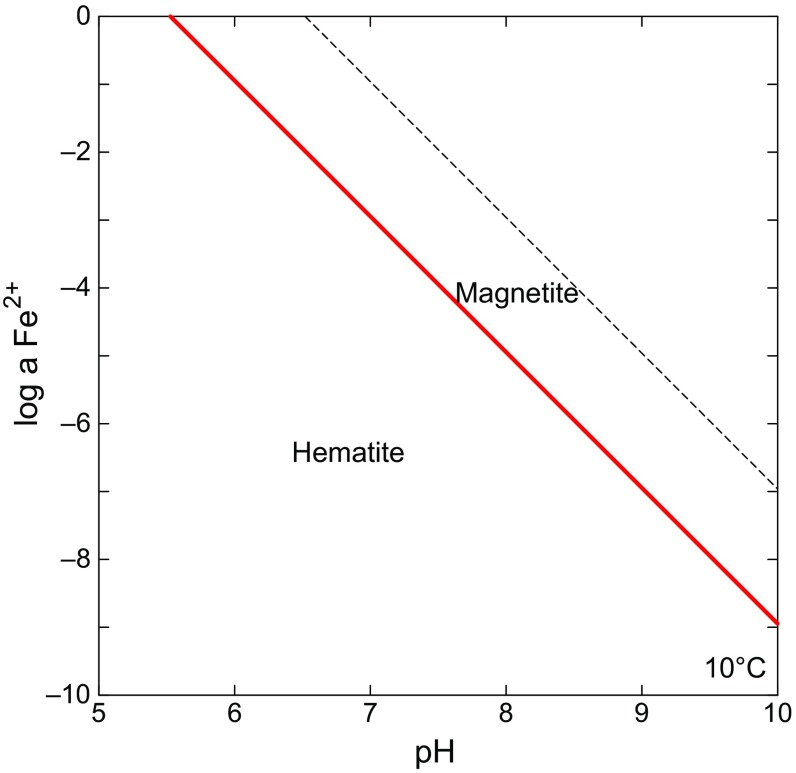
To calculate pore water [Fe2+] based on magnetite saturation requires a redox constraint. Redox is assigned to the magnetite/hematite boundary, again minimizing [Fe2+] in the model profile, in keeping with the goal of obtaining an upper PCO2 threshold (Fig. S2). Formulating the model in this way is also consistent with detection of small amounts of hematite in YKB sediments (9). This state is represented by the following chemical reaction:
| [3] |
Fig. S2.
Thermodynamic stability diagram showing the relation between Fe2+ activity (red line) and pH with redox state at the magnetite/hematite boundary. Note that in more oxidizing conditions magnetite is unstable. Under more reducing conditions Fe2+ activity is higher and thus the resulting PCO2 threshold estimated using the reaction–transport model is reduced. The figure was generated using Geochemist’s Workbench for illustrative purposes. In the model [Fe2+] was calculated at a given pH, temperature and salinity using SUPCRT, as described in SI Text, Model Details.
By calculating the equilibrium constant Kmag/hem for reaction 3 at given temperature and salinity values and assuming H2O activity of 1 a pH-dependent expression for [Fe2+] is obtained.
| [4] |
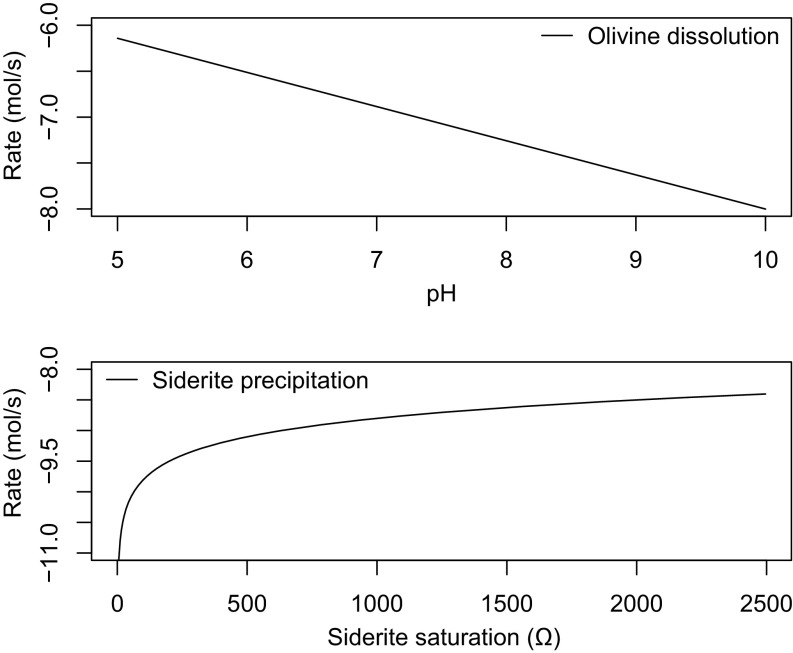
[Fe2+] is calculated in the model profile at each time step based on pH using Eq. 4 allowing the saturation state with respect to siderite to be determined. Combining calculated Ωsiderite with the slowest kinetic rate law governing siderite precipitation available in the literature (Table S1), we determine the upper threshold of atmospheric PCO2 that would result in siderite being undetectable by CheMin in the YKB formation. Note that in configuring the model in this way it is assumed that siderite precipitation kinetics limit carbonate production; Fe2+ supplied by the dissolution of olivine does not. Fig. S3 shows this assumption is valid. Typical equilibrium outputs of a model run are shown in Fig. S4.
Table S1.
Rate constants for siderite precipitation
Fig. S3.
Comparison of olivine dissolution rates over a range of pH values with siderite precipitation rates at various values of Ω. SI Text, Comparison of Olivine Dissolution and Siderite Precipitation Kinetics describes details of how rates were derived.
Fig. S4.
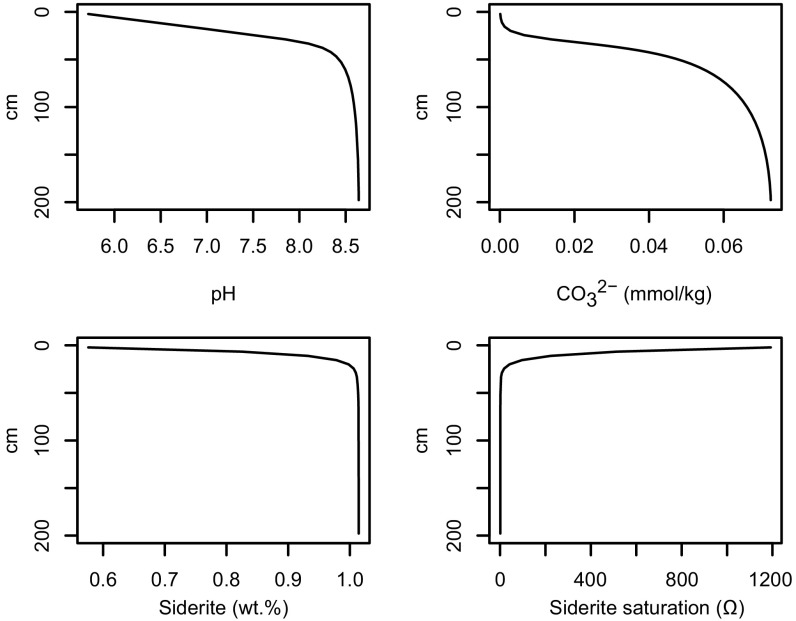
Typical reaction–transport model output. The four panels show calculated changes in pH, DIC, siderite content and saturation with respect to siderite with depth below sediment/water interface. In this simulation, porosity within the model profile is 0.6, sediment accumulation rate is 1 cm/y, temperature is 10 °C and salinity is 10 g/kg. Carbonate speciation and concentrations at the upper model boundary, representing lake waters, are set to be in equilibrium at pH 5.5 with an atmospheric PCO2 of 63 mbars.
Results and Discussion
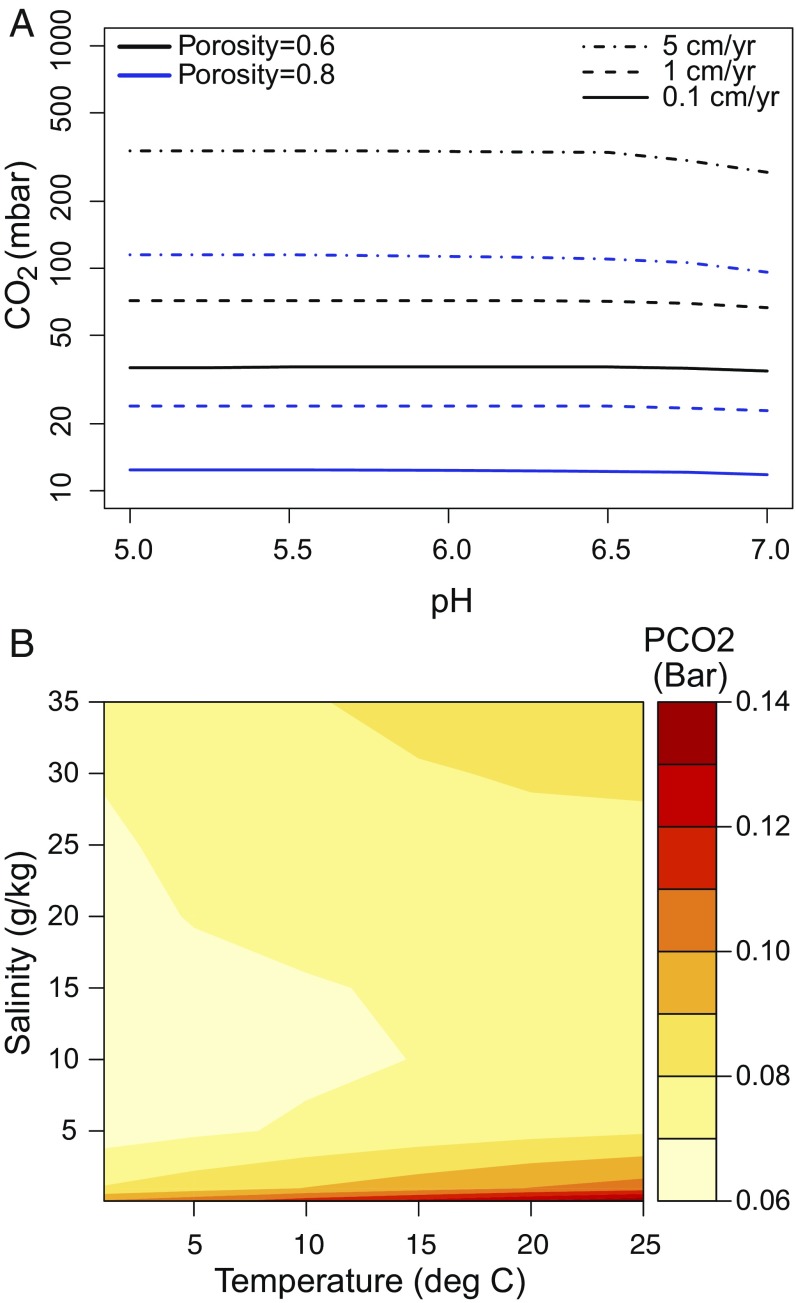
Fig. 2A shows upper PCO2 thresholds for siderite detection over a range of assigned water column pH and at various sediment accumulation rates. Water column pH has limited influence on rates of siderite production between values of 5 and 7 in our model. This is because siderite precipitation rate is determined by Ωsiderite = [Fe2+][CO32-], where at low pH small carbonate anion concentrations are compensated for by higher [Fe2+] required to maintain magnetite saturation (Fig. S2). Above pH 7, PCO2 thresholds decrease (Fig. 2A). To maintain high pH within a water column in equilibrium with the range of atmospheric PCO2 values investigated here requires elevated carbonate alkalinity and thus DIC. High DIC levels make diffusion and carbonate precipitation in the lower parts of modeled sedimentary profiles more efficient, lowering PCO2 thresholds. Because we aim to determine an upper constraint on PCO2 we focus our discussion on the PCO2 thresholds obtained assuming pH of lake waters between 5 and 7—the lowest values compatible with saponite and magnetite precipitation (Fig. 1).
Fig. 2.
(A) PCO2 required to produce 1 wt % siderite within model sedimentary profiles at various sediment accumulation rates, sediment porosities, and water column pH values. [Fe2+] is set to be saturated with respect to magnetite under redox conditions corresponding to the magnetite/hematite boundary. (B) Sensitivity of PCO2 thresholds to salinity and temperature with a burial rate of 1 cm/y and sedimentary porosity of 0.6.
Sedimentary porosity influences the rates of siderite production by controlling the quantity of pore water DIC available for reaction with Fe2+ released from olivine and rates of chemical diffusion within sediments, both of which generally increase with porosity. On Earth, mud deposits typically have initial porosities of between 60 and 80% (31). We have assigned a porosity value of 60% in our model profiles to obtain upper PCO2 thresholds (Fig. 2A). No significant sedimentary compaction is expected within ∼1.5–3 m model interval where carbonates form.
Calculated PCO2 thresholds are also highly sensitive to sediment accumulation rates, with faster rates permitting higher threshold atmospheric PCO2 levels (Fig. 2). We have no direct constraints on the rates of deposition of the YKB formation, but given the similarity of the sedimentary architecture with terrestrial fluvial–lacustrine deposits (8) we use compilations of thousands of lacustrine accumulation rates observed on Earth to obtain an upper limit for the YKB formation (31). Terrestrial lacustrine sedimentation rates span several orders of magnitude, with a dependence on the time span of accumulation (32). With accumulation times of 100s to 10,000 y estimated for the 1.5-m-thick Sheepbed member (12), accumulation rates as high as 5 cm/y are possible, with an average rate ∼0.1 cm/y (32). Lacustrine deposits with sedimentation rates >1cm/y make up <1% of available records. The highest rates are not sustainable for periods of more than ∼100 y, thus we use an upper sedimentation rate of 1 cm/y in calculating PCO2 estimates. We find that temperature and pore water salinity have a minor influence on PCO2 thresholds (Fig. 2B; SI Text, Sensitivity Tests).
At 10 °C and a salinity of 10 g/kg, an accumulation rate of 1 cm/y and sedimentary porosity of 60% the upper limit on PCO2 levels where siderite production remains below XRD detection limits in the Sheepbed member is 70 mbar. This falls to 10 mbar at average sedimentation rates of ∼0.1 cm/y. Our PCO2 estimates are orders of magnitude above those based on thermodynamic stability of magnetite with respect to siderite (Fig. 1), but remain well below the 1000s mbar CO2 levels required by the most optimistic climate simulations to keep the average temperature of early Mars above 273 K for long periods (33); for example, Ramirez et al. (34) model clement conditions at 1.3 bars CO2, with 20% H2 as an additional greenhouse gas.
As discussed above, our models and choice of input parameters are designed to provide an absolute upper limit PCO2 based on observed mineralogy and sedimentology at YKB. However, there are various reasons to believe that [Fe2+] was higher in pore waters and PCO2 may have been lower than the thresholds shown in Fig. 2. First, it is possible that magnetite and hematite detected in YKB sediments (9) are detrital phases that do not place bounds on pore water [Fe2+] or act as a sink for Fe. This would allow for more reducing conditions, higher [Fe2+] (Fig. S2) and lower PCO2 thresholds. Second, if the supply of [Fe2+] from olivine outstripped removal by secondary phases (i.e., olivine dissolution kinetics >> precipitation of secondary phases), [Fe2+] would also be higher than in our upper threshold PCO2 simulations. In both these cases [Fe2+] would tend toward approaching levels of olivine saturation, thus providing a reduced PCO2 threshold limit for a given sedimentation rate, porosity, salinity, and temperatures. Model [Fe2+] for this lower PCO2 threshold based on olivine saturation requires an assumption about [SiO2(aq)] of pore waters to be made, but in natural near-surface pore waters [SiO2(aq)] is typically between saturation with respect to quartz or amorphous silica. Both these situations can be used to obtain a pH-dependent expression to determine [Fe2+]:
| [5] |
or
| [6] |
| [7] |
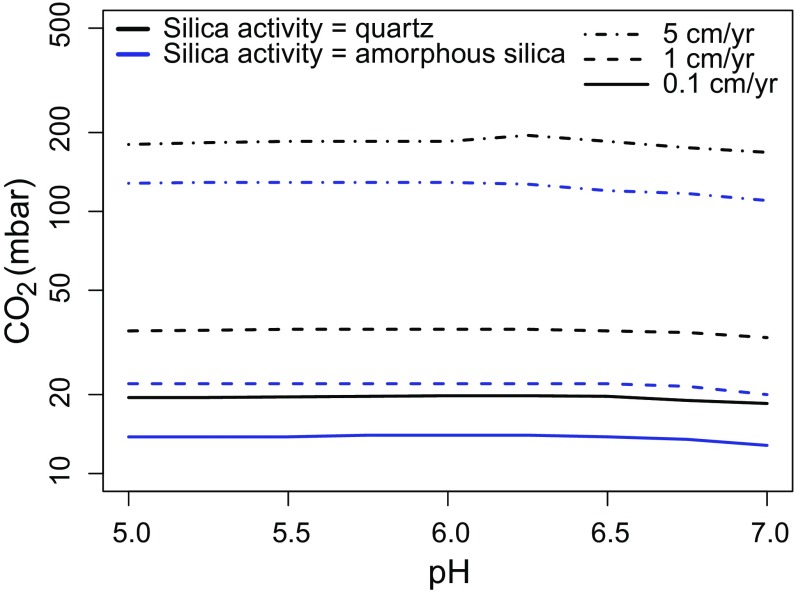
where Kreaction is the reaction constant of either Eq. 5 or 6. The resulting PCO2 thresholds are shown in Fig. 3. With comparable porosity and burial rates PCO2 thresholds are approximately half the values calculated assuming pore water [Fe2+] at magnetite saturation. This reinforces our estimates that the martian atmosphere contained 10s mbar levels at the time of deposition of YKB sediments.
Fig. 3.
PCO2 required to produce 1 wt % siderite within model sedimentary profiles at various sediment accumulation rates, sediment porosities, and water column pH values. [Fe2+] is set at equilibrium with fayalite with silica saturation in equilibrium with quartz (black lines) and amorphous silica (blue lines). Sedimentary porosity is set at 0.6 in all simulations.
Fluvial–lacustrine sediments in Gale Crater represent one of the youngest known instances of habitable surficial aqueous conditions on Mars, on the tail end of a period of rapid atmospheric degradation and loss (6, 12, 33). Thus, our PCO2 estimate serves as a reference point at a critical juncture in martian atmospheric evolution. Combining ∼10s mbar estimates of PCO2 derived from Gale Crater with upper estimates of the amount of CO2 lost through sequestration as carbonate minerals in the martian crust (up to ∼500 mbar CO2; ref. 35) and CO2 lost to space (<100 mbar; ref. 36) limits atmospheric CO2 during the Noachian and Early Hesperian to 100s mbar. This is well below threshold levels required to keep the average temperature of early Mars above 273 K for long periods in climate models, therefore either lacustrine features of Gale formed in a cold environment (37) or the problem of reconciling Mars' early climate with geological record of an active hydrosphere remains. Our results imply that the overall lack of carbonates found in the geological record of Mars (5, 6, 28, 35) is a direct reflection of the composition of the ancient atmosphere.
SI Text
Model Details.
The reaction–transport model was developed in R—an open source statistical computing environment (38). ReacTran, a package of functions, routines, and solvers for reactive–transport modeling, was used (39). In addition, functions in packages seacarb and marelec are used to calculate initial carbonate speciation in the water column based on specified PCO2 and pH, as well as equilibrium constants and diffusion coefficients of chemical species under the specified physical and chemical conditions (40, 41).
The model finds a numerical solution to a set of three ordinary differential equations describing the temporal change in total dissolved inorganic carbon (DIC), pH, and siderite concentration in a one-dimensional porous sedimentary profile subject to diffusion and advection (transport) associated with sedimentary accumulation, and chemical reactions. The model equations were formulated using the direct substitution approach (42). Tracking temporal changes in the pH and DIC of the model domain allows calculation of the concentration of any species of inorganic carbon (e.g., ref. 43).
Exchange with lake water, assumed to behave as an infinite reservoir and represented by the upper boundary condition imposed on the model domain, occurs by diffusion only. As described in the main text and shown in Figs. 2 and 3, simulations are run with a range of lake water chemistries constrained to be in equilibrium with prescribed atmospheric CO2 levels and lake water pH.
The rate of siderite precipitation follows the general scheme described in the main text and depends on the saturation state of pore waters with respect to siderite (Ω), given by
| [S1] |
where Ksp is the solubility product of siderite calculated with the formulation of ref. 44 and adjusted with salinity following ref. 45.
[CO32-] is calculated at each time step from DIC and pH. As justified in the main text, [Fe2+] is set to be saturated with respect to either magnetite or fayalite as represented by reactions S2–S4. In the case of reaction S2 O2(aq) activity is set to equal the magnetite/hematite boundary.
| [S2] |
| [S3] |
or
| [S4] |
SUPCRT, implemented in the R package CHNOSZ (46), was used to calculate equilibrium constant of these reactions at given temperature and salinity values. [Fe2+] is calculated within the model profile at each time step based on pH and provides a lower limit on [Fe2+].
ΩFeCO3 is linked to carbonate precipitation rates by the expression:
| [S5] |
Here, ksidprec is the kinetic constant for siderite precipitation and n is the order of the reaction. We use the lowest value of ksidprec (0.05 mmol·kg−1·y−1 at 25 °C) available from the literature (Table S1) because the aim is to obtain an upper bound on atmospheric PCO2. ksidprec varies with temperature (ksidprecT) according to
| [S6] |
An activation energy (Ea) of 54 kJ/mol was used based on the experimental work of Johnson (50). Siderite precipitation shows a first-order dependence on saturation state thus n = 1 (48).
Simulations are initiated with DIC, pH, and siderite content set to zero throughout the model sediment column. When the model is run, siderite precipitates and is buried, a process that consumes DIC. The depth of the model domain is manually adjusted through trial and error to ensure negligible carbonate is being added at the base of the model profile. Model profiles are typically ∼1.5 m deep and split into 45 layers. Model results are collected after equilibrium is assured, an interval of 250 y. Typical equilibrium outputs of a model run are shown in Fig. S4.
Comparison of Olivine Dissolution and Siderite Precipitation Kinetics.
As discussed in the main text, the model formulation implemented assumes that siderite precipitation kinetics limit carbonate production rather than Fe2+ supplied by the dissolution of olivine. Fig. S3 compares olivine dissolution rates from pH 5–10 with siderite precipitation rates for a range of siderite saturation states observed in model simulations (Ω). Olivine dissolution rate calculations follow the formulation of ref. 51 and a specific surface area of 5 m2/g, measured on olivine powder with similar grain size as the Sheepbed mudstone at YKB (52). Olivine dissolution always outpaces siderite precipitation.
Sensitivity Tests.
Fig. 2 shows results of model sensitivity analysis of PCO2 thresholds to sedimentary porosity, temperature, and salinity, respectively.
Sedimentary porosity.
Terrestrial muds deposits that have not been buried typically have porosities of 0.6–0.8 (31). Fig. 2A shows the influence on PCO2 thresholds of increasing sedimentary porosity values up to 0.8, from the value of 0.6 used in model runs discussed in the main text. The result is a ∼threefold decrease in PCO2 threshold, regardless of burial rate. This confirms that using a porosity value of 0.6 provides an upper threshold on PCO2.
Temperature.
Fig. 2B shows that as temperature increases the upper threshold on PCO2 also increases. However, the increase is insignificant (∼10s mbar in the model scenario with a sedimentary porosity of 0.6 and burial rate of 1 cm/y), compared with the amounts of CO2 needed in climate models to push martian climate to these higher temperatures.
Salinity.
PCO2 thresholds are higher when water is either fresh or saline (Fig. 2B). In the model scenario presented in Fig. 2B, PCO2 thresholds vary by as much as ∼30 mbar at 5 °C with the highest thresholds (100 mbar) obtained when waters are fresh. As discussed in the text, salinity appears to have been low at the time of deposition of YKB sediments, based on limited Cl and S concentration in the sedimentary matrix and the lack of detection of evaporative minerals in the mudstone (12). Uncertainty in the exact salinity of pore waters does not impact the conclusions drawn from our work.
Acknowledgments
We acknowledge the support of the Jet Propulsion Lab engineering and MSL operations staff. Thanks to K. Zahnle, E. Kite, and M. Daswani for discussions, and constructive reviews from I. Halevy, J. Kasting, P. Niles, and two anonymous reviewers on this and a previous version of the manuscript. We thank P. Sadler for advice and access to sedimentation rate data. Modeling efforts were supported by a NASA Habitable Worlds grant (T.F.B.). This work was supported by the Project “icyMARS” European Research Council Starting Grant 307496 (to A.G.F.). This research was supported by the NASA Mars Exploration Program. Some of this research was carried out at the Jet Propulsion Laboratory, California Institute of Technology, under a contract with the National Aeronautics and Space Administration.
Footnotes
The authors declare no conflict of interest.
This article is a PNAS Direct Submission.
This article contains supporting information online at www.pnas.org/lookup/suppl/doi:10.1073/pnas.1616649114/-/DCSupplemental.
References
- 1.Carr MF. Water on Mars. Oxford Univ Press; New York: 1996. [Google Scholar]
- 2.Di Achille G, Hynek BM. Ancient ocean on Mars supported by global distribution of deltas and valleys. Nat Geosci. 2010;3:459–463. [Google Scholar]
- 3.Bibring J-P, et al. Global mineralogical and aqueous mars history derived from OMEGA/Mars Express data. Science. 2006;312(5772):400–404. doi: 10.1126/science.1122659. [DOI] [PubMed] [Google Scholar]
- 4.Murchie SL, et al. 2009. A synthesis of Martian aqueous mineralogy after 1 Mars year of observations from the Mars Reconnaissance Orbiter. J Geophys Res 114(E2): 10.1029/2009JE003342.
- 5.Niles PB, et al. Geochemistry of carbonates on Mars: Implications for climate history and nature of aqueous environments. Space Sci Rev. 2012;174(1):301–328. [Google Scholar]
- 6.Hu R, Kass DM, Ehlmann BL, Yung YL. Tracing the fate of carbon and the atmospheric evolution of Mars. Nat Commun. 2015;6(10003):10003. doi: 10.1038/ncomms10003. [DOI] [PMC free article] [PubMed] [Google Scholar]
- 7.Ehlmann BL, et al. Subsurface water and clay mineral formation during the early history of Mars. Nature. 2011;479(7371):53–60. doi: 10.1038/nature10582. [DOI] [PubMed] [Google Scholar]
- 8.Grotzinger JP, et al. Deposition, exhumation, and paleoclimate of an ancient lake deposit, Gale crater, Mars. Science. 2015;350(6257):aac7575. doi: 10.1126/science.aac7575. [DOI] [PubMed] [Google Scholar]
- 9.Vaniman DT, et al. MSL Science Team Mineralogy of a mudstone at Yellowknife Bay, Gale crater, Mars. Science. 2014;343(6169):1243480. doi: 10.1126/science.1243480. [DOI] [PubMed] [Google Scholar]
- 10.Treiman AH, et al. Mineralogy, provenance, and diagenesis of a potassic basaltic sandstone on Mars: CheMin X-ray diffraction of the Windjana sample (Kimberley area, Gale Crater) J Geophys Res Planets. 2016;121(1):75–106. doi: 10.1002/2015JE004932. [DOI] [PMC free article] [PubMed] [Google Scholar]
- 11.McLennan SM, et al. MSL Science Team Elemental geochemistry of sedimentary rocks at Yellowknife Bay, Gale crater, Mars. Science. 2014;343(6169):1244734. doi: 10.1126/science.1244734. [DOI] [PubMed] [Google Scholar]
- 12.Grotzinger JP, et al. MSL Science Team A habitable fluvio-lacustrine environment at Yellowknife Bay, Gale crater, Mars. Science. 2014;343(6169):1242777. doi: 10.1126/science.1242777. [DOI] [PubMed] [Google Scholar]
- 13.Bristow TF, et al. The origin and implications of clay minerals from Yellowknife Bay, Gale crater, Mars. Am Mineral. 2015;100(4):824–836. doi: 10.2138/am-2015-5077CCBYNCND. [DOI] [PMC free article] [PubMed] [Google Scholar]
- 14.Treiman AH, et al. Ferrian saponite from the Santa Monica Mountains (California, U.S.A., Earth): Characterization as an analog for clay minerals on Mars with application to Yellowknife Bay in Gale Crater. Am Mineral. 2014;99(11-12):2234–2250. [Google Scholar]
- 15.Delany JM, Lundeen SR. 1989. The LLNL Thermochemical Database. Lawrence Livermore National Laboratory Report UCRL-21658.
- 16.Wilson J, Savage D, Cuadros J, Shibata M, Ragnarsdottir KV. The effect of iron on montmorillonite stability. (I) Background and thermodynamic considerations. Geochim Cosmochim Acta. 2006;70(2):306–322. [Google Scholar]
- 17.Rye R, Kuo PH, Holland HD. Atmospheric carbon dioxide concentrations before 2.2 billion years ago. Nature. 1995;378(6557):603–605. doi: 10.1038/378603a0. [DOI] [PubMed] [Google Scholar]
- 18.Ohmoto H, Watanabe Y, Kumazawa K. Evidence from massive siderite beds for a CO2-rich atmosphere before approximately 1.8 billion years ago. Nature. 2004;429(6990):395–399. doi: 10.1038/nature02573. [DOI] [PubMed] [Google Scholar]
- 19.Rosing MT, Bird DK, Sleep NH, Bjerrum CJ. No climate paradox under the faint early Sun. Nature. 2010;464(7289):744–747. doi: 10.1038/nature08955. [DOI] [PubMed] [Google Scholar]
- 20.Sheldon ND. Precambrian paleosols and atmospheric CO2 levels. Precam Res. 2006;147(1-2):148–155. [Google Scholar]
- 21.Kasting JF. Early earth: Faint young sun redux. Nature. 2010;464(7289):687–689. doi: 10.1038/464687a. [DOI] [PubMed] [Google Scholar]
- 22.Reinhard CT, Planavsky NJ. Mineralogical constraints on Precambrian pCO2. Nature. 2011;474(7349):E1–E2, discussion E4–E5. doi: 10.1038/nature09959. [DOI] [PubMed] [Google Scholar]
- 23.Borlina CS, Ehlmann BL, Kite ES. Modeling the thermal and physical evolution of Mount Sharp’s sedimentary rocks, Gale crater, Mars: Implications for diagenetic minerals on the MSL Curiosity Rover traverse. J Geophys Res. 2015;120(8):1396–1414. [Google Scholar]
- 24.Freissinet C, et al. Organic molecules in the Sheepbed Mudstone, Gale Crater, Mars. J Geophys Res Planets. 2015;120(3):495–514. doi: 10.1002/2014JE004737. [DOI] [PMC free article] [PubMed] [Google Scholar]
- 25.Gautier Q, Bénézeth P, Mavromatis V, Schott J. Hydromagnesite solubility product and growth kinetics in aqueous solution from 25 to 75°C. Geochim Cosmochim Acta. 2014;138:1–20. [Google Scholar]
- 26.Jimenez-Lopez C, Romanek ChS. Precipitation kinetics and carbon isotope partitioning of inorganic siderite at 25°C and 1 atm. Geochim Cosmochim Acta. 2004;68:557–571. [Google Scholar]
- 27.Ming DW, et al. MSL Science Team Volatile and organic compositions of sedimentary rocks in Yellowknife Bay, Gale crater, Mars. Science. 2014;343(6169):1245267. doi: 10.1126/science.1245267. [DOI] [PubMed] [Google Scholar]
- 28.Fairén AG, Fernández-Remolar D, Dohm JM, Baker VR, Amils R. Inhibition of carbonate synthesis in acidic oceans on early Mars. Nature. 2004;431(7007):423–426. doi: 10.1038/nature02911. [DOI] [PubMed] [Google Scholar]
- 29.Hurowitz JA, Fischer WW, Tosca NJ, Milliken RE. Origin of acidic surface waters and the evolution of atmospheric chemistry on early Mars. Nat Geosci. 2010;3:323–326. [Google Scholar]
- 30.Yang L, Steefel CI. Kaolinite dissolution and precipitation kinetics at 22 degrees C and pH 4. Geochim Cosmochim Acta. 2008;72:99–116. [Google Scholar]
- 31.Potter PE, Maynard JB, Depetris PJ. Mud and Mudstones, Introduction and Overview. Springer; New York: 2005. [Google Scholar]
- 32.Sadler PM. Sediment accumulation rates and the completeness of stratigraphic sections. J Geol. 1981;89:569–584. [Google Scholar]
- 33.Haberle RA, Catling DC, Carr MH, Zahnle K. The early Mars climate system. In: Haberle RA, Clancy RT, Forget F, Smith MD, Zurek RW, editors. The Atmosphere and Climate of Mars. Cambridge Univ Press; Cambridge, UK: 2017. in press. [Google Scholar]
- 34.Ramirez RM, et al. A CO2-H2 greenhouse for early Mars. Nat Geosci. 2014;7:59–63. [Google Scholar]
- 35.Edwards CS, Ehlmann BL. Carbon sequestration on Mars. Geology. 2015;43:863–866. [Google Scholar]
- 36.Lammer H, et al. Outgassing history and escape of the martian atmosphere and water inventory. Space Sci Rev. 2013;174:113–154. [Google Scholar]
- 37.Fairén AG, et al. A cold hydrological system in Gale crater, Mars. Planet Space Sci. 2014;93-94:101–118. [Google Scholar]
- 38.R Development Core Team . R: A Language and Environment for Statistical Computing. R Foundation for Statistical Computing; Vienna, Austria: 2011. [Google Scholar]
- 39.Soetaert K, Meysman F. 2009. ReacTran: Reactive transport modelling in 1D, 2D and 3D (R package version 1.4.2)
- 40.Soetaert K, Petzoldt T, Meysman F. 2010. marelac: Tools for Aquatic Sciences (R package version 2.1.5)
- 41. Gattuso et al (2015) seacarb: Seawater Carbonate Chemistry (R package version 3.0.11)
- 42.Hofmann AF, Meysman FJR, Soetaert K, Middleburg JJ. A step-by-step procedure for pH model construction in aquatic systems. Biogeosciences. 2008;5:227–251. [Google Scholar]
- 43.Zeebe RE, Wolf-Gladrow D. 2001. CO2 in Seawater: Equilibrium, Kinetics, Isotopes. Elsevier Oceanography Series 65 (Elsevier, Amsterdam)
- 44.Bénézeth P, Dandurand JL, Harrichoury JC. Solubility product of siderite (FeCO3) as a function of temperature (25–250 °C) Chem Geol. 2009;265:3–12. [Google Scholar]
- 45.Silva CAR, Liu XW, Millero FJ. Solubility of siderite (FeCO3) in NaCl solutions. J Solution Chem. 2002;31:97–108. [Google Scholar]
- 46.Dick JM. 2015. CHNOSZ: Chemical Thermodynamics and Activity Diagrams (R package version 1.0.7)
- 47.Hunter KS, Wang Y, Van Cappellen P. Kinetic modeling of microbially-derived redox chemistry of subsurface environments: Coupling transport, microbial metabolism and geochemistry. J Hydrol (Amsterdam) 1998;209:53–80. doi: 10.1016/s0169-7722(00)00158-3. [DOI] [PubMed] [Google Scholar]
- 48.Liu C, Kota S, Zachara JM, Fredrickson JK, Brinkman CK. Kinetic analysis of the bacterial reduction of goethite. Environ Sci Technol. 2001;35(12):2482–2490. doi: 10.1021/es001956c. [DOI] [PubMed] [Google Scholar]
- 49.Matsunaga T, Karametaxas G, von Gunten HR, Lichtner PC. Redox chemistry of iron and manganese minerals in river-recharged aquifers: A model interpretation of a column experiment. Geochim Cosmochim Acta. 1993;57:1691–1704. [Google Scholar]
- 50.Johnson ML. 1990. Ferrous Carbonate Precipitation Kinetics. A Temperature Ramped Approach. Ph.D. thesis. (Rice University, Houston, TX)
- 51.Bandstra JZ, Brantley SL. Data fitting techniques with applications to mineral dissolution kinetics. In: Brantley SL, Kubicki JD, White AF, editors. Kinetics of Water-Rock Interaction. Springer; New York: 2008. [Google Scholar]
- 52.ten Berge HFM, et al. Olivine weathering in soil, and its effects on growth and nutrient uptake in Ryegrass (Lolium perenne L.): A pot experiment. PLoS One. 2012;7(8):e42098. doi: 10.1371/journal.pone.0042098. [DOI] [PMC free article] [PubMed] [Google Scholar]
- 53.Helgson HC. Summary and critique of the thermodynamic properties of rock-forming minerals. Am J Sci. 1978;278A:1–229. [Google Scholar]


