A circumscribed subregion of the pontine medial parabrachial nucleus plays a key role in the control of breathing frequency primarily via changes in expiratory duration. Excitation of this subregion triggers the onset of the inspiratory phase, resulting in a stereotypical ramplike phrenic activity pattern independent of time within the expiratory phase. The ability to pace the I-burst rate suggests that the in vivo I-pattern generating network must contain functioning pacemaker neurons.
Keywords: pons, control of breathing, rhythm generation, phrenic neurogram, expiratory off-switch
Abstract
The role of the dorsolateral pons in the control of expiratory duration (Te) and breathing frequency is incompletely understood. A subregion of the pontine parabrachial-Kölliker-Fuse (PB-KF) complex of dogs was identified via microinjections, in which localized pharmacologically induced increases in neuronal activity produced increases in breathing rate while decreases in neuronal activity produced decreases in breathing rate. This subregion is also very sensitive to local and systemic opioids. The purpose of this study was to precisely characterize the relationship between the PB-KF subregion pattern of altered neuronal activity and the control of respiratory phase timing as well as the time course of the phrenic nerve activity/neurogram (PNG). Pulse train electrical stimulation patterns synchronized with the onset of the expiratory (E) and/or phrenic inspiratory (I) phase were delivered via a small concentric bipolar electrode while the PNG was recorded in decerebrate, vagotomized dogs. Step frequency patterns during the E phase produced a marked frequency-dependent decrease in Te, while similar step inputs during the I phase increased inspiratory duration (Ti) by 14 ± 3%. Delayed pulse trains were capable of pacing the breathing rate by terminating the E phase and also of triggering a consistent stereotypical inspiratory PNG pattern, even when evoked during apnea. This property suggests that the I-phase pattern generator functions in a monostable circuit mode with a stable E phase and a transient I phase. Thus the I-pattern generator must contain neurons with nonlinear pacemaker-like properties, which allow the network to rapidly obtain a full on-state followed by relatively slow inactivation. The activated network can be further modulated and supplies excitatory drive to the neurons involved with pattern generation.
NEW & NOTEWORTHY A circumscribed subregion of the pontine medial parabrachial nucleus plays a key role in the control of breathing frequency primarily via changes in expiratory duration. Excitation of this subregion triggers the onset of the inspiratory phase, resulting in a stereotypical ramplike phrenic activity pattern independent of time within the expiratory phase. The ability to pace the I-burst rate suggests that the in vivo I-pattern generating network must contain functioning pacemaker neurons.
a “eupneic” activity pattern describes phrenic neural activity present during resting breathing conditions characterized by quiet, unlabored breaths. Generation of a eupneic breathing pattern requires the functional integrity and coordination of the entire pontine and medullary portions of the brain stem. Transection experiments in an in situ model show that removal of the pons abolishes the eupneic pattern. Apneusis, a sustained pause in the inspiratory (I) phase that decreases breathing frequency, occurs when neurons in a region of the rostral pons, termed the pneumotaxic center, are ablated. With progressive ablation of the pons the I phase and expiratory (E) phase during apneusis shorten, and with total removal of the pons the pattern of ventilatory activity is altered to one of gasping (St-John and Paton 2003). A recent review suggested that the distinctive features of the pontine parabrachial-Kölliker-Fuse (PB-KF) complex are the regulation of the I-to-E phase transition and the dynamic control of upper airway patency during the respiratory cycle. However, this role may be species dependent (Dutschmann and Dick 2012), since in a decerebrate canine model the pontine parabrachial (PB) region appears to control the E-to-I phase transition and thereby expiratory duration (Te).
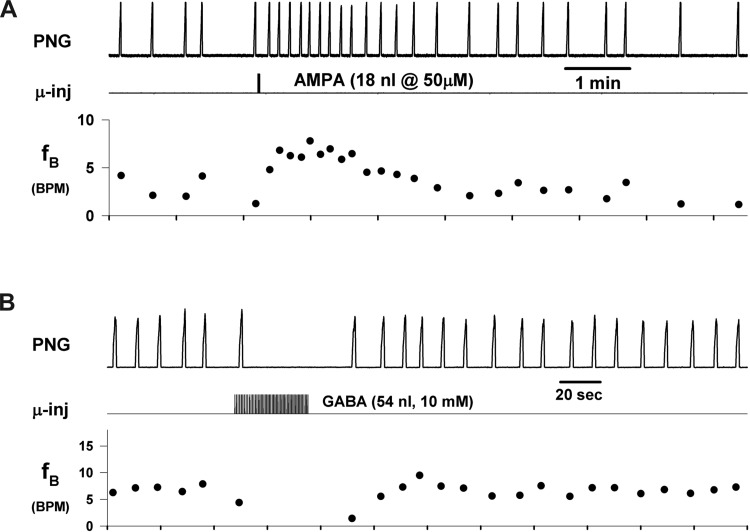
The importance of the dorsolateral pons in the control of breathing frequency has been further underscored by the recent finding that bradypnea induced by systemic administration of the μ-opioid receptor (MOR) agonist remifentanil at clinically relevant concentrations could be reversed by local injections of naloxone into the PB-KF region in dogs (Prkic et al. 2012). In addition, direct local microinjections of the MOR agonist [d-Ala2,N-MePhe4,Gly-ol5]-enkephalin (DAMGO) into the same pontine region produced a marked bradypnea and could even lead to apnea. Subsequently, a subregion of the PB-KF complex was identified (Zuperku et al. 2015a) in which glutamate agonist-induced increases in neuronal activity by local microinjection produced a marked tachypneic response (e.g., Fig. 1A). Conversely, localized GABA-induced reductions in neuronal activity within this PB subregion produced bradypnea and apnea (e.g., Fig. 1B).
Fig. 1.
Microinjections of ionotropic neurotransmitter agonists into the PB subregion produce changes in breathing rate (fB). A: microinjection of the glutamatergic agonist AMPA caused a marked transient increase in fictive breathing rate. B: microinjection of GABA produced bradypnea and transient apnea. Recordings from 2 different dogs. PNG, phrenic neurogram; μ-inj, microinjection injection marker; fB, cycle-to-cycle breathing rate [breaths/min (BPM)]. Note that the dominant effect is in expiratory duration, while peak PNG is essentially unaltered.
In light of the wide range of breathing frequency responses (tachypnea to apnea) elicited from this pontine subregion, we hypothesize that this pontine subregion plays a major role in the control of breathing frequency, primarily by advancing the onset of the I phase and terminating the E phase. In contrast, previous studies have focused on the role of the PB-KF complex in the control of the I off-switch (reviewed in Dutschmann and Dick 2012). The purpose of the present study was to precisely characterize the relationship between the patterns of induced activity within the PB subregion and the control of phase timing and the time course of the phrenic nerve activity or phrenic neurogram (PNG).
While pharmacological manipulation of neuronal activity within the PB subregion can provide insight into its functional characteristics (e.g., Fig. 1), the temporal properties of the pharmacokinetics/dynamics of the microinjections limit precision in terms of the timing of the stimulus within the respiratory cycle as well as its magnitude. Accordingly, we delivered weak pulse train electrical stimulation patterns via a small concentric bipolar electrode, which were synchronized with the onset of the E and/or I phase, while recording the PNG in an in vivo canine model.
METHODS
This research was approved by the subcommittee on animal studies of the Zablocki Department of Veterans Affairs (VA) Medical Center in accordance with provisions of the Animal Welfare Act, the Guide for the Care and Use of Laboratory Animals, and VA policy. Experiments were performed on 25 beagle dogs of either sex, weighing 9–12 kg. Inhalational anesthesia was induced by mask and maintained with isoflurane at 1.5–2.5% end-tidal concentration. The animals were monitored for signs of inadequate anesthesia such as salivation, lacrimation, and increases in blood pressure and heart rate. If required, anesthetic depth was increased immediately.
Surgical procedures.
The anesthetized dogs were intubated with a cuffed endotracheal tube, and their lungs were mechanically ventilated with an air-O2-isoflurane mixture. The femoral artery was cannulated for blood pressure recording and blood gas sampling and the femoral vein for continuous infusion of maintenance fluids and administration of drugs. The animals were positioned in a stereotaxic device (model 1530; David Kopf Instruments, Tujunga, CA) with the head ventrally flexed (30°). A bilateral pneumothorax was performed to minimize brain stem movement and phasic inputs from chest wall mechanoreceptors. The animal was decerebrated by midcollicular transection (Tonkovic-Capin et al. 1998), and then isoflurane anesthesia was discontinued. The animals were ventilated with an air-O2 mixture and maintained in hyperoxic isocapnia (FiO2 > 0.6, end-tidal CO2 range 40–50 mmHg). Complete access of the dorsal surface of the brain stem was obtained by an occipital-parietal craniotomy followed by cerebellectomy and external sagittal and nuchal bone crest removal. After bilateral neck dissections, phrenic nerve activity was recorded from the desheathed right C5 rootlet. Bilateral vagotomy was performed to achieve peripheral deafferentation to avoid interference of the mechanical ventilation with the underlying central respiratory rhythm and respiratory neuronal activity. The PNG was obtained from the moving time average (time constant: 100 ms) of the amplified phrenic nerve activity and was used to produce timing pulses corresponding to the beginning and end of the I phase for the measurement of inspiratory duration (Ti) and expiratory duration (Te). Peak phrenic activity (PPA) was also obtained from the PNG. Continuous neuromuscular block was achieved with cisatracurium besylate (1 mg/kg bolus followed by 0.5 mg·kg−1·h−1 iv infusion) to reduce motion artifacts during neuronal recordings. Esophageal temperature was maintained at 38.5 ± 0.5°C with a heating pad. Mean arterial pressure was maintained above 80 mmHg with adjustment of intravenous fluids and, when needed, phenylephrine infusion (0.5–5 mg·kg−1·min−1).
Electrical stimulation technique.
A concentric bipolar electrode was positioned in the medial PB region 4.5–5.5 mm lateral to the pontine midline and 2–3 mm caudal to the caudal pole of the inferior colliculus (IC). This location has previously been shown to produce robust tachypneic responses to (±)-α-amino-3-hydroxy-5-methylisoxazole-propionic acid (AMPA) microinjections. The concentric electrode (no. CBCPE75; FHC, Bowdoin, ME) consisted of a 50-μm platinum-iridium inner electrode and a 250-μm stainless steel 10-mm-long outer electrode, insulated up to the tip, with an epoxy seal between the electrodes. The pencil-point tip with a grind angle of 45° results in an average separation between electrodes of ∼175 μm, which was sufficient to locally depolarize enough neurons to obtain robust effects at low current strengths. While small in diameter, this configuration is durable and can be reused multiple times.
A programmable constant-current stimulator was used to deliver pulse trains [step or delayed step frequency (Fstep) patterns] synchronized to the onset of the I or E phase. The stimulus strength was adjusted to 1.2–1.4 times the minimum threshold level that induced a decrease in Te, typically 80–120 μA and 100-μs in pulse duration. If necessary, the electrode was repositioned to optimize the response. With step frequencies of 50–100 Hz applied every other phrenic cycle, the electrode was slowly lowered from the dorsal surface until a depth was reached at which an optimal response was obtained. By delivering the stimulus every other phrenic cycle, it was easy to compare the effect of the stimulus on Te vs. the adjacent no-stimulus control cycles.
Microinjection technique.
Multibarrel micropipettes (10- to 30-μm composite tip diameter) consisting of a recording barrel containing a 7-μm-thick carbon filament and three drug barrels were used for pressure microinjections. Recordings of respiratory-related neuronal activity within the medial PB region were used as a guide, especially for depth from the dorsal pontine surface, to locate the tachypneic region via AMPA microinjections. Adjustments in the lateral (midline) and caudal (IC) coordinates were used to determine the most sensitive response location. The microinjections consisted of the glutamatergic agonist AMPA (15–50 μM) at 18, 36 and 76 nl (25th, 50th, and 75th percentile values) or GABA (10 mM) at 19, 36, and 41 nl (25th, 50th, and 75th percentile values), which were dissolved in artificial cerebrospinal fluid. These drugs were placed in more than one barrel to serve as a backup if a barrel became obstructed. The microinjected volumes were measured via height changes of the meniscus in the pipette barrel with a ×100 magnification microscope equipped with a reticule (resolution ∼2 nl).
Arterial blood pressure, airway CO2 concentration, microinjection marker, stimulus frequency pattern, breath-to-breath Ti, Te, and PNG signals were continuously recorded online with a PowerLab system (ADInstruments, Castle Hill, Australia; 16SP and LabChart). Postexperiment LabChart data were exported to SigmaPlot 11 (Systat Software, San Jose, CA) for data reduction, data plotting, and statistical analysis. Software algorithms written in SigmaPlot transform language were used to calculate cycle-to-cycle values of Ti, Te, peak PNG (PPA), and stimulus frequency and to sort data according to stimulus frequency patterns as well as to superimpose PNG patterns.
At the conclusion of several experimental protocols, bilateral microinjections (0.5–1 μl) of fluorescent latex microspheres (Red Retrobeads; https://lumafluor.com), diluted to 5% of the supplied concentration, were used to mark the stimulation sites for histology analysis. The brain stems were removed postmortem and submersed in paraformaldehyde fixative (4%) for 1 wk before being frozen and sectioned. Sequential sections (of 25-μm thickness) were cut from 2 mm rostral to 5 mm caudal to the caudal aspect of the IC. Alternate sections were stained with neutral red for histological identification of nuclear groups and compared with unstained adjacent sections showing fluorescent beads.
Statistical analyses.
A one-way ANOVA was used to analyze changes in Te, Ti, and PPA produced by Fstep patterns with respect to nonstimulated control cycles. The Holm-Sidak method was used for pairwise multiple comparisons with a family-wide error rate of 0.05. For all data sets, tests for normality (Kolmogorov-Smirnov test) were performed before parametric procedures were used. For data sets that failed the normality test, a Kruskal-Wallis one-way ANOVA on ranks was used with Dunn's method for multiple comparisons vs. the control group. Differences were considered significant at P < 0.05. Values are expressed as means ± SE.
RESULTS
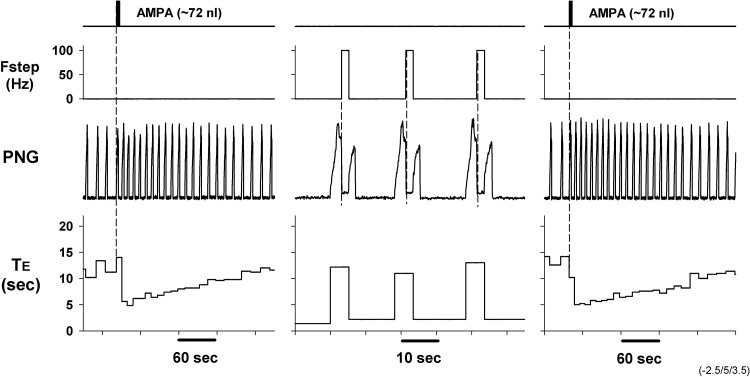
To verify that electrically induced effects were acting at the same location as the responses due to AMPA microinjections, we used a multibarrel micropipette with a carbon filament in one of the barrels to deliver electrical stimulation (monopolar), with the responses due to AMPA microinjections delivered from another barrel. The results from such a protocol are shown in Fig. 2, where step frequencies of 100 Hz throughout the E phase for alternating phrenic cycles produced a robust shortening of Te (Fig. 2, center); responses to AMPA microinjections with the same microelectrode at the same location are shown before and after electrical stimuli-induced responses for comparison (note different timescales). These results suggest that both types of stimulation are acting at the same location and support the use of electrical stimulation to characterize the relationship between the induced activity of these neurons and the changes in the phase timing.
Fig. 2.
Comparison of 2 complementary local methods to activate the PB subregion. Left: microinjection of AMPA produced a marked tachypnea mainly by decreasing Te (from ∼10 s to ∼5 s). Center: after return to baseline conditions, monopolar stimulation of 100 Hz during the E phase (Fstep) via a carbon fiber in 1 barrel of a multibarrel pipette shortened Te from ∼10 s to ∼2 s. Te values are updated at the onset of each PNG and are seen during the following cycle. Right: repeated microinjection of AMPA induced a response comparable to the initial microinjection, demonstrating repeatability of the responses.
Anatomical location of PB subregion that strongly modifies phrenic burst rate.
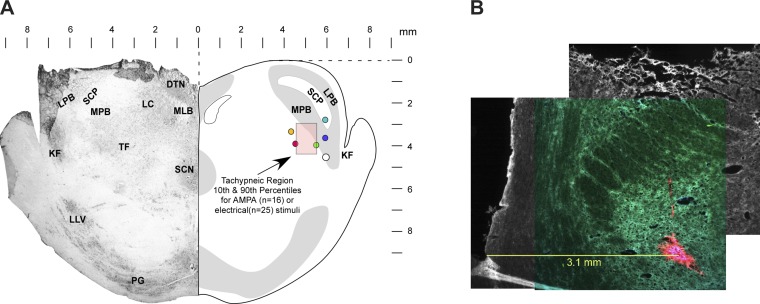
The location of the tachypneic PB subregion was determined in all animals via stereotaxic coordinates relative to the pontine midline, caudal aspect of the IC, and the dorsal surface and in a subgroup of animals by microinjections of fluorescent beads. Based on the maximal tachypneic responses from 25 dogs, the 10th, 50th, and 90th percentiles for the rostral-caudal direction were −3.0, −2.0, and −2.0 mm, for the medial-lateral direction 4.0, 4.5, and 5.2 mm, and for the depth 2.0, 3.0, and 4.8 mm ventral to the dorsal surface (Fig. 3A, pink box). These coordinates projected on a representative transverse section matched with those obtained with AMPA microinjections in an earlier study (Zuperku et al. 2015a; n = 16 dogs). The filled circles in Fig. 3A show locations of AMPA-induced tachypnea indicated by fluorescent bead microinjections (e.g., Fig. 3B).
Fig. 3.
A: transverse section of rostral pons 1–2 mm caudal to the caudal pole of the inferior colliculus shows the locations where AMPA microinjections or electrical stimuli induced maximal tachypneic responses. Pink shaded box indicates the 10th and 90th percentiles of the stereotaxic coordinates of the Te-sensitive region. Filled circles indicate locations of fluorescent beads marking the location of the maximal tachypneic responses (n = 6 dogs). B: example showing fluorescent beads (red), medial to the superior cerebellar peduncle, where AMPA microinjections produced a marked tachypneic response. The image is a composite montage of 3 images to provide a more detailed perspective of the lateral and dorsal aspects of the transverse slice. DTN, dorsal tegmental nucleus; KF, Kölliker-Fuse nucleus; LC, locus coeruleus; LLV, lateral lemniscus ventral nucleus; LPB, lateral parabrachial nucleus; MLB, medial longitudinal bundle; MPB, medial parabrachial nucleus; PG, pontine gray; SCN, superior central nucleus; SCP, superior cerebellar peduncle; TF, tegmental field.
Phase-timing responses to step-frequency electrical inputs during E or I phases.
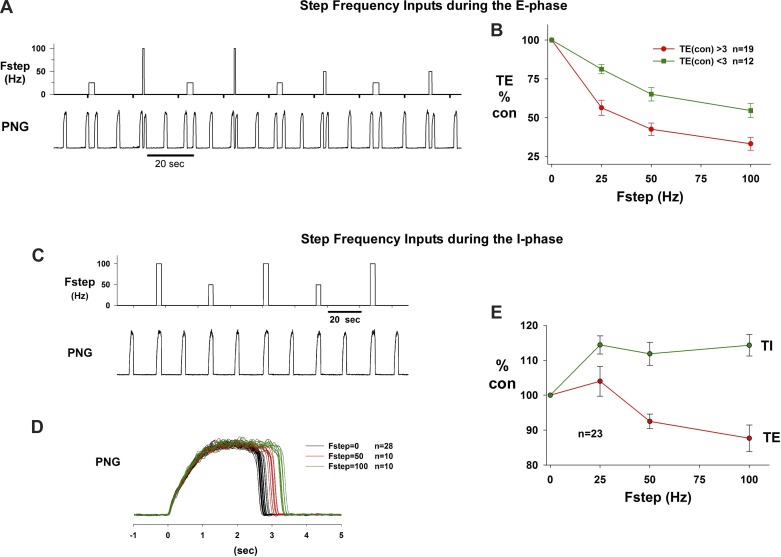
The Fstep patterns triggered at the onset of the E phase of a test cycle and terminated by the onset of the following I phase consisted of 25-, 50-, and 100-Hz pulse trains. The test cycles were separated by at least one nonstimulated (control; Fstep = 0) cycle (e.g., Fig. 4A). The Fstep patterns were repeated 10 times for each frequency. Fsteps of 25, 50, and 100 Hz markedly shortened Te from ∼8.5 s (control cycles) to ∼2.1, 1.3, and 0.7 s, respectively. This protocol was repeated approximately five times in each of six dogs. Plots of normalized Te vs. Fstep for the group data are shown in Fig. 4B; the plot in red is for 19 stimulus protocols for animals in which the control Te was >3 s, while the green plot represents 12 stimulus protocols in which control Te was <3 s. The 3 s value was chosen as cutoff based on a distinct increase in the slope at the 3-s level of a plot of control Te vs. rank order. Since there is an absolute minimum value to which Te can be shortened, the maximum percentage of shortening of Te of those runs with control Te < 3 s was distinctly less than those with control Te > 3 s. The average decreases at Fstep = 100 for Te < 3 s and Te > 3 s were 45 ± 5% and 67 ± 4%, respectively.
Fig. 4.
A: example of the step frequency (Fstep) protocol that produced graded shortening of Te for Fstep of 25, 50, and 100 Hz. B: plots of mean ± SE Te vs. Fstep show monotonic decrease in Te. Green, plots for 12 dogs where control Te was <3 s; red, plots for 19 dogs where control Te was >3 s. C: example protocol for Fstep inputs during the I phase. D: superimposed PNG traces from C show that Ti increased from ∼2.8 s to ∼3.4 s with no change in peak PNG. E: plots of group data for Ti and following Te vs. Fstep. See text for details.
In the same group of animals, the responses to Fstep inputs during the I phase of alternating cycles were also analyzed (e.g., Fig. 4C). The main effect was a small increase in Ti, which is more readily recognizable in the superimposed PNG traces at each Fstep (Fig. 4D). The group data for this protocol are shown in Fig. 4E for both Ti and the following Te. The average increase in Ti for Fstep = 100 in the I phase was 14 ± 3%, while the following Te decreased by 12 ± 4%. Compared with Fstep inputs during the E phase, the responses to Fstep inputs during the I phase were relatively small.
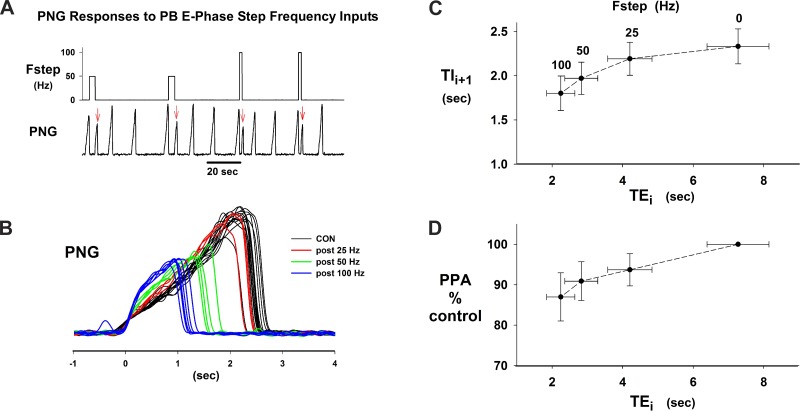
In contrast, both Ti and peak PNG following an Fstep input during the preceding E phase were markedly affected (e.g., Fig. 5, A and B). In this example, Fstep = 25 Hz resulted in only a small decrease in Ti (Fig. 5B), while Fstep = 50 Hz and 100 Hz produced a marked shortening of Ti with a reduction in peak PNG; for example, Ti decreased from ∼2.5 s to ∼1 s for Fstep of 100 Hz and peak PNG decreased by ∼50%. Plots for the group data that quantify these effects in 15 dogs are shown in Fig. 5C for average Te vs. average Ti and in Fig. 5D for peak PNG vs. Te. For Fstep = 100 Hz, Tii+1 decreased from 2.3 ± 0.2 s to 1.8 ± 0.2 s or by 22% and peak PNG decreased from 100% to 87 ± 6%.
Fig. 5.
I phase effects following PB subregion stimulation during the preceding E phase. A: chart record illustrating poststimulus effects on the PNG pattern (red arrows). B: superimposed PNGs from protocol shown in A. Note decrease in Ti and peak PNG as a function of Fstep. C: plot of Ti (Tii+1) vs. the previous Te (Tei) for group data. Fstep stimulus frequency is indicated above corresponding Te values. D: group data plot of peak PNG (PPA) vs. Te for the I phase following the stimulated E phase. Data in C and D are from the same 15 dogs.
Phase-timing responses to delayed step-frequency inputs during E phase.
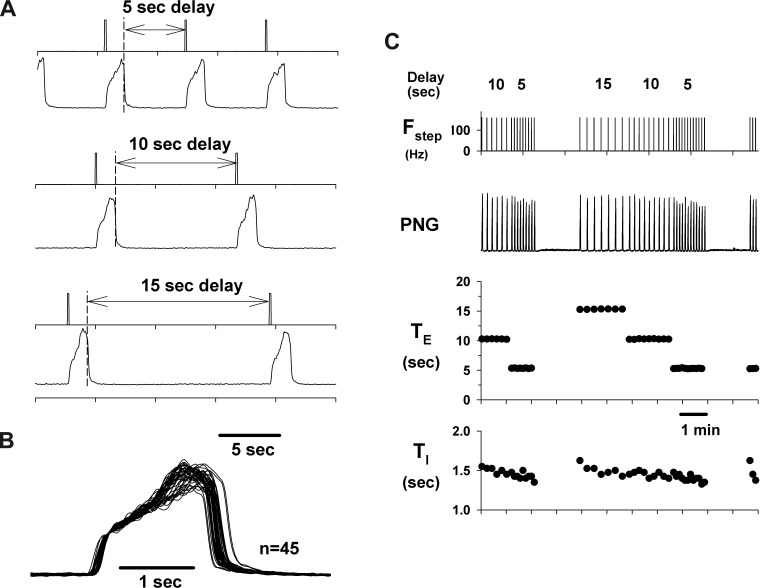
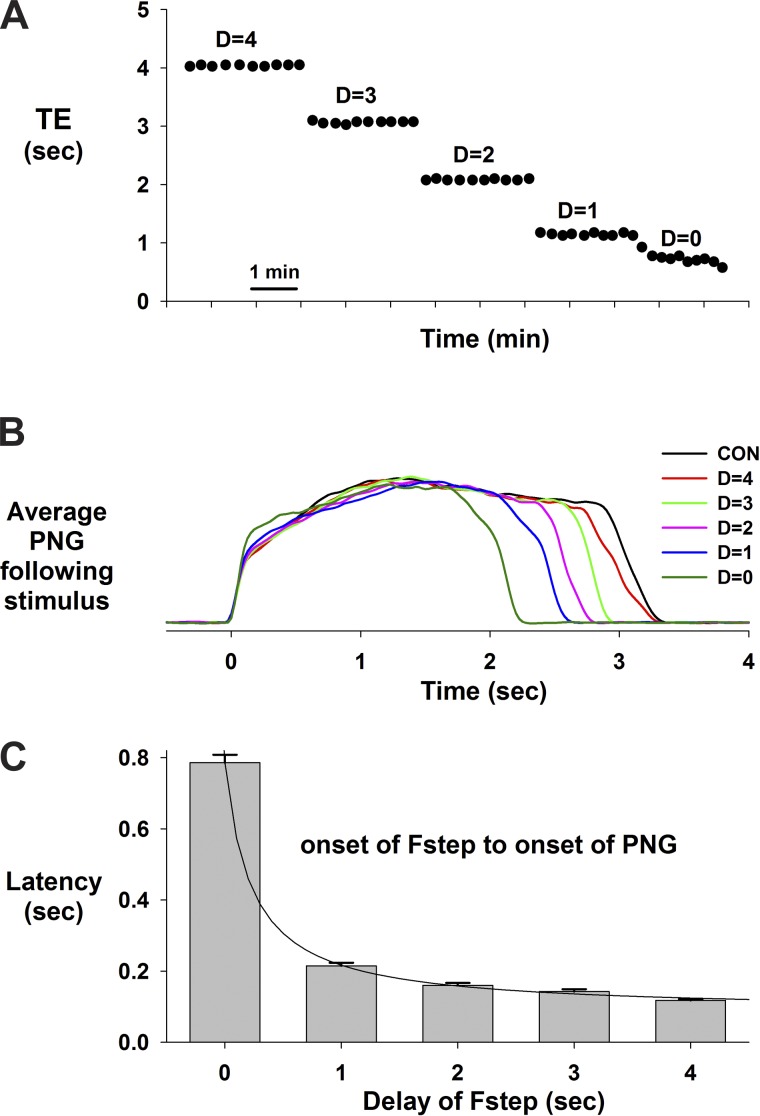
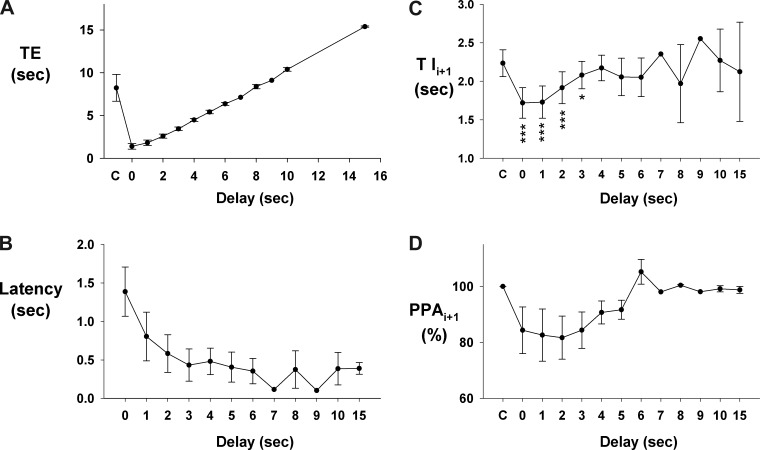
A protocol that used delayed electrical pulse trains, synchronized with the onset of the E phase, showed that the inspiratory/PNG rate could be paced. This is demonstrated in a pronounced way for a dog with a very slow control inspiratory/PNG rate in Fig. 6A for stimulus delays of 5, 10, and 15 s. The consistency of this effect is shown by the Te plot in Fig. 6C for an ∼11-min epoch. Superimposing the PNGs shows that the profile of PNG is little changed at any of these delays. This indicates that the I-pattern generator can be triggered to produce a predetermined pattern for one cycle and then returns to a “quiescent or inactive” state until retriggered. At shorter delays, the PNG rate could still be paced (e.g., Fig. 7A). However, the duration of the following PNG, Tii+1, is proportionally reduced as shown by the cycle-triggered averages of the PNGs for each of the delays relative to the nonstimulated control cycles (Fig. 7B). The profile of the PNG was essentially unchanged. The latencies from the start of Fstep to the onset of the PNG became progressively longer as the delay of the Fstep decreased (Fig. 7C). Thus larger pontine inputs were required to trigger the start of the I phase following the shorter E-durations, which suggests refractoriness of the I-pattern generator from the preceding I cycle. The pooled data from nine dogs for the PNG responses to delayed-pulse trains are shown in Fig. 8. Te was linearly related to the delay (Fig. 8A). For shorter delays (0–3 s) the latency from the onset of the pulse train to the onset of the PNG gradually decreased from 1.4 ± 0.3 to 0.4 ± 0.2 s (Fig. 8B). The latencies for all delays were significantly less than at 0 delay (0.001 < P < 0.003). Tii+1 values were shorter than control values for delays from 0 to 3 s (Fig. 8C). A similar trend (nonsignificant) was seen for PPAi+1 (Fig. 8D).
Fig. 6.
The I-pattern generator can be triggered and paced by delayed PB inputs during the E phase. A: example showing initiation of the I phase by delayed pulse trains triggered from the onset of the E phase. B: superimposed PNGs for the data of C show essentially no change in peak PNG at any of the delays. C: Te data show the consistency of the control of Te for the delays indicated. During the apneic periods (gaps in the PNG burst rate caused by ending the stimulus protocol) it was necessary to trigger the I phase to initiate a subsequent series of delayed PB inputs. Changes in Ti were very moderate.
Fig. 7.
Pacing during the E phase at shorter delays produced a proportionate decrease in Te. A: Te values vs. time for cycle-by-cycle repeated delayed inputs (D), including no delay (D = 0). B: corresponding ensemble-averaged PNGs (n = 10 cycles) for each of the delays indicated, including cycles without stimuli (CON). C: latencies from the start of the pulse train (100 Hz) to the start of the I phase indicate that larger PB inputs (more pulses) were required to trigger the I phase at the shorter delays, suggesting refractoriness from the preceding I phase.
Fig. 8.
Pooled data for responses to delayed-pulse trains in 9 dogs. A: Te is a linear function of the delay; axis label “C” is nonstimulated control. B: latency of evoked PNG as function of delay. C: E phase stimulus effects on the following Ti as a function of delay. At short delays (0–3 s) that induced short Tes there was a significant decrease in the following Tii+1 values, which returned to control values at the longer delays. D: E phase stimulus effects on the following peak PNG (PPAi+1) as a function of delay. There was a tendency for a decrease in PPA values at the shorter delays similar to the effects on Tii+1. The number of points/delay ranged from 5 to 8 for delays from 0 to 5 s, and fewer at the longer delays. *P < 0.05; ***P < 0.001 for differences relative to control “C.”
Desensitization of Te response to PB subregion stimulation.
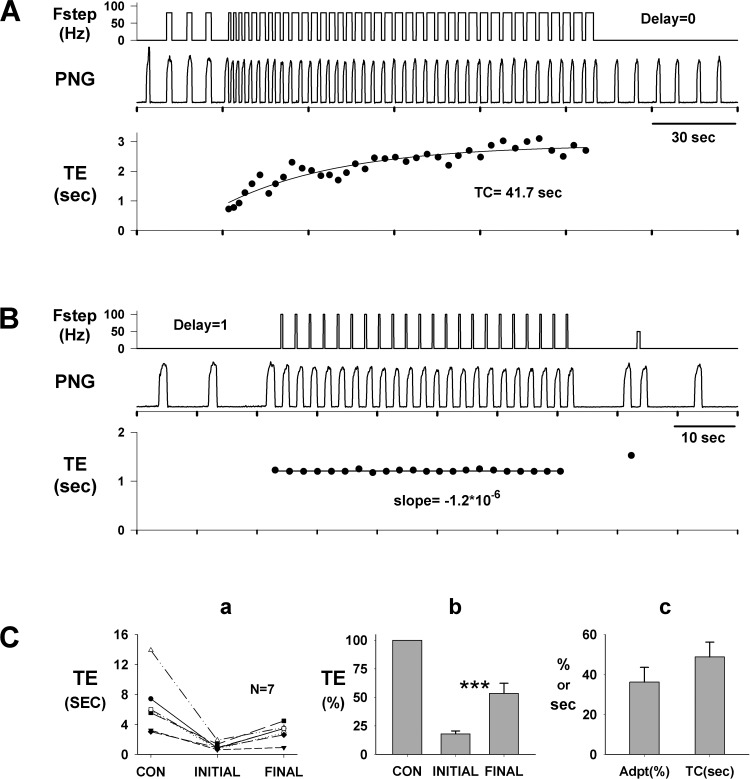
Repeated Fstep inputs during consecutive E phases show that the effect on Te shortening adapted over time (Fig. 9A). Initially, Fstep of 100 Hz with no delay decreased Te from 5.6 s (prestimulus) to 0.75 s and then gradually decreased to only 2.8 s at the end of the stimulus period. This indicated that the desensitization of the response amounted to ∼42% with a time constant of 41.7 s.
Fig. 9.
Desensitization of the Te response to PB subregion stimulation. A: decrease in the effectiveness of consecutive step inputs with 0 delay in shortening Te. After 3 cycles, stimulus pattern was switched from the I phase to the E phase. Te decreased from ∼5.6 s (off scale) to 0.75 s initially, followed by a gradual increase to ∼ 2.8 s with a time constant (TC; monoexponential fit) of ∼42 s. Immediately after the termination of the step inputs, Te returned to the control level. B: in the same dog, no adaptation in Te was observed with pulse trains delayed by 1 s. Te decreased from ∼7.2 s (off scale) to 1.2 s, where it remained through the run. These data (A vs. B) suggest that the input during the 1st second following the onset of the E phase contributes to desensitization. Ca: pooled data (n = 7 dogs) for responses to consecutive step frequency stimuli during the E phase with no delay (e.g., A). Te values are shown for the prestimulus control (CON), the 1st stimulated cycle (initial), and the last stimulated cycle (final) in runs, which reached steady state, i.e., no further adaptation occurred. Cb: same data (Ca) normalized to control Te show significant desensitization (***P < 0.001). Te(initial): 18.0 ± 2.6%; Te(final): 53.5 ± 8.8%. Cc: magnitude of desensitization [36.2 ± 7.3% (Adpt)] and time constant (48.8 ± 7.4 s; TC) obtained from plots similar to A, bottom.
In contrast and in the same dog, Fsteps of 100 Hz delayed by 1 s, which triggered the onset of the PNG with short-duration pulse trains, did not exhibit desensitization of the Te response (Fig. 9B). Prestimulus Te averaged 7.2 s and was decreased to 1.2 s and did not change (slope ≈ 0). These results suggest that the additional input from the PB subregion that was applied throughout the E phase (Fig. 9A) contributed to an adaptive mechanism that counteracts a portion of the induced shortening of Te. This effect can also be seen by the larger response latency in Fig. 7C for zero delay. The pooled data from seven dogs show desensitization for consecutive step inputs with zero delay (Fig. 9A) as an increase from the initial shortening of Te (18 ± 2.6%) to the final steady-state Te value (53.5 ± 8.8%; Fig. 9B). Monoexponential fits of the desensitization time courses (e.g., Fig. 9A, bottom) yielded a magnitude of 36.2 ± 7.3% and a time constant of 48.8 ± 7.4 s (n = 7).
Responses to continuous graded inputs.
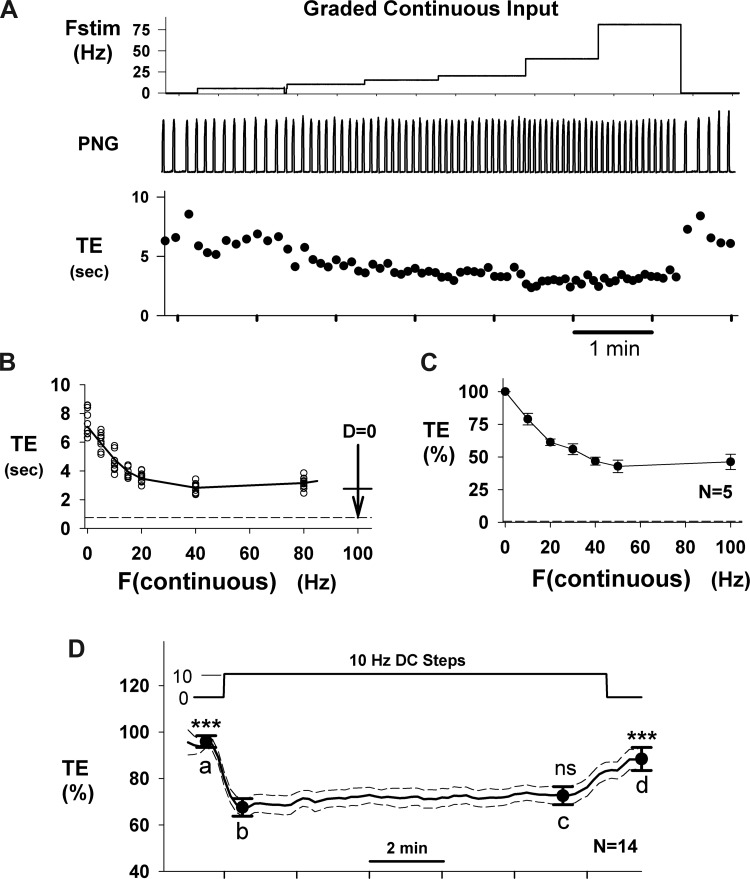
The Te responses to continuous Fstep inputs as a function of frequency also exhibit desensitization for Fstep > 15–20 Hz (e.g., Fig. 10A). This effect is more clearly seen in Fig. 10B in the plot of Te vs. frequency. In the 0–15 Hz range the relationship is very linear, with a slope of −0.22 s/Hz. However, at progressively higher frequencies the response exhibited both saturation and desensitization effects. The horizontal dashed line in Fig. 10B indicates the maximum degree of shortening obtainable with a 100-Hz Fstep pattern with no desensitization (1st stimulus cycle shown in Fig. 9A). For comparison, the vertical arrow in Fig. 10B indicates the change from prestimulus Te produced by the series of 100-Hz step inputs (Fig. 9A), where the horizontal bar on the arrow represents the final adapted value for that protocol, which is similar to the maximum degree of shortening due to the constant-frequency inputs. The Te response for 80 Hz was no greater than for 40 Hz, indicating that the effect of desensitization was present. The pooled data from five dogs showed a similar profile (Fig. 10C). In contrast, at Fstep < 20 Hz, little or no desensitization occurred, as seen, for example, in the pooled data (n = 14 dogs) of Fig. 10D, where a continuous 10-Hz input, applied for 10 min, exhibited no significant desensitization (time point c vs. time point b).
Fig. 10.
Te responses to continuous graded inputs exhibit desensitization. A: constant inputs for 8–12 cycles at frequencies of 5, 10, 15, 20, 40, and 80 Hz (Fstim; top) produce a graded decrease in Te with effectiveness that diminishes as frequency increases. B: plot of Te vs. stimulus frequency (F) shows a quasi-linear Te response for F ≤ 20 Hz. The length of the vertical arrow at F = 100 shows the magnitude of the Te change for the 1st cycle of the series of step inputs (Fig. 9A), and the horizontal line indicates the adapted Te level, which is similar to the Te level for 40- to 80-Hz continuous inputs. C: pooled data for normalized Te vs. continuous stimulus frequency from 5 dogs shows a quasi-linear relationship for F < 50 Hz. D: pooled Te responses (n = 14 dogs) to continuous 10-Hz stimulus for ∼10-min duration. Statistical comparisons (RM 1-way ANOVA) were made relative to point b, the initial step response. At 10 Hz, no significant desensitization was observed at point c (ns). Points a and d were significantly different from b (***P < 0.001). Te was decreased by 29.6 ± 3.4% by the 10-Hz step.
DISCUSSION
This study demonstrates the powerful control of Te, and hence breathing frequency, by a small subregion within the medial PB complex of dogs in vivo. Using highly localized bipolar constant-current electrical stimulation with various frequency patterns, we characterized the temporal summation of inputs mediated by the PB subregion neurons on E and I phase timing. The capacity of the PB subregion neurons to pace the I phrenic burst pattern without altering its time course suggests that this region is a major contributor to the E-I “on-switch” and/or E “off-switch” in mammals.
Pontine site of Te control.
Based on locations that resulted in maximal tachypneic responses to AMPA microinjections as well as optimal responses to bipolar electrical stimulation, the Te control region is located in the medial portion of the canine PB-KF complex (Fig. 3). This subregion is relatively small, with dimensions of ∼1 × 1.2 × 2.8 mm in the rostral-caudal, medial-lateral, and dorsal-ventral directions, respectively, based on the 10th and 90th percentile values for optimal responses and centered at ∼2 mm caudal to the caudal edge of the IC, 4.5 mm lateral to midline, and 3 mm ventral to the dorsal surface based on median values. It is known that AMPA directly excites neurons by activation of glutamatergic receptors leading to depolarization, while electrical stimulation potentially stimulates neurons and fibers of passage. However, since the locations and Te responses were qualitatively similar (e.g., Fig. 2) for both types of stimuli, we hypothesize that both stimuli were acting on the same neurons. Electrically evoked responses were more robust, which may be due to synchronous activation of neurons that would lead to more efficient temporal summation in the target region. It is possible that stimulation in this PB subregion induced neural activity in pathways that are involved with other functions, for example, recruitment of pacemaker-like neurons that do not normally control breathing but are more involved in the regulation of phase timing for a nonbreathing behavior. Our data show that the PB stimuli shortened the E phase without any change in the profile of the following PNG pattern, which appeared no different from those that occurred spontaneously. In contrast, in models of fictive cough large augmentations in PNG amplitude with increased Ti are observed when cough is induced (Segers et al. 2012; Shannon et al. 2000). With a multiple-electrode probe in preliminary studies of the responses of I and E neurons in the canine pre-Bötzinger (preBC)/Bötzinger (BC) region to stimulation of the PB subregion (Zuperku et al. 2016), E activity was depressed rather than augmented as would be expected with active expiratory effort during cough. It might be expected that other types of nonbreathing behavior may also be manifested by altered I patterns. In contrast, our present data suggest that electrically induced activity in the PB subregion activated medullary pacemaker-like neurons involved in the generation of the eupneic inspiratory pattern as manifested by the similarity of the induced pattern of the PNG with the eupneic control pattern.
In cats the medial PB is seen as a vital component of the pontine “pneumotaxic center,” whereas in rats the medial PB receives major projections from the gustatory nucleus of the solitary tract (Dutschmann and Dick 2012). Using bipolar electrical stimulation in cats, Cohen (1971) identified two regions in the medial PB nucleus, one dorsally that was I-facilitatory and the other more ventrally that was E-facilitatory. When short stimulus trains were applied to I-facilitatory loci during the E phase, the result was switching from the E to the I phase, that is, Te was shortened, while stimuli in the E-facilitatory region during the E phase prolonged Te. Stimuli applied during the mid and late I phase in either location terminated the I phase, thus shortening Ti. Studies by Bertrand and Hugelin (1971) that used single- and paired-pulse electrical stimulation showed synchronization of the onset of the I phase, i.e., E phase termination, at loci in the medial PB nucleus in agreement with Cohen's (1971) findings. Areas where synchronization of the onset of the E phase occurred were more laterally located in the PB-KF region. The present study taken together with these two earlier studies indicates that medial PB complex plays a key role in the control of the E phase in cats and dogs. In the rat model, Dutschmann and Herbert (2006) showed that glutamate microinjection in the lateral PB and KF region prolonged Te while bilateral microinjection of the GABAergic agonist isoguvacine produced an apneustic pattern in the phrenic and recurrent laryngeal nerve activities. Their data suggest that the intermediate KF might reflect the pneumotaxic center in rats, which appears to be involved in the gating of postinspiratory activity within the respiratory network (Dutschmann and Herbert 2006). Using microinjections of glutamate in the pontine PB region of adult rats, Chamberlin and Saper (1994) found overlapping regions for apneustic responses and tachypneic responses that were located lateral to the lateral edge of the superior cerebellar peduncle. Most of the apneustic responses were located in the KF nucleus, while most of the tachypneic responses were located more dorsally (Fig. 5, A and B, in Chamberlin and Saper 1994). Thus it appears that in the rat the lateral PB-KF complex is involved in breathing pattern control. In contrast, the present study shows that in dogs the tachypneic region is very consistently found in the medial PB nucleus and that it is rather small and circumscribed (Fig. 3).
Role of pons in eupneic pattern generation revealed by transection.
Precision transverse sectioning of the brain stem in situ has been used to study the role of the pons in generating a eupneic breathing pattern from respiratory-related activity in the medulla. By sequential rostral-to-caudal transections through the pontine-medullary respiratory network within an in situ perfused rat brain stem-spinal cord preparation, Smith et al. (2007) showed that the network dynamics reorganized. The normal three-phase respiratory rhythm transformed to a two-phase and then a one-phase rhythm as the network was reduced. Expression of the three-phase rhythm required the presence of the pons, generation of the two-phase rhythm depended on the integrity of BC and preBC complexes and interactions between them, and the one-phase rhythm was generated within the preBC complex. Their study led them to conclude that there are at least three rhythmogenic mechanisms embedded within hierarchically interacting pontine-medullary circuits that define the expression of different motor patterns for distinct physiological and pathophysiological respiratory behaviors. Their model stipulates that excitatory drive from the pons to the post-I BC neurons is responsible for the emergence of the third phase.
Using a different but related approach in an in situ perfused rat brain stem-spinal cord preparation, Jones and Dutschmann (2016) removed parts of the circuitry before reperfusion and reoxygenation of the tissue. It was posited that “a priori” transections reveal the rhythmogenic capacity of an anatomically predefined neural network, which is different from removing or disrupting ongoing synaptic activity. A priori transections at the level of the rostral aspect of the facial nucleus resulted in synchronized bursts across the functionally different motor outputs. They did not find a single respiratory cycle that had a sequential phase separation of either inspiration/postinspiration or inspiration/expiration. They concluded that descending pontine input is required to initiate and maintain a sequential motor pattern. In contrast, our present study recorded responses from a decerebrate in vivo preparation with intact bidirectional communication between the pontine and medullary networks.
Effects of temporal summation of PB subregion-induced activity on phase timing.
This study used unilateral, low-intensity constant-current pulse trains to induce activity with the step-pattern frequency and time of delivery relative to onset of the E or I phase as input variables. The magnitude of the responses would be related to the temporal summation of the volleys arriving within the rhythmogenic areas, which are presumably located in the preBC and BC regions of the medulla. The stimulus patterns were delivered every other phrenic respiratory cycle to allow comparison with the control, nonstimulated cycle (e.g., Fig. 4, A and C). In the protocol for Fstep inputs during the E phase, the pulse trains were triggered by the onset of the E phase and terminated at the onset of the following I phase. The data from this protocol clearly show the dependence of Te on Fstep up to ∼100 Hz (Fig. 4B). While not shown in our standard protocol, which used 25 Hz as a minimum input, even frequencies as low as 5–10 Hz also shortened Te (e.g., Fig. 10), indicating an available wide dynamic frequency range for the pontine control of breathing rate. Such range in discharge frequencies is exhibited by canine PRG neurons (e.g., Fig. 1, Zuperku et al. 2015b). It remains unknown which type(s) of PRG neurons provides this stimulus as well as their synaptic targets, including whether excitatory or inhibitory inputs are involved in mediating this control of Te. The direction of this effect, i.e., a shortening of Te, is opposite to that produced by vagal pulmonary stretch receptor (PSR) activity during the E phase, which results in prolongation of Te (D'Angelo 1985; Zuperku et al. 1982). We hypothesize that there is an interaction between these two opposing Te-controlling inputs to the rhythm generation network that is operative during various physiological conditions to optimize breathing rate. The nature of that interaction has yet to be determined.
Effects of inputs confined to I phase.
When step inputs were applied during the I phase in this Te-sensitive subregion Ti was increased, but only by 10–15%, and the response saturated to a maximum at the 25 Hz level and did not show frequency dependence (Fig. 4E). Peak phrenic activity was not noticeably altered (Fig. 4D). In contrast, Cohen (1971) reported that stimulation at the dorsolateral I-facilitatory point in cats caused an increase of phrenic discharge, followed by termination of the I phase at an earlier time than occurred without stimulation. However, Bertrand and Hugelin (1971) report synchronizing responses indicative of Ti prolongation in agreement with the present study.
Poststimulus effects.
A more prominent effect of the Fstep inputs during the E phase was produced on the subsequent PNG pattern, especially for short E-durations induced by Fstep inputs (Fig. 5, A and B). This was a graded effect, where shorter induced E-durations produced greater reductions in Ti and peak PNG. The group data shown in Fig. 5, C and D, indicate that the intensity of this effect increased for Te values less than ∼3 s, suggesting that the effects of the mechanism(s) underlying the induced shortening of Te carry over and alter the dynamics of the I-timing circuitry. Interestingly, increases in Te, induced by PSR activity during the E phase, produced increases in the following Ti without changes in the peak PNG (Zuperku and Hopp 1985).
Desensitization.
An additional property was a slow partial desensitization in the Te response to repetitive E phase (e.g., Fig. 9A) and tonic stimulation (Fig. 10A). This appears to be due to the magnitude of the input, since repeated pulse trains with short delays show no adaptation (Fig. 9B) as fewer pulses are required for the E-to-I switch (e.g., ∼20 pulses vs. ∼80 pulses for zero delay, where the number of pulses = latency × 100 Hz). This is also evident when comparing the latencies for 0- and 1-s delays in Fig. 7C, where the number of pulses is related to the duration of the latency. These findings suggest that PRG neurons with late-E patterns would be optimal in effecting the E-to-I switch. In the control of phase timing, the phenomenon of habituation to prolonged electrically induced input patterns from vagal afferents and PB inputs has been described (Siniaia et al. 2000; Younes et al. 1987). It appears to be the result of a parallel pathway that exhibits slow temporal summation properties, acts in opposition to the primary direct pathway, and desensitizes the response to input. This type of mechanism makes the central control system more responsive to transient inputs.
Pacing of I phase.
A striking characteristic of the responses initiated by this Te-sensitive subregion was the ability of delayed pulse trains, triggered by the onset of the E phase, to pace the breathing rate over a wide range and even to initiate a complete I cycle during apnea. A similar phenomenon was observed by Cohen (1971). In the present study, the delayed inputs were able to rapidly terminate the E phase and initiate an I cycle with a normal PNG pattern for various delays as seen by the overlapping PNGs in Fig. 6B. This suggests that the prevailing conditions within the I-pattern generating network are relatively constant and when the system is triggered it responds with a stereotypic eupneic-like pattern. However, at short delays, i.e., <3–4 s, the following Ti was shortened via earlier termination of the PNG pattern (Fig. 7B). In addition, the latency of I onset relative to the beginning of the pulse train became longer at shorter delays (Fig. 7C; delays ≤ 4 s), suggesting that a type of refractoriness exists from the previous I cycle that increases the trigger threshold required to switch on the I phase.
Similar characteristics in vitro.
These characteristics of Te control are very similar to findings in brain stem slices containing the preBC in neonatal mice, where the burst frequency of hypoglossal nerve (XII) activity could be altered over a very wide range via changes in extracellular K+ concentration without altering the pattern of the XII nerve burst (Del Negro et al. 2009). Microinjections of AMPA into the contralateral preBC depolarized ipsilateral preBC neurons recorded via patch clamp and were able to rapidly evoke a XII burst without altering its burst pattern, analogous to our unaltered PNG evoked from the medial PB region. Del Negro et al. (2009) also found an inverse relationship between response latency and the delay time of the AMPA microinjection relative to the preceding burst, which they surmised was due to relative refractoriness caused by afterhyperpolarizations in type 1 preBC neurons (Rekling and Feldman 1998). In our study, Ti and peak PNG were reduced after stimuli with short delays (Figs. 7 and 8), which did not occur for XII activity in the slice. Del Negro et al. (2009) proposed that the evoked XII activity was due to the AMPA-induced increase in recurrent excitation among the interconnected glutamatergic preBC interneurons, which is consistent with the group pacemaker hypothesis (Feldman and Del Negro 2006). This suggests a possible mechanism whereby an increase in medial PB activity increases the excitation to the preBC neurons, bringing them to a threshold level where regenerative recurrent excitation switches them to the full on-state and along with the associated neural network produces a complete inspiratory pattern manifested by the ramplike PNG pattern. From a function point of view, this phenomenon suggests that the I-phase pattern generator functions in a monostable mode with a stable E phase and a transient I phase. It also suggests that the I-pattern generator must contain within its network nonlinear voltage-dependent pacemaker-like properties, which enable elements of the network to rapidly obtain a full on-state followed by relatively slow inactivation that can be modulated (Butera et al. 1999). These bursting elements supply I-phase excitatory drive to the various types of network neurons involved with pattern generation, such as the ramplike pattern of the PNG (Janczewski et al. 2013; Krolo et al. 2000; Segers et al. 1987).
Hypothesized model for PB control of breathing frequency.
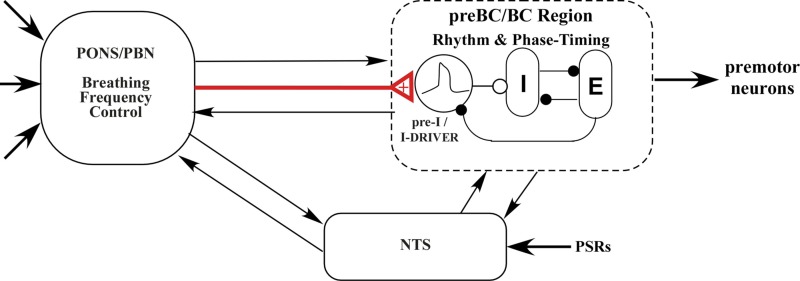
On the basis of the results of the present study and the current state of knowledge regarding the control of breathing, we propose the functional model shown in Fig. 11 to explain the PB subregion control of Te. The main premise involves advancing the time of switching on the I phase, and hence terminating the E phase. This conceptual model assumes that the medullary rhythm generation network includes conditional bursting pacemaker neurons of the form modeled by Butera et al. (1999), which increase their burst rate when excitation is increased (e.g., Fig. 1 in Del Negro et al. 2009) and act as an interconnected group pacemaker system (Feldman and Del Negro 2006). These pacemaker neurons, shown as pre-I neurons (Funk and Greer 2013) or I-driver neurons, supply phasic excitation to the pattern generating circuitry, depicted by reciprocal inhibitory interactions among the I and E neurons in the preBC/BC region (Fig. 11). Since both AMPA microinjections and electrical stimuli increase PB subregion neuronal activity and result in shortening of Te, while decreases in PB subregion neuronal activity by inhibitory agents result in prolonging Te, we conclude that this pontine input is excitatory in nature and more specifically increases excitation to the group pacemaker neurons, leading to an earlier onset of the I phase (red input, Fig. 11). When the spontaneous activity of the PB neurons is low and breathing rate is slow, an exogenous source of excitation can trigger the I-pattern generator to an “on state” and thus produce an eupneic PNG pattern, which was seen in the pacing protocol (e.g., Fig. 6). Since slowly adapting PSRs play a key role in modulating Ti and Te, mediated via the nucleus of the solitary tract, bidirectional interactions are shown with the medullary rhythmogenic region and the pons. Bidirectional interactions between the pons and the medulla have been described (see Dutschmann and Dick 2012 for review).
Fig. 11.
Hypothetical model for the PB subregion control of breathing rate. Red line: excitatory synaptic input from the PB subregion to the pre-I pacemaker neurons. Filled circles, inhibitory synaptic inputs; open circle, excitatory synaptic inputs; arrows, synaptic interactions among the subsystems; thick arrows, other sensory or descending inputs that control the breathing pattern. See text for details.
Physiological significance.
This PB subregion may play a key role in mediating the increase in breathing frequency induced by hypoxia and hypercapnia, suggested by studies in which lesions of the rat lateral PB nucleus, dorsal to the KF nucleus, prevented the decrease in Te due to those stimuli (Mizusawa et al. 1995; Song and Poon 2009a, 2009b). Possibly because of species differences, the functions mediated by the rat lateral PB nuclei may be located more medially in the dog.
The medial PB subregion may play a key role in mediating the rapid ventilatory response to exercise as well as the sustained response. At the very onset of exercise, pulmonary ventilation rapidly increases, with a time constant of a few seconds (phase I) before feedback mechanisms become effective, suggesting the involvement of a central command or feedforward neural mechanism (Forster et al. 2012). Central command is viewed as a parallel, simultaneous excitation of neuronal circuits controlling the locomotor and cardiorespiratory systems (Eldridge et al. 1985). Interestingly, in the cat the mesencephalic locomotive region (near the cuneiform nucleus; Garcia-Rill and Skinner 1987) is located ∼1–1.5 mm rostral and ∼2 mm dorsal from the PB tachypneic subregion. When the mesencephalic locomotive region is electrically stimulated in a decerebrate cat, the rate of locomotion increases as a function of stimulus intensity (Le Ray et al. 2011) analogous to the PB subregion increase in breathing frequency. Thus it is possible that PB subregion participates in the feedforward command. Since during steady-state exercise both breathing frequency and tidal volume significantly increase in proportion to the amount of CO2 excretion (e.g., Fig. 3 in Forster et al. 2012), the PB subregion may also participate in the feedback mechanism.
The location of the PB-KF complex is midway between the forebrain and medulla, where it receives numerous descending and ascending projections that mediate and process emotion and pain and associated breathing pattern responses (Jiang et al. 2004). It has been suggested that the PB nuclei may play an important role in integrating respiratory-related afferents with other afferents such as nociceptive, thermosensitive, somatic proprioceptive, and cardiovascular-related afferents (Jiang et al. 2004; Morrison et al. 2008; Potts et al. 2005; Song et al. 2006) and coordination cardiorespiratory function. The descending forebrain inputs and efferent connectivity with important sensory relay nuclei in brain stem and spinal cord support the important role of rostral pons in the gating of adaptive breathing during behavior, emotion, and associated homeostasis (Dutschmann and Dick 2012). Since the PB subregion in dogs strongly modulates breathing rate, it is likely to be involved with the integration of these various PB-KF inputs that control breathing patterns during various physiological/behavior conditions.
In conclusion, a subregion within the medial PB complex plays a key role in the control of Te and breathing rate. This subregion is sensitive to clinical concentrations of opioids, which produce bradypnea and even apnea at higher concentrations (Prkic et al. 2012). Since γ2-subunits of GABAA receptors are expressed within this region (Guthmann et al. 1998), enhancement of neuronal inhibition by benzodiazepines may also contribute to bradypnea. Within the PB-KF nuclei, a multitude of neurotransmitters/modulators and their associated receptors have been identified by in situ hybridization and immunocytochemistry. These receptors may serve as potential therapeutic drug targets to counteract respiratory depression produced by opioids and sedatives. They include glutamatergic ionotropic (Chamberlin and Saper 1995; Guthmann and Herbert 1999b) and metabotropic (Guthmann and Herbert 1999a) receptors, GABAA receptors (Guthmann et al. 1998), GABAB and glycine receptors (Herbert et al. 2000), α2-adrenoceptors (Herbert and Flugge 1995), cholinergic receptors (Mallios et al. 1995), serotonergic (5-HT) receptors (Dutschmann et al. 2009), and peptide receptors (Saleh and Cechetto 1996). Thus drugs that affect neuronal activity in this PB subregion can have a major impact on breathing rate.
An unexpected finding that emerged from characterizing the phase-timing effects mediated from the medial PB was that the I phase could be paced without altering the profile of the PNG and could be evoked during apnea. Once initiated by a delayed, short-duration pulse train applied to the PB subregion, a complete PNG ramp pattern emerges, no different from one occurring spontaneously. A highly plausible explanation of this phenomenon is that underlying the I-pattern generator must be functioning pacemaker neurons with regenerative properties. Thus it would appear that preBC pacemaker neurons are fully active during eupneic breathing in vivo.
GRANTS
This material is based upon work supported by Merit Review Award 5 I01 BX000721-07 from the Department of Veterans Affairs Biomedical Laboratory Research and Development Program (E. J. Zuperku, PI). This work was also supported by the Department of Anesthesiology, Medical College of Wisconsin and the Children's Hospital of Wisconsin.
DISCLOSURES
No conflicts of interest, financial or otherwise, are declared by the author(s).
AUTHOR CONTRIBUTIONS
E.J.Z. conceived and designed research; E.J.Z. performed experiments; E.J.Z. analyzed data; E.J.Z., A.G.S., F.A.H., and E.A.E.S. interpreted results of experiments; E.J.Z. prepared figures; E.J.Z. drafted manuscript; E.J.Z., A.G.S., F.A.H., and E.A.E.S. edited and revised manuscript; E.J.Z., A.G.S., F.A.H., and E.A.E.S. approved final version of manuscript.
ACKNOWLEDGMENTS
The authors thank Jack Tomlinson and John G. Krolikowski, Biological Laboratory Technicians, Zablocki VA Medical Center, for excellent technical assistance.
REFERENCES
- Bertrand F, Hugelin A. Respiratory synchronizing function of nucleus parabrachialis medialis: pneumotaxic mechanisms. J Neurophysiol 34: 189–207, 1971. [DOI] [PubMed] [Google Scholar]
- Butera RJ Jr, Rinzel J, Smith JC. Models of respiratory rhythm generation in the pre-Bötzinger complex. I. Bursting pacemaker neurons. J Neurophysiol 81: 382–397, 1999. [DOI] [PubMed] [Google Scholar]
- Chamberlin NL, Saper CB. Topographic organization of respiratory responses to glutamate microstimulation of the parabrachial nucleus in the rat. J Neurosci 14: 6500–6510, 1994. [DOI] [PMC free article] [PubMed] [Google Scholar]
- Chamberlin NL, Saper CB. Differential distribution of AMPA-selective glutamate receptor subunits in the parabrachial nucleus of the rat. Neuroscience 68: 435–443, 1995. [DOI] [PubMed] [Google Scholar]
- Cohen MI. Switching of the respiratory phases and evoked phrenic responses produced by rostral pontine electrical stimulation. J Physiol 217: 133–158, 1971. [DOI] [PMC free article] [PubMed] [Google Scholar]
- D'Angelo E. Verification of a model for the mechanisms controlling expiratory duration in rabbits under various conditions. Respir Physiol 59: 239–264, 1985. [DOI] [PubMed] [Google Scholar]
- Del Negro CA, Kam K, Hayes JA, Feldman JL. Asymmetric control of inspiratory and expiratory phases by excitability in the respiratory network of neonatal mice in vitro. J Physiol 587: 1217–1231, 2009. [DOI] [PMC free article] [PubMed] [Google Scholar]
- Dutschmann M, Dick TE. Pontine mechanisms of respiratory control. Compr Physiol 2: 2443–2469, 2012. [DOI] [PMC free article] [PubMed] [Google Scholar]
- Dutschmann M, Herbert H. The Kolliker-Fuse nucleus gates the postinspiratory phase of the respiratory cycle to control inspiratory off-switch and upper airway resistance in rat. Eur J Neurosci 24: 1071–1084, 2006. [DOI] [PubMed] [Google Scholar]
- Dutschmann M, Waki H, Manzke T, Simms AE, Pickering AE, Richter DW, Paton JF. The potency of different serotonergic agonists in counteracting opioid evoked cardiorespiratory disturbances. Philos Trans R Soc Lond B Biol Sci 364: 2611–2623, 2009. [DOI] [PMC free article] [PubMed] [Google Scholar]
- Eldridge FL, Millhorn DE, Kiley JP, Waldrop TG. Stimulation by central command of locomotion, respiration and circulation during exercise. Respir Physiol 59: 313–337, 1985. [DOI] [PubMed] [Google Scholar]
- Feldman JL, Del Negro CA. Looking for inspiration: new perspectives on respiratory rhythm. Nat Rev Neurosci 7: 232–242, 2006. [DOI] [PMC free article] [PubMed] [Google Scholar]
- Forster HV, Haouzi P, Dempsey JA. Control of breathing during exercise. Compr Physiol 2: 743–777, 2012. [DOI] [PubMed] [Google Scholar]
- Funk GD, Greer JJ. The rhythmic, transverse medullary slice preparation in respiratory neurobiology: contributions and caveats. Respir Physiol Neurobiol 186: 236–253, 2013. [DOI] [PubMed] [Google Scholar]
- Garcia-Rill E, Skinner RD. The mesencephalic locomotor region. I. Activation of a medullary projection site. Brain Res 411: 1–12, 1987. [DOI] [PubMed] [Google Scholar]
- Guthmann A, Fritschy JM, Ottersen OP, Torp R, Herbert H. GABA, GABA transporters, GABAA receptor subunits, and GAD mRNAs in the rat parabrachial and Kolliker-Fuse nuclei. J Comp Neurol 400: 229–243, 1998. [PubMed] [Google Scholar]
- Guthmann A, Herbert H. Distribution of metabotropic glutamate receptors in the parabrachial and Kolliker-Fuse nuclei of the rat. Neuroscience 89: 873–881, 1999a. [DOI] [PubMed] [Google Scholar]
- Guthmann A, Herbert H. Expression of N-methyl-d-aspartate receptor subunits in the rat parabrachial and Kolliker-Fuse nuclei and in selected pontomedullary brainstem nuclei. J Comp Neurol 415: 501–517, 1999b. [PubMed] [Google Scholar]
- Herbert H, Flugge G. Distribution of alpha2-adrenergic binding sites in the parabrachial complex of the rat. Anat Embryol (Berl) 192: 507–516, 1995. [DOI] [PubMed] [Google Scholar]
- Herbert H, Guthmann A, Zafra F, Ottersen OP. Glycine, glycine receptor subunit and glycine transporters in the rat parabrachial and Kolliker-Fuse nuclei. Anat Embryol (Berl) 201: 259–272, 2000. [DOI] [PubMed] [Google Scholar]
- Janczewski WA, Tashima A, Hsu P, Cui Y, Feldman JL. Role of inhibition in respiratory pattern generation. J Neurosci 33: 5454–5465, 2013. [DOI] [PMC free article] [PubMed] [Google Scholar]
- Jiang M, Alheid GF, Calandriello T, McCrimmon DR. Parabrachial-lateral pontine neurons link nociception and breathing. Respir Physiol Neurobiol 143: 215–233, 2004. [DOI] [PubMed] [Google Scholar]
- Jones SE, Dutschmann M. Testing the hypothesis of neurodegeneracy in respiratory network function with a priori transected arterially perfused brain stem preparation of rat. J Neurophysiol 115: 2593–2607, 2016. [DOI] [PMC free article] [PubMed] [Google Scholar]
- Krolo M, Stuth EA, Tonkovic-Capin M, Hopp FA, McCrimmon DR, Zuperku EJ. Relative magnitude of tonic and phasic synaptic excitation of medullary inspiratory neurons in dogs. Am J Physiol Regul Integr Comp Physiol 279: R639–R649, 2000. [DOI] [PubMed] [Google Scholar]
- Le Ray D, Juvin L, Ryczko D, Dubuc R. Chapter 4—supraspinal control of locomotion: the mesencephalic locomotor region. Prog Brain Res 188: 51–70, 2011. [DOI] [PubMed] [Google Scholar]
- Mallios VJ, Lydic R, Baghdoyan HA. Muscarinic receptor subtypes are differentially distributed across brain stem respiratory nuclei. Am J Physiol Lung Cell Mol Physiol 268: L941–L949, 1995. [DOI] [PubMed] [Google Scholar]
- Mizusawa A, Ogawa H, Kikuchi Y, Hida W, Shirato K. Role of the parabrachial nucleus in ventilatory response of awake rats. J Physiol 489: 877–884, 1995. [DOI] [PMC free article] [PubMed] [Google Scholar]
- Morrison SF, Nakamura K, Madden CJ, Morrison SF, Nakamura K, Madden CJ. Central control of thermogenesis in mammals. Exp Physiol 93: 773–797, 2008. [DOI] [PMC free article] [PubMed] [Google Scholar]
- Potts JT, Rybak IA, Paton JF. Respiratory rhythm entrainment by somatic afferent stimulation. J Neurosci 25: 1965–1978, 2005. [DOI] [PMC free article] [PubMed] [Google Scholar]
- Prkic I, Mustapic S, Radocaj T, Stucke AG, Stuth EA, Hopp FA, Dean C, Zuperku EJ. Pontine mu-opioid receptors mediate bradypnea caused by intravenous remifentanil infusions at clinically relevant concentrations in dogs. J Neurophysiol 108: 2430–2441, 2012. [DOI] [PMC free article] [PubMed] [Google Scholar]
- Rekling JC, Feldman JL. PreBötzinger complex and pacemaker neurons: hypothesized site and kernel for respiratory rhythm generation. Annu Rev Physiol 60: 385–404, 1998. [DOI] [PubMed] [Google Scholar]
- Saleh TM, Cechetto DF. Peptide changes in the parabrachial nucleus following cervical vagal stimulation. J Comp Neurol 366: 390–405, 1996. [DOI] [PubMed] [Google Scholar]
- Segers LS, Nuding SC, Vovk A, Pitts T, Baekey DM, O'Connor R, Morris KF, Lindsey BG, Shannon R, Bolser DC. Discharge identity of medullary inspiratory neurons is altered during repetitive fictive cough. Front Physiol 3: 223, 2012. [DOI] [PMC free article] [PubMed] [Google Scholar]
- Segers LS, Shannon R, Saporta S, Lindsey BG. Functional associations among simultaneously monitored lateral medullary respiratory neurons in the cat. I. Evidence for excitatory and inhibitory actions of inspiratory neurons. J Neurophysiol 57: 1078–1100, 1987. [DOI] [PubMed] [Google Scholar]
- Shannon R, Baekey DM, Morris KF, Li Z, Lindsey BG. Functional connectivity among ventrolateral medullary respiratory neurones and responses during fictive cough in the cat. J Physiol 525: 207–224, 2000. [DOI] [PMC free article] [PubMed] [Google Scholar]
- Siniaia MS, Young DL, Poon CS. Habituation and desensitization of the Hering-Breuer reflex in rat. J Physiol 523: 479–491, 2000. [DOI] [PMC free article] [PubMed] [Google Scholar]
- Smith JC, Abdala AP, Koizumi H, Rybak IA, Paton JF. Spatial and functional architecture of the mammalian brain stem respiratory network: a hierarchy of three oscillatory mechanisms. J Neurophysiol 98: 3370–3387, 2007. [DOI] [PMC free article] [PubMed] [Google Scholar]
- Song G, Poon CS. Lateral parabrachial nucleus mediates shortening of expiration and increase of inspiratory drive during hypercapnia. Respir Physiol Neurobiol 165: 9–12, 2009a. [DOI] [PMC free article] [PubMed] [Google Scholar]
- Song G, Poon CS. Lateral parabrachial nucleus mediates shortening of expiration during hypoxia. Respir Physiol Neurobiol 165: 1–8, 2009b. [DOI] [PMC free article] [PubMed] [Google Scholar]
- Song G, Yu Y, Poon CS. Cytoarchitecture of pneumotaxic integration of respiratory and nonrespiratory information in the rat. J Neurosci 26: 300–310, 2006. [DOI] [PMC free article] [PubMed] [Google Scholar]
- St-John WM, Paton JF. Defining eupnea. Respir Physiol Neurobiol 139: 97–103, 2003. [DOI] [PubMed] [Google Scholar]
- Tonkovic-Capin M, Krolo M, Stuth EA, Hopp FA, Zuperku EJ. Improved method of canine decerebration. J Appl Physiol 85: 747–750, 1998. [DOI] [PubMed] [Google Scholar]
- Younes M, Baker JP, Remmers JE. Temporal changes in effectiveness of an inspiratory inhibitory electrical pontine stimulus. J Appl Physiol 62: 1502–1512, 1987. [DOI] [PubMed] [Google Scholar]
- Zuperku E, Prkic I, Stucke A, Miller J, Hopp F, Stuth E. Neurons in the pontine medial parabrachial (PB) region play a key role in the control of breathing frequency (Abstract). FASEB J 29: 1032.7, 2015a. [Google Scholar]
- Zuperku EJ, Hopp FA. On the relation between expiratory duration and subsequent inspiratory duration. J Appl Physiol 58: 419–430, 1985. [DOI] [PubMed] [Google Scholar]
- Zuperku EJ, Hopp FA, Kampine JP. Central integration of pulmonary stretch receptor input in the control of expiration. J Appl Physiol Respir Environ Exercise Physiol 52: 1296–1315, 1982. [DOI] [PubMed] [Google Scholar]
- Zuperku EJ, Prkic I, Stucke AG, Miller JR, Hopp FA, Stuth EA. Automatic classification of canine PRG neuronal discharge patterns using K-means clustering. Respir Physiol Neurobiol 207: 28–39, 2015b. [DOI] [PMC free article] [PubMed] [Google Scholar]
- Zuperku EJ, Stucke AG, Hopp FA, Stuth EA. Characteristics of breathing rate control by neurons in the pontine medial parabrachial region (PBR) (Abstract). FASEB J 30: 988.986, 2016. [Google Scholar]


