

Abstract
Altered macroscopic anatomical characteristics of the cerebral cortex have been identified in individuals affected by various neurodevelopmental disorders. However, the cellular developmental mechanisms that give rise to these abnormalities are not understood. Previously, advances in image reconstruction of diffusion magnetic resonance imaging (MRI) have made possible high-resolution in utero measurements of water diffusion anisotropy in the fetal brain. Here, diffusion anisotropy within the developing fetal cerebral cortex is longitudinally characterized in the rhesus macaque, focusing on gestation day (G85) through G135 of the 165 d term. Additionally, for subsets of animals characterized at G90 and G135, immunohistochemical staining was performed, and 3D structure tensor analyses were used to identify the cellular processes that most closely parallel changes in water diffusion anisotropy with cerebral cortical maturation. Strong correlations were found between maturation of dendritic arbors on the cellular level and the loss of diffusion anisotropy with cortical development. In turn, diffusion anisotropy changes were strongly associated both regionally and temporally with cortical folding. Notably, the regional and temporal dependence of diffusion anisotropy and folding were distinct from the patterns observed for cerebral cortical surface area expansion. These findings strengthen the link proposed in previous studies between cellular-level changes in dendrite morphology and noninvasive diffusion MRI measurements of the developing cerebral cortex and support the possibility that, in gyroencephalic species, structural differentiation within the cortex is coupled to the formation of gyri and sulci.
SIGNIFICANCE STATEMENT Abnormal brain morphology has been found in populations with neurodevelopmental disorders. However, the mechanisms linking cellular level and macroscopic maturation are poorly understood, even in normal brains. This study contributes new understanding to this subject using serial in utero MRI measurements of rhesus macaque fetuses, from which macroscopic and cellular information can be derived. We found that morphological differentiation of dendrites was strongly associated both regionally and temporally with folding of the cerebral cortex. Interestingly, parallel associations were not observed with cortical surface area expansion. These findings support the possibility that perturbed morphological differentiation of cells within the cortex may underlie abnormal macroscopic characteristics of individuals affected by neurodevelopmental disorders.
Keywords: brain development, diffusion, fetal brain, gyrification, in utero, magnetic resonance imaging
Introduction
Reduced cortical surface area (Dubois et al., 2008; Engelhardt et al., 2015) and abnormal folding patterns (Van Essen et al., 2006; Nordahl et al., 2007; Dubois et al., 2008; Engelhardt et al., 2015) have been observed in individuals affected by various neurodevelopmental disorders. This raises the suggestion that, if the biophysical mechanisms driving macroscopic anatomical changes of the brain were understood, it would be possible to make inferences about the developmental trajectory, and hence etiology of the disease, from the brain's structure at maturity. Quantitative measurements of brain growth, as these size and shape properties emerge during development, would be of value to further understand the factors that control brain morphology.
Non-invasive magnetic resonance imaging (MRI) techniques can be used to characterize brain development in situ (i.e., without the need to section the brain) on both macroscopic and cellular-level scales (Thornton et al., 1997; Mori et al., 2001; McKinstry et al., 2002). Previously, it was shown that regional patterns in surface area expansion (Kroenke et al., 2007; Knutsen et al., 2013), folding (Smart and McSherry, 1986; van der Knaap et al., 1996; deIpolyi et al., 2005; Sawada et al., 2012; Knutsen et al., 2013), and water diffusion anisotropy (deIpolyi et al., 2005; Kroenke et al., 2007, 2009) can be found within the developing cerebral cortex. Within cerebral cortical gray matter, water diffusion anisotropy can be interpreted in terms of the orientation distribution of axonal, dendritic, and glial cell processes (Bock et al., 2010; Jespersen et al., 2012). Perturbed cellular morphological development has been identified through diffusion anisotropy measurements in animal studies (Bock et al., 2010; Dean et al., 2013; Leigland et al., 2013) and clinical populations (Dubois et al., 2008; Ball et al., 2013; Vinall et al., 2013) of individuals with neurological disorders that are characterized by macroscopically abnormal cerebral cortex at maturity. Similarities in regional patterns of microstructural and macroscopic characteristics of cerebral cortical development could provide evidence relating to the cellular mechanisms that influence cortical growth.
However, to date, our ability to use MRI in the study of cerebral cortical development has been limited by the fact that longitudinal diffusion MRI (dMRI), surface area, and shape analyses have not been performed on the same set of experimental subjects. A major obstacle to obtaining reliable in utero data is that the fetal brain, even in sedated animals, can move significantly during MRI data acquisition, due to a number of factors including maternal breathing, drifting of the fetal head, and residual movements of the fetus under sedation. Previous developments in retrospective motion correction in 3D MR image reconstruction procedures has made in utero anatomical and diffusion MR measurement of the fetal brain feasible (Studholme, 2011).
Herein, microstructural and macroscopic development is longitudinally characterized in the second half of gestation in time-mated rhesus macaques. With this experimental design, it is possible to validate interpretations of dMRI in terms of cellular-level morphology of neurons and glial cells using quantitative 3D fluorescent microscopy measurements of cell process orientation dispersion (Khan et al., 2015). Thus, it was reasoned that longitudinal MRI measurements would enable regional analyses to be performed and to potentially identify associations between cellular-level and overall brain growth.
Materials and Methods
Animal preparation.
All animal procedures were approved by the Oregon National Primate Research Center and were conducted in full accordance with Public Health Service Policy on Humane Care and Use of Laboratory Animals. To produce time-mated pregnant dams, cycling females were paired for 4 d with fertile males beginning on day 10 ± 2 of the menstrual cycle (first day of menses, day 1; gestation length was counted from the first day of pairing; first day, GD 0). Pregnancy was confirmed by blood progesterone concentrations of >1 ng/ml at 29 ± 2 and 42 ± 3 d after the menses before mating. Anesthesia was induced on pregnant females with 10 mg/kg of ketamine and was maintained with 1% isoflurane, following intubation, during MRI procedures.
In utero MRI acquisition and image reconstruction.
A total of 15 healthy pregnant monkeys underwent anatomical and/or diffusion MRI examinations at gestational ages ranging from 75 d to 137 d (Table 1) using a Siemens 3T Tim Trio system equipped with a 15 element human knee RF coil. A triplane localizer and HASTE [half-Fourier acquisition single-shot turbo spin-echo (TSE)]-acquired T2-weighted (T2W) images were used to determine fetal head position. Subsequently, a 2D TSE sequence was used to acquire T2W images with the following parameters: TR, 5000 ms; TE, 97 ms; generalized autocalibrating partially parallel acquisition (GRAPPA) factor, 2; turbo factor, 27. As described previously (Wang et al., 2015), multiple contiguous 2D image stacks with in-plane resolutions of 0.67 × 0.67 mm and thicknesses of 1 mm were acquired along the maternal axial, sagittal, and coronal axes to facilitate the reconstruction of a 3D volume with isotropic resolution. For monkeys 1–3, which were scanned at three gestation ages (Table 1), a diffusion-weighted, 2D spin-echo-based EPI sequence was used to acquire one image volume with b = 0 (the “b0” image) and 20 diffusion-weighted volumes with b = 500 s/mm2. Other acquisition parameters were TR, 5000 ms; TE, 93 ms; GRAPPA factor, 2; EPI factor, 78; echo spacing, 1.09 ms. As with the T2-weighted images, three sets of b0 and diffusion-weighted image (DWI) stacks were acquired along the maternal axial, sagittal, and coronal axes. For the diffusion-weighted data, the in-plane resolution was 1.13 × 1.13 mm, and the slice thickness was 3 mm. To compensate for the relatively poor through-plane resolution for the diffusion data, three sets of diffusion-weighted image stacks were acquired along each axis, offset from one another by 1 mm. The three orthogonal plane data acquisition strategy used here has been used in several human fetal MRI studies and was previously demonstrated to facilitate high-quality diffusion tensor reconstructions in our studies of sedated rhesus macaques (Fogtmann et al., 2014).
Table 1.
Fetal gestation age (days) at MRI scan
| Monkey | Fetal sex | Anatomical MR | Diffusion MR |
|---|---|---|---|
| 1 | M | 83, 111, 133 | 83, 111, 133 |
| 2 | M | 85, 111, 133 | 85, 111, 133 |
| 3 | F | 85, 111, 135 | 85, 111, 135 |
| 4 | M | 75, 90 | |
| 5 | F | 75, 90 | |
| 6 | M | 83, 137 | |
| 7 | F | 91, 132 | |
| 8 | F | 85, 126 | |
| 9 | F | 90, 132 | |
| 10 | M | 86, 135 | |
| 11 | F | 88, 137 | |
| 12 | M | 78, 133 | |
| 13 | F | 87 | |
| 14 | F | 87 | |
| 15 | F | 87, 110 |
Gestation age (days) of each fetus at anatomical and diffusion MR scans are listed in the third and fourth columns, respectively. Fetuses from monkeys 1–3 underwent both anatomical and diffusion MR examination. M, Male; F, female.
For T2-weighted image stacks, 3D slice position and orientation correction with respect to fetal brain anatomy was performed using the slice MRI motion estimation and reconstruction (SLIMMER) procedure (Kim et al., 2011). This incorporates the slice intersection motion correction algorithm and iterative bias field inconsistency correction to account for subtle changes in signal that occur when the fetal head moves in relation to the coils, and allows improved delineation of subtle tissue contrast. The final 3D volume was reconstructed using an iterative deconvolution of the slice profiles in the orthogonal slice planes (Fogtmann et al., 2014) with 0.5 mm isotropic resolution.
Reconstruction of diffusion tensor imaging (DTI) data was accomplished using the approach described in the study by Fogtmann et al. (2014) and summarized as follows: (1) a reconstruction-based slice alignment of the non-diffusion-weighted images (Rousseau et al., 2006) was performed, and iterative reconstruction was used to generate a high-resolution b0 volume (Fogtmann et al., 2012); (2) between-slice motion estimates of the diffusion-weighted images were obtained using a model-based framework where the agreement between all the acquired DWI slices and an iteratively updated field of diffusion tensors within the brain in a common 3D coordinate frame was maximized by refinement of the three translations and three rotations of each acquired DWI slice. These transformations were parameterized in terms of head positioning over time within a consistent 3D anatomical frame, and their refinement was performed using a time-hierarchical scheme that accounted for slice acquisition time. An initial coarse motion trajectory was estimated, allowing motion between whole slice stacks, which was then refined using increasingly finer motion models allowing slices to be positioned more independently, and which eventually estimated the positioning of the head for individual slices. This alignment step was interleaved with an iterative deconvolution-based estimation of the 3D DTI model in fixed anatomical coordinates using an imaging model of the slice profile and in-plane point spread function to create a single 3D DTI map with a spatial resolution sequentially refined down to 0.75 × 0.75 × 0.75 mm. Following high-resolution motion estimation and 3D DTI estimation at the highest resolution, fractional anisotropy (FA; Basser and Pierpaoli, 1996) was then calculated from the resulting diffusion tensor estimates.
Ex vivo MRI acquisition.
The G90 fetuses (from dams 4 and 5) and the G135 fetuses (from dams 1–3) were delivered via Cesarean section after the end-point MRI scan. Upon delivery, fetuses were euthanized with an overdose of pentobarbital, and the brains were perfusion fixed with 4% paraformaldehyde (PFA) and then immersed in 4% PFA for 24 h before being transferred to PBS. Immediately before imaging, the brains were transferred to Fluorinert Electronic Liquid FC-77 (3M) and returned to PBS following MRI procedures. A custom-built Helmholtz coil (5 cm diameter, 5 cm length) was used for radiofrequency transmission and reception. Experiments were performed on an 11.7 T small-animal MRI system interfaced with a 9 cm inner diameter magnetic field gradient coil (Bruker) following previously described procedures (Wang et al., 2015). Briefly, a multislice spin-echo pulse sequence (TR, 15 s; TE, 30 ms), incorporating a Stejskal–Tanner diffusion sensitization gradient pair was used to acquire diffusion MRI data at an isotropic resolution of 0.3 mm. A 25 direction, icosahedral sampling scheme (Batchelor et al., 2003) was used for all experiments with 3 b0 images and diffusion-weighted images with a b value of 2500 s/mm2. Standard procedures were followed to calculate eigenvalues (λ1, λ2, and λ3, listed from smallest to largest) and eigenvectors (V1, V2, and V3). DTI indices such as FA were calculated from the eigenvalues for each voxel. The signal intensity at a b value of 0 was similarly estimated for each voxel, and the result served as the postmortem T2-weighted image.
Immunohistochemistry.
Following ex vivo MRI, a G90 brain (from dam 5) and a G135 brain (from dam 3) were cryoprotected in 15% and then 30% (w/v) sucrose–PBS solution before being frozen sectioned along the axial plane at 80 μm using a Zeiss Microm sliding microtome. Immunohistochemistry (IHC) was performed on free-floating tissue sections. Tissue sections were washed in PBS–Triton X-100 (0.1%, v/v) solution and then blocked with 5% (v/v) goat serum before being incubated with one of the following primary antibodies at 4°C for 48 h: anti-neurofilament marker SMI312 (1:1000, BioLegend), monoclonal anti-MAP2 antibody (1:500, Sigma-Aldrich), or monoclonal anti-vimentin antibody (1:40, Sigma-Aldrich). After washing in PBS-Triton X-100 solution, the sections were then incubated with secondary antibody conjugated with Alexa Fluor 488 (1:500, Invitrogen) for 2 h at room temperature. The sections were counterstained with DAPI (Sigma-Aldrich) before being mounted on gelatin subbed slides and sealed with coverslips. A Leica SP5 ABOS confocal laser scan microscope was used to acquire image stacks of SMI312-, MAP2-, and vimentin-stained tissue sections. All images were collected using a 40× oil-immersion objective with an in-plane resolution of 0.76 μm and matching through-plane (z) resolution of 0.76 μm. For figure display, maximum projections of image stacks along the z depth were generated of all IHC staining.
Structure tensor analyses.
Previously described procedures (Khan et al., 2015) were followed for the analysis of 3D stacks of confocal images. This involved (1) z direction intensity correction, (2) anisotropic tissue shrinkage effect removal, and (3) depth-dependent anisotropy of the confocal microscope's point spread function compensation. Subsequently, a Gaussian kernel with an SD of 3 μm [the parameter σ in the study by Khan et al. (2015)] was used to calculate image spatial derivatives. Structure tensors were determined using an averaging neighborhood of 342 ×342 × 23 μm.
A previously noted difference exists in the order of eigenvalues of the structure tensor and the diffusion tensor (Khan et al., 2015; Schilling et al., 2016). For a diffusion tensor, the eigenvector corresponding to the largest eigenvalue is parallel to the primary structure orientation (i.e., parallel to the cylinder axes for a collection of parallel cylinders). In contrast, for a structure tensor, image intensity variation is minimal along the primary structure orientation, and therefore is parallel to the eigenvector associated with the smallest eigenvalue. To facilitate comparisons between structure and diffusion tensors, it is therefore useful to reorder the largest and smallest structure tensor eigenvalues. However, an additional consequence of this difference that has not been addressed in previous work is that structures associated with a prolate diffusion tensor, such as a collection of parallel cylinders, are characterized by an oblate structure tensor. Similarly, an oblate diffusion tensor observed within parallel plate structures would be characterized by a prolate structure tensor. It is possible to interconvert oblate and prolate tensors by changing the value of the second eigenvalue to exchange the magnitudes of the differences between it and the first and third eigenvalues. Thus, in this study, structure tensor fractional anisotropy is analyzed for eigenvalue-reordered structure tensors. The relationships between the measured structure tensor eigenvalues, τ1, τ2, and τ3, and reordered eigenvalues, τ̃1, τ̃2, and τ̃3, are τ̃1 = τ3, τ̃2 = τ1 + τ3 − τ2, and τ̃3 = τ1. Fractional anisotropy of the eigenvalue-reordered structure tensor, , is defined using the following standard formula (Basser and Pierpaoli, 1996):
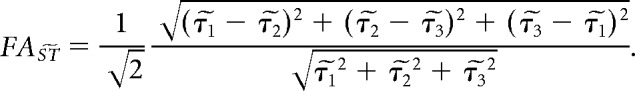 |
Cortical surface generation and analysis.
Manual segmentation was performed on the reconstructed T2-weighted images and on the b0 images separately using ITK-SNAP (http://www.itksnap.org; Yushkevich et al., 2006). Separate segmentations were needed due to subtle susceptibility-induced distortions that cause the diffusion tensor parameter maps to differ from the T2-weighted images. The resulting segmentations were used as input for the “SureFit” operation in the CARET software package (http://brainvis.wustl.edu; Van Essen et al., 2001).
Cortical FA values were mapped onto surfaces generated from b0 images using customized MATLAB (MathWorks) functions following three steps: (1) brain masks were used to exclude voxels outside the brain parenchyma (in our cases, CSF); (2) for each cortical surface node, its resident voxel was identified; and (3) FA values were averaged over a 3 × 3 × 3 voxel cube centered at each voxel intersecting fiducial surface, and the result was projected onto the fiducial surface. Cerebral cortical curvature and surface area were calculated from surfaces generated from T2-weighted images using standard CARET functions.
For fetuses of dams 1–3, each surface derived from T2-weighted and diffusion MRI data was parcelated into seven surface regions of interest (ROIs) for quantitative analyses of regional variation in isocortical FA, curvature, and surface area. These regions were defined as follows: the boundary between the frontal and primary motor regions was drawn along the arcuate sulcus; the central sulcus marked the boundary between primary motor and somatosensory cortices; the auditory region encompassed the entire superior-temporal gyrus; the boundary between auditory and nonprimary temporal regions followed the fundus of superior temporal sulcus (STS); the parietal ROI was dorsal to the auditory ROI and caudal to the postcentral gyrus; and the lunate sulcus and the ridge of inferior part of the occipital lobe served as the separation between the nonprimary temporal and occipital regions. To visually compare isocortical FA, curvature, and surface area regional patterns in a qualitative manner, the surfaces derived from T2-weighted images were registered to b0 surfaces using a landmark-based method (Van Essen, 2005). The landmarks used for registration in this study followed procedures described previously (Kroenke et al., 2007). For fetuses of dams 1–3, surface models derived from T2-weighted images for the first (G83–G85), second (G111), and third time points (G133–G135) were registered to each other to facilitate construction of average surfaces and to create overlays of averaged anatomical parameters. For convenience, we refer to these three time points as G85, G110, and G135 in the rest of the text.
Results
The trajectory of cerebral cortical expansion and folding from G75 to G137
Surface models were generated for the 15 fetal brains, imaged in vivo at a total of 31 time points. The surface area of the rhesus macaque isocortex for one hemisphere expands from 8.2 to 59 cm2 over the period from G75 to G137. With reference to a surface model generated from the INIA19 rhesus brain atlas (Rohlfing et al., 2012), this corresponds to an increase from 8.6 to 61.5% of the adult brain surface, respectively. Average brain surfaces for each of the ages examined over this period are shown in Figure 1a. No evidence of differences between left and right hemispheres was observed over this period, as assessed by t tests performed on brain surface areas measured on fetuses younger than G90, between G90 and G130, and older than G130, and on all ages pooled together. As shown in Figure 1b, isocortical surface area expansion does not increase linearly with gestation age between G75 and G137. Rather, it is characterized by a lower rate of growth at the earlier time points than at later ones. Fitting the data to a two-slope expression, as was performed previously to model expansion of the ferret isocortex (Knutsen et al., 2013), three parameters were determined to model surface area expansion: the initial expansion rate for rhesus macaque isocortex is 0.42 cm2/d (0.44% of the adult surface area per day), the age in which a transition occurs from low to high rate of expansion is G102, and the increased rate of surface area expansion after G102 is 1.2 cm2/d (1.3% of the adult surface area per day). The two-slope expression is overlaid on the data obtained from the cerebral cortex models of 31 scans in Figure 1b (dashed curve).
Figure 1.

Cerebral cortical development of rhesus macaque fetuses from G75 to G137. a, Cortical surfaces color coded with mean curvature, K, are shown for left hemispheres at G75, G85, G90, G110, G135, and at maturity. b, Cerebral cortical surface expands from 8.2 to 59 cm2 from G75 to G135. The expansion is characterized by a rate of 0.42 cm2/d from G75 to a transitional time point occurring at G102. Subsequent to G102, isocortical surface area expands at a faster rate of 1.2 cm2/d (dashed lines). c, Cerebral cortical folding, reflected in the curvature parameter K* increases from 1.23 at G75 to 5.77 at G137. Data from monkeys 1–3, which underwent longitudinal anatomical and diffusion MR scan at three time points, are represented by filled symbols, and all other fetuses are represented in open symbols.
Mean curvature, K, was also characterized over the period from G75 to G137 in the rhesus macaque and is color coded on average cerebral cortical surfaces for each time point in Figure 1a to indicate sulcal (negative K, blue) and gyral (positive K, orange) regions. Similar to ferrets (Smart and McSherry, 1986), cynomolgus macaques (Sawada et al., 2012), and humans (Chi et al., 1977; van der Knaap et al., 1996), a rostral/lateral to caudal/medial sequence of folding is observed in the rhesus macaque. The first sulci and gyri to appear are located on the lateral surface near the sylvian fissure (SF), and sulci at more rostral and caudal locations form subsequently. At G75, only a very shallow SF is evident (Fig. 1a). By G85, formation of the STS caudal to the SF has begun (Fig. 1a). The SF and STS deepen at G90, and by G110, the arcuate (AS), central (CS), intraparietal (IPS), and lunate sulci (LS) have become well defined (Fig. 1a). The principle sulcus (PS) and inferior occipital sulcus (IOS) are beginning to emerge at G110 as well (Fig. 1a). By G135, all the sulci present in the adult surface are identifiable and resemble the shapes they attain at maturity.
Nondimensionalized mean curvature, K*, is a quantitative measure of local surface shape that is independent of brain size (Knutsen et al., 2013). As a result, changes in K* reflect an aspect of cerebral cortical maturation that is independent of surface area expansion. As both gyri and sulci mature, the magnitude of K* increases; thus, the average mean curvature K*, expressed as the absolute value of K* weighted by the surface area of cortex attributed to a given node, was used to characterize the progression of cerebral cortical folding over a surface region (Knutsen et al., 2013). As shown in Figure 1c, over the period from G75 to G137, isocortical K* increases from 1.23 (23.7% of adult K*) to 5.77 (86.7% of adult K*). Notably, changes in curvature that reflect gyral folding are nearly complete by G135 (Fig. 1a). As with surface area, no evidence of differences in K* between left and right hemispheres was observed, as assessed by t tests performed on brain surface areas measured on fetuses younger than G90, between G90 and G130, and older than G130, and on all ages pooled together.
Region and development-dependent changes in FA identified in postmortem tissue are observable in utero
In utero diffusion MRI data were acquired for three fetuses. As shown in Figure 1, these brains exhibited typical surface area and curvature values for the G83 to G135 age range (Fig. 1b,c, filled symbols). Regional and temporal patterns of water diffusion FA, which have been detailed in diffusion MRI studies of postmortem baboon brain (Kroenke et al., 2007) and documented in human fetal and neonatal brain (deIpolyi et al., 2005; Huang et al., 2013; Yu et al., 2016), are observed here in utero using data acquisition and image reconstruction procedures appropriate for in utero studies. From G83 to G135, mean FA in the isocortex decreases (Fig. 2j). Over this period, three sources of regional variation in FA are apparent. First, a sharp transition between high and low FA at the boundary of isocortex and allocortex is evident, as illustrated in coronal slices of a G85 brain (Fig. 2a–c,f, red arrows). Second, most notably in G111 brains, an FA gradient is observed throughout the isocortex in which minimal FA is observed in the lateral cortex near the insula (the rostral bank of the superior temporal sulcus, the sylvian fissure, and precentral and postcentral gyri; Fig. 2g, orange), and FA increases steadily in rostral and caudal directions (transition to yellow color in prefrontal cortex, occipital cortex, and middle and inferior temporal gyrus; Fig. 2g). This FA gradient parallels maturational gradients previously identified in histological studies (Sidman and Rakic, 1982; McSherry and Smart, 1986). Last, primary cerebral cortical areas, such as primary visual cortex on the occipital operculum and primary motor cortex on the precentral gyrus, exhibit reduced FA relative to neighboring regions. In some instances, sharp transitions are observable, such as at the fundus of the superior temporal sulcus (Fig. 2d,e, yellow arrows), where primary auditory cortices are located rostrally and nonprimary cortical areas are located caudally.
Figure 2.

Cerebral cortical FA variation observed with longitudinal in utero diffusion MRI. a–e, Coronal slices of an FA map are shown for a G85 fetal brain (a–c) and axial slices for a G110 brain (d, e). Red arrowheads (a–c) mark a sharp transition between high and low FA at the boundary of isocortex and allocortex. In the G110 brain, FA is markedly higher in the caudal bank of the STS (d,e, yellow arrowheads). For G85 (f), G110 (g), and G135 (h), the six hemispheres were registered to a common left hemisphere, and the average isocortical FA is mapped onto each surface node. i, Predicted cortical FA, based on a previously published model of regionally dependent temporal changes with cortical maturation (Kroenke et al., 2009), is displayed for a G110 brain (for details, see Results). Mean isocortical FA for the three fetuses is shown in j, with each fetus represented by a different color and open and closed symbols representing right and left hemispheres, respectively.
An empirical model was proposed previously to represent the age and regional dependence of water diffusion anisotropy (Kroenke et al., 2009). For a given location in the cerebral cortex, the reduction in FA with development can be approximated as an exponential decay from a maximal value observed following the conclusion of neurogenesis and migration of pyramidal neurons to the cortical plate, to a minimal value observed at maturity. The initiation of the exponential decay in FA with age is determined by the geodesic distance along the cerebral cortex surface from the location to the TNG (transverse neurogenic gradient) origin and the primary/nonprimary cortical identity at the location. Cerebral cortical FA is thus determined by three variables, d*, which is the geodesic distance divided by the maximal geodesic distance on the cortical sheet from the neurogenic gradient origin, the categorical variable p, which reflects the primary/nonprimary identity of the cortical location (p = 1 for primary cortical areas and 0 otherwise), and the age a in days postconception (Kroenke et al., 2009), according to the following expression:
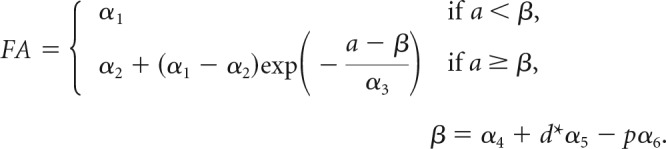 |
For each isocortical location, β is the age when its FA starts to decrease exponentially with a time constant α3 from its maximal value, α1, early in development to its minimal value at maturity, α2. The threshold age β is determined by (1) α4, the age at which cortical FA starts to decrease at the TNG source; (2) α5, the difference in developmental stage (in days) between cortices located closest and furthest from the source of the TNG (TNG magnitude); and (3) α6, the difference in developmental stage (in days) between primary and nonprimary cortices. It has also been shown (Leigland and Kroenke, 2011) that the rate of change in cerebral cortical FA for a given mammalian species scales with the rate of CNS development determined by the conversion to a common developmental event time scale (Workman et al., 2013; http://www.translatingtime.net). In this study, the parameters α3–α6 were translated from ferret to rhesus macaque using the regression model parameters of Workman et al. (2013) using the “Slope” and “Constant” parameters for both species in their Table 2. To determine the predicted FA values in Figure 2i, the parameters α1 and α2, reflecting the maximal and minimal FA values, were estimated to be 0.34 and 0.09, respectively, through least squares fitting of the data to the above equation. Figure 2i shows that the predicted cortical FA values for a G110 hemisphere closely resemble the observed pattern in Figure 2g.
In the analysis of regional variation in FA, a possibility that warrants consideration is whether regions of high curvature are associated with low FA through dispersion in the orientation distribution of surface normals within MRI voxels, rather than through an association between cellular morphological maturation and cerebral cortical folding. This possibility arises because, within the early developing cerebral cortex, the least restricted direction of diffusion is oriented parallel to apical dendrites and radial glial fibers, which is perpendicular to the pial surface. If the diffusion MRI voxel size, characterized by the cubic voxel side length a, is large relative to the radius of curvature of a gyral or sulcal fold, 1/|K|, then FA could appear low as a result of averaging regions of cortex with varying surface normal orientations. The magnitude of the surface curvature effect on cerebral cortical FA can be estimated by determining fractional anisotropy of the scatter matrix of surface normals (FAN). For an MRI voxel containing two nonexchanging compartments, consisting of an isotropic compartment and a compartment of cylindrically symmetric structures, with ν reflecting the volume fraction of the cylindrical compartment, an expression has been derived in which FADTI is found to be proportional to the product νFAN (Jespersen et al., 2012). An approximation for the “corrected” FADTI value, , which does not include the effects of surface curvature, is therefore = FADTI/FAN, in which ν is conservatively assumed here to take a value of unity. Figure 3a shows the FADTI/ ratio as a function of the product a|K|. For the diffusion MRI data in this study, a is 0.75 mm, so the magnitude of surface curvature must exceed 0.64 (the a|K| product must exceed 0.48) to have a 2% effect on the experimentally measured FADTI. As shown in Figure 3b, none of the surface nodes in the G85 average surface possess curvature exceeding 0.64 in magnitude, and only 2 and 4% of the G110 and G135 average surface nodes, respectively, have curvature exceeding this magnitude. As a result of the minor effect of curvature on FADTI in these data, the outcomes of statistical hypothesis testing presented in the following sections are identical if FADTI values are replaced with values. Therefore, variation in cerebral cortical FA is herein attributed to variation in neuropil complexity rather than macroscopic surface curvature.
Figure 3.
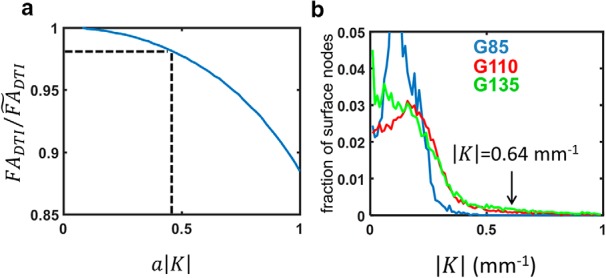
The effect of dispersion due to cortical surface curvature on diffusion anisotropy. a, The FADTI/ ratio is plotted as a function of the product a|K|. A 2% reduction of FADTI due to surface curvature arises for an a|K| product of 0.48 (dashed lines). For the diffusion MRI data in this study, a is 0.75 mm, so the magnitude of surface curvature must exceed 0.64 to have a 2% effect on FADTI. As shown in b, none of the surface nodes in the G85 average surface possess curvature exceeding 0.64 in magnitude (blue curve), and 2 and 4% of the G110 (green curve) and G135 (red curve) average surface nodes, respectively, have curvature of this magnitude.
Associations between reductions in FA and increases in orientation dispersion of dendrites, radial glial process, and axons
To identify cellular-level changes associated with reductions in water diffusion anisotropy in the developing cerebral cortex, immunohistochemical staining was used to label specific cell processes for subsequent quantitative 3D analyses of their morphology and to compare these results to FA. In the G90 cerebral cortex, vimentin-positive radial glial cells (RGCs), neuron dendrites labeled by MAP2, and SMI312-positive axon processes exhibit less uniform radial organization in isocortex within the sylvian fissure (Fig. 4a–c) than in occipital (d–f) cortex. As expected based on previous immunohistochemical studies of the fetal rhesus cortex (Cunningham et al., 2013), by G135, the three cellular constituents examined at G90 have all gained complexity across the cerebral cortex (Fig. 4g–l), and as a result, much of the radial orientation is lost within both the sylvian fissure and the occipital cortex. However, even at this later stage of development, a greater extent of radial orientation in cell processes is observed in occipital cortex than in sylvian fissure. For instance, this is apparent for vimentin-stained processes (Fig. 4g,j).
Figure 4.

Differentiation of cell processes in fetal cerebral cortex illustrated by immunohistochemical staining. a–l, Vimentin-, MAP2-, and SMI312-labeled cell structures are shown for SF and occipital cortex from G90 (a–f) and G135 (g–l) brains. All frames have been aligned such that the upper border is parallel to the pial surface and located at the approximate position of the border between the marginal zone and the cortical plate. Each image is a maximum projections of a confocal image stack of thickness ranging from 30 to 60 μm. Scale bar, 10 μm.
As shown previously, structural coherence over large ensembles of cell constituents can be quantified as a structure tensor, which is sensitive to the size scale of typical diffusion MRI (Budde and Frank, 2012; Budde et al., 2013; Khan et al., 2015). To quantify dispersion in axonal, dendritic, and radial glial cell process orientation distributions, 3D structure tensor calculations were performed (Khan et al., 2015). As shown in Figure 5c, the tendency for MAP2-stained dendrites to be aligned perpendicular to the pial surface results in significantly more variability in image intensity along the direction parallel to the pial surface (Fig. 5c, x and z directions) than perpendicular to it (y direction). As a result, the eigenvectors corresponding to the minor eigenvalues of structure tensors calculated for the Figure 5c image are oriented perpendicular to the pial surface. For purposes of comparing to diffusion tensor shapes and orientations, ellipsoids with radii proportional to eigenvalues of the eigenvalue-reordered 3D structure tensors are overlaid on a 3D surface rendering of MAP2-stained dendrites in Figure 5d.
Figure 5.

Correlation between structure tensor anisotropy of cell processes stained using immunohistochemical procedures and water diffusion anisotropy. a, b, Axial slices of FA parameter maps obtained from a postmortem G90 hemisphere (a) and a G135 hemisphere (b) are shown at the indicated locations (insets, dashed lines). Seven ROIs from the G90 cortex and three ROIs from the G135 cortex were selected (red boxes), and structure tensors of matching ROIs from confocal images were calculated. c, As illustrated with a MAP2 image obtained from the occipital lobe of a G90 hemisphere, cellular elements are aligned perpendicular to the pial surface, resulting in significantly higher variability in image intensity along the directions parallel to the pial surface (e.g., the x and z directions in c) than perpendicular to it (the y direction in c). d, Eigenvalue-reordered 3D structure tensors are overlaid (green ellipsoids) on a 3D surface rendering of MAP2-stained dendrites in (red structures). e–g, Structure tensor anisotropy () of all ROIs calculated from MAP2 (e), vimentin (f), and SMI312 (g) staining are plotted against their correspondence water diffusion anisotropy (FADTI). Data from the G90 brain are represented by filled symbols, while data from the G135 brain are represented by open symbols.
To examine the relationship between anisotropy in water diffusion and anisotropy of structure tensors of microscopy images, seven cerebral cortex locations of brains from a G90 fetus (Fig. 5a) and three locations at G135 (Fig. 5b) were characterized by both methods. For all three immunohistochemical markers, was measured. A statistically significant reduction in was observed for MAP2 (p = 0.04), but not for vimentin (p = 0.1) or SMI312 (p = 0.37) between G90 and G135. To assess the extent of correlation with water diffusion anisotropy, comparisons were made with diffusion tensor FA values (FADTI) derived from postmortem DTI performed on the tissue before tissue sectioning at regions that match the histological analyses (Fig. 5a,b). Statistically significant correlations were observed between the 10 and FADTI values measured from brains at both ages for all three cellular markers, though the correlation was more robust for MAP2 (r = 0.98, p < 0.0001) and vimentin (r = 0.89, p = 0.0006) than for SMI312 (r = 0.64, p = 0.05). Notably, fitting the MAP2 data shown in Figure 5e to a line yields a slope near unity (fitted slope, 0.98) and an intercept near zero (fitted intercept, 0.04), and this line simultaneously approximates the G135 and G90 data. In contrast, the observed relationships between FADTI and for both vimentin and SMI312 are more complex. Positive correlations are observed between water diffusion and structure tensor anisotropy for both of these markers at G90; however, in neither case do the data fit a line intersecting the origin. Instead, extrapolation of the G90 data for these markers indicates that at a value of zero, significant water diffusion anisotropy, characterized by a FADTI value in the range of 0.3–0.4, would be observed. Moreover, the extent of correlation between FADTI and is not consistent between G90 and G135 for these markers. Nevertheless, statistically significant positive correlations were found between FADTI and when the G90 and G135 data were pooled, indicating that axonal as well as radial glial cell process morphology is associated with water diffusion anisotropy in the developing cerebral cortex, albeit more weakly associated than for dendrites.
Region-dependent changes in surface expansion and folding
For the purpose of comparing regional patterns in FA changes with patterns of surface expansion and folding, the isocortex was subdivided into eight ROIs. The primary cortex was subdivided into occipital (Fig. 6a, inset, blue), auditory (cyan), somatosensory (maroon), and primary motor (red) areas, and the nonprimary cortex was parcelated into nonprimary temporal (magenta), parietal (green), insular (orange), and frontal (yellow) cortices. Of these eight ROIs, seven consist entirely of isocortex (allocortex contributes to part of the insular region). In a previous cross-sectional study of baboon cortical growth (Kroenke et al., 2007), it was found that the region rostral to the superior temporal gyrus and lunate sulcus comprised 37% of the isocortex at G90, but this increased to 44% at ages G125 and G146 (the gestational term for baboons is 185 d), indicating the rostral half of the cortex expands more rapidly than the caudal half between G90 and G125. In this study, the corresponding rostral half of the brain consists of prefrontal, motor, and somatosensory regions. These accounted for 42% of the isocortex at G85, and this increased to 45% at G110 and G135. Thus, on a coarse-grained scale, the regional pattern for cortical surface area expansion is similar between baboon and rhesus macaque.
Figure 6.

Cortical ROI-based analyses of cortical surface expansion, folding, and FA reduction from G85 to G135. a, Isocortices were parceled into seven regions (inset). In each plot, data points are color coded according to ROI shown in the inset in a. a, c, e, SA/SAadult (a), K*/Kadult* (c), and FA (e) averaged over six hemispheres are plotted against gestation age. b, d, f, ΔSA/SAadult (b), ΔK*/Kadult* (d), and ΔFA (f) averaged over six hemispheres are plotted for developmental time intervals G85 to G110 and G110 to G135. Error bars represent sample SDs in all six plots.
For this study, as a result of the longitudinal design, a more detailed examination of surface expansion is possible. For the seven isocortical regions defined in Figure 6a, surface area was determined for the six hemispheres that were analyzed at the three gestational ages of G85, G110, and G135. Additionally, surface areas of each region were determined from the INIA19 adult atlas data. The cerebral cortex surface area was expressed as a ratio of the surface area at maturity for each region, and these are plotted as a function of gestation age in Figure 6a. In Figure 6b, changes in the fraction of adult surface area (ΔSA/SAadult) between G85 and G110, as well as between G110 and G135, are plotted for each cortical ROI. Statistically significant differences in ΔSA/SAadult among regions were observed between G85 and G110 (ANOVA, p < 0.0001) and between G110 and G135 (ANOVA, p < 0.0001). However, as can be seen in Figure 6b, the rank order of expansion among regions differs between the two developmental intervals. For example, expansion of the nonprimary parietal region (green) is among the slowest between G85 and G110, but becomes the fastest between G110 and G135.
As observed for surface area, K* also exhibits regional variability with development. For each of the seven regions of isocortex, the average K* value for all surface nodes, K*, was divided by the corresponding value of K* at maturity (Kadult*), and these are plotted as a function of gestation age in Figure 6c. In Figure 6d, the change in average curvature for each region is plotted for the two developmental intervals. Statistically significant differences in ΔK*/Kadult* between isocortical regions were also observed both for the interval between G85 and G110 (ANOVA, p < 0.0001) and between G110 and G135 (ANOVA, p = 0.0002).
Associations between reductions in FA, cortical folding, and surface area expansion
Diffusion anisotropy was quantified in the cortical regions at each gestational age (Fig. 6e), and, as shown in Figure 6f, significant differences among the isocortical ROIs were observed in the reduction in FA between ages of G85 and G110 (ANOVA, p < 0.0001) and between G110 and G135 (ANOVA, p < 0.0001). Comparisons between changes in surface area (Fig. 6b), curvature (Fig. 6d), and FA (Fig. 6f) reveal similarities between the latter two measures that are not shared with surface area. Surface area expansion accelerates for all isocortical regions from the fist to the second gestation age intervals. In contrast, for both ΔK*/Kadult* and ΔFA, the rates of change decrease for the common set of regions that exhibit the largest changes from G85 to G110. The Figure 6 plots therefore suggest that correlations exist between FA and K* that are not shared with SA.
In Figure 7, correlations between the three metrics are examined directly. Despite that both FA and surface area exhibit regional variation in maturation throughout the cortex, temporal and regional patterns identified for these two aspects of cerebral cortical development were not found to be related to each other. As shown in Figure 7b, a statistically significant correlation was not observed between ΔFA and ΔSA/SAadult (r = 0.19, p = 0.52), nor were significant correlations observed when analyzed separately between ages G85 and G110 (r = −0.18, p = 0.71; Fig. 7b, filled symbols) or between ages G110 and G135 (r = −0.45, p = 0.32; Fig. 7b, open symbols). To characterize the pattern of ΔSA/SAadult ratios in more detail, the surface area associated with each surface node was determined at G85, G110, G135, and adulthood. Node-based ΔSA/SAadult ratios are overlaid on the average G110 surfaces in Figure 8. Over the period from G85 to G110, surface area expansion is highest in the insula, the ventral parts of motor and somatosensory regions, and throughout the auditory cortex, including the entire superior temporal gyrus (Fig. 8a). This pattern contrasts with the region of cortex undergoing the most dramatic FA changes over this period (Fig. 8b), which extends throughout the primary motor and somatosensory cortices and includes the dorsal part of the superior temporal gyrus, which subserves primary auditory functions, and the dorsal part of the occipital region (primary visual cortex; Fig. 8b). From G110 to G135, the most rapidly expanding regions include more dorsal aspects of the motor and somatosensory cortices as well as the temporal cortex (Fig. 8d). Again, this contrasts with the regions exhibiting the greatest changes in FA, which occur in the frontal and, more rostrally, in the temporal and occipital lobes (Fig. 8e).
Figure 7.

Cortical ROI-based analyses of associations between cortical surface expansion, folding, and FA reduction. As in Figure 6, data points are color coded according to ROI shown in the inset in a. a, c, e, For every hemisphere, mean FA, SA/SAadult, and K*/Kadult* for each of the seven cortical regions are plotted against each other. b, d, f, Changes in the isocortical parameters, ΔFA, ΔSA/SAadult, and ΔK*/Kadult* from G85 to G110 (open symbols) and from G110 to G135 (closed symbols) are plotted against each other.
Figure 8.
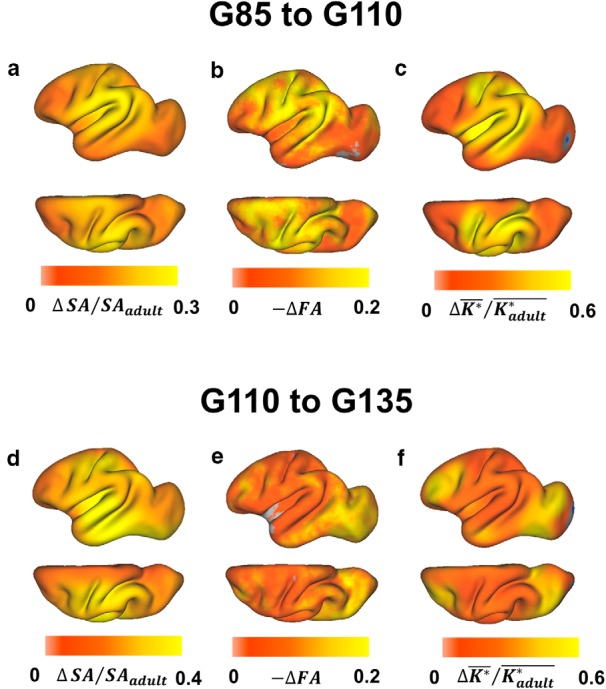
Comparison of regional patterns of cortical surface expansion, FA reduction, and gyrification. a–c, Node-based ΔSA/SAadult, reduction in FA (b; −ΔFA is the FA for the earlier time point minus FA for the later time point), and ΔK*/Kadult* (c) are overlaid on the average G110 cerebral cortex surface for the period ranging from G85 to G110. Analogous parameters for the and from G110 to G135 period are shown in d–f, respectively.
In contrast to surface area, the regional pattern of change in curvature does correlate with the regional pattern of change in cerebral cortical FA. As shown in Figure 7e, a linear relationship is observed between increasing ΔK*/Kadult* and decreasing FA across region and gestation age. The average ΔK*/Kadult* for each region is negatively correlated with the change in FA (r = −0.54, p = 0.047), and between G85 and G110 (Fig. 7f, filled symbols; r = −0.81, p = 0.027), but a statistically significant association is not observed between G110 and G135 (Fig. 7f, open symbols; r = −0.56, p = 0.19). Comparisons between folding and surface area expansion illustrate that changes in curvature are nearly complete by G135, but considerable surface area expansion potential still remains at this gestational stage (Fig. 1a). As a result, there are differences in SA/SAadult ratios among cortical regions at G135 (Figs. 6a, 7a,c); however, at this age, all regions approach curvature values of a mature brain, as evident from relatively uniformly high ΔK*/Kadult* ratios (Figs. 6c, 7c). Over the periods from G85 to G110 and G110 to G135, the average ΔK*/Kadult* for each region is not correlated with ΔSA/SAadult (both intervals pooled, r = 0.064, p = 0.83; G85 to G110, r = 0.40, p = 0.37, Fig. 7d, open symbols; G110 to G135, r = −0.36, p = 0.43, Fig. 7d, filled symbols), indicating the lack of a consistent relationship between these two aspects of cerebral cortical development over the G85 to G135 age range.
The regional changes in surface curvature have also been determined for individual nodes, and these can be compared to changes in FA and surface area in Figure 8, c and f. Over the period from G85 to G110, curvature changes are greater in primary motor and somatosensory as well as parietal cortex than in other regions of the cortex (Fig. 8c), and this pattern largely parallels changes observed in FA over the same gestation age range (Fig. 8b). Similarly, from G110 to G135, frontal areas and cortex containing the rostral border of the occipital lobe show high changes in curvature (Fig. 8f), as is also observed for FA changes, particularly within the occipital/temporal cortex (Fig. 8e).
Discussion
The rhesus macaque cerebral cortex undergoes dramatic growth during the second half of gestation. Here, in utero diffusion and T2-weighted MRI were used to monitor cellular morphological development as it relates to surface area expansion and the formation of gyral and sulcal folds. This data set provides new information that can be used in computational studies of cerebral cortical folding biomechanics and for interpreting the cellular bases of abnormal folding patterns observed in some neurodevelopmental disorders.
Neuropil constituents that influence water diffusion anisotropy in the developing cerebral cortex
In previous DTI studies of rat pups (Sizonenko et al., 2007), mouse embryos (Aggarwal et al., 2015), and human fetuses (Huang et al., 2013), high cortical FA was attributed to highly organized RGC processes. Other studies have associated the loss of cortical FA with differentiation of neuron dendrites and axons (McKinstry et al., 2002; deIpolyi et al., 2005; Jespersen et al., 2012). Herein, specific contributions of axonal, dendritic, and radial glial cell processes to water diffusion anisotropy were characterized with histological analyses of postmortem fetal brain tissue obtained immediately following MRI procedures. Among the cellular processes characterized, morphological maturation of dendrites most closely paralleled the pattern of water diffusion anisotropy within isocortex, though an association with radial glial cell morphology was also observed. These findings are consistent with dendritic differentiation contributing substantially to the observed reduction in cortical FA in the rhesus gestational development.
Myeloarchitecture is another cellular structural characteristic that exhibits regional variation throughout the cerebral cortex. Neuroimaging methods for mapping cortical myelin content in vivo have been developed previously (Glasser and Van Essen, 2011), and the observed regional pattern of myelin content relates to brain functional organization on the individual level (Glasser et al., 2016; Hunt et al., 2016). The anatomical processes associated with cortical FA changes characterized in this study precede myelogenesis, which occurs postnatally in humans (Deoni et al., 2015). However, in common with myelogenesis, maturation of the neuropil, as reflected in cortical FA changes, is integral to functional development of the cerebral cortex. Thus, measurements of cortical FA and myelin content changes will present the opportunity to perform an integrated characterization of cortical maturation in future studies.
Linkages between microstructural and macroscopic cerebral cortical development
The temporal and regional patterns of surface area expansion observed in this study build on observations from studies of other species. In a study performed on ferrets (Knutsen et al., 2013), a transition in the rate of cerebral cortical surface expansion was observed from 14.6 to 36.7 mm2/d per hemisphere, and this transition occurred at postnatal day 12.7 [corresponding to postconception day 53.7 (PC53.7)]. Similarly in baboon, surface area expansion changes from a rate of 26.8 to 106 mm2/d per hemisphere at approximately G120 (Kochunov et al., 2010). In this study, a threefold increase in the rhesus macaque isocortical surface area expansion rate, from 42 to 120 mm2/d per hemisphere, was found to occur at G102. According to the regression model of Workman et al. (2013), a G102 rhesus macaque corresponds to a PC51 ferret, which coincides closely with the observed age of PC53.7. In rhesus macaques, neurogenesis concludes between G80 and G100, depending upon the cortical location (Rakic, 2002), and ∼14 d are needed for pyramidal neurons to migration from germinal zones to the superficial cortex follows neurogenesis (Rakic, 1978). Therefore, the transition in surface area expansion rate reflects the transition between the neurogenesis phase and dendritic differentiation phase in these species.
Regional patterns in cerebral cortical FA identified in a number of gyrencephalic species (deIpolyi et al., 2005; Kroenke et al., 2007, 2009; Yu et al., 2016) were also apparent in the in utero data acquired from rhesus macaque fetuses in this study. It should be noted that for lissencephalic species such as mice and rats, a reduction in FA is observed at a developmental time period that corresponds to that for gyroencephalic species (Leigland and Kroenke, 2011). Thus, even though cortical folding does not occur in every species, for gyroencephalic species, it takes place during the stage associated with reductions in cortical FA. In contrast to prior work, in this study, longitudinal FA and surface area measurements enabled more definitive assessment of regional patterns in cerebral cortical development. Surprisingly, although regional variation in surface area expansion was observed in the rhesus macaque cerebral cortex, the regional pattern does not match the pattern of the loss of cerebral cortical diffusion anisotropy.
Longitudinal characterization of surface curvature also revealed regional patterns in cortical folding, which is consistent with, but more detailed than, previous studies of ferrets (Smart and McSherry, 1986) and cynomolgous macaques (Sawada et al., 2012). In contrast to surface area, statistically significant associations between change in curvature and FA were observed throughout the developmental intervals examined. Thus, regional variation in changes in FA and curvature were correlated with each other, but neither was correlated with surface area changes (Fig. 7b,d,f). In a study of preterm human newborns, deIpolyi et al. (2005) were unable to detect associations between gyrification and cortical FA. The study design adopted here, involving longitudinal investigation of entire cerebral cortices, has achieved the level of sensitivity needed to uncover this relationship. In addition to the observed regional patterns, the timing of curvature and FA changes closely match each other, but neither follows the pattern observed for surface area. By G135, surface curvature is 86.7% of the value at maturity, compared with only 61.5% in surface area. As shown in Figure 2h, FA has nearly uniformly approached the mature value throughout the cortex, which more closely resembles the timing of maturation for curvature than surface area. Such decoupling of the developmental timing between cortical surface or brain size and folding has also been noted in studies of cynomolgus monkeys (Sawada et al., 2012) and humans (Armstrong et al., 1995).
Implications for cerebral cortical folding
Two prevailing views on the biophysical mechanisms governing cerebral cortical folding differ with regard to the identity of the active tissue component. According to one theory, folding occurs through mechanical buckling, which is a consequence of differential growth between the developing cortex and subjacent tissue zones (Richman et al., 1975; Bayly et al., 2013; Budday et al., 2014; Tallinen et al., 2014). A contrasting theory is that axon tension, derived from cellular elements outside of the cortical sheet, causes the cortex to fold by pulling opposite banks of gyri together (Van Essen, 1997; Van Essen et al., 2006; Herculano-Houzel et al., 2010). Results of direct measurements of mechanical tension in slices of developing ferret brain tissue counter the axon tension hypothesis (Xu et al., 2010). Furthermore, a 3D experimental system consisting of layered gels that can be induced to swell at differential rates was developed previously for studying surface buckling (Tallinen et al., 2016). Under conditions that mimic developing brain tissue, this system can produce folding patterns that resemble various cortical morphological properties, including sulcal depth, spatial wavelength, and brain gyrfication index, by varying the difference in growth rates between cortical and subcortical zones (Tallinen et al., 2014). Thus, mounting experimental evidence supports expansion-driven buckling as an important contributor to cortical folding.
Mechanical simulations provide further insight into the biomechanics of differential cortical/subcortical expansion rates in cortical folding, and the findings of this study build on the biological foundation of this computational work. In computational simulations, cortical morphology is shown to depend on the rate of cerebral cortical “morphogenetic growth” (Budday et al., 2014), tangential expansion rate (Tallinen et al., 2014), or the ratio of cortical growth to the rate of subcortical stress-induced growth (Bayly et al., 2013). Although these parameters are explicitly input into simulations, the underlying biological processes they represent have not been defined. The findings of this study provide quantitative measurements of region-dependent surface area expansion rates. Furthermore, development of dendritic arbor complexity is associated with cortical folding during the initial phase of rapid surface area expansion. An interesting possibility raised by implication is that abnormal folding originates from deficits in dendritic differentiation, rather than perturbation of white matter maturation, as proposed previously (Van Essen et al., 2006).
Conclusion
Concerted changes in cellular morphology, water diffusion anisotropy, and curvature take place in the rhesus macaque fetal cerebral cortex. Relationships between these anatomical characteristics with respect to gestation age and cortical region suggest that gyral and sulcal folding occurs in association with the development of dendritic, and to a lesser extent axonal and glial cell process arbors, which can be monitored noninvasively with diffusion MRI. In contrast, the timing and regional pattern of surface area expansion differ from folding, cerebral cortical water diffusion anisotropy, and, hence, cellular morphological development. Therefore, expansion of the cerebral cortical surface area can occur independently of shape changes and changes in the orientation distribution of cell processes. These findings are consistent with the possibility that abnormal folding patterns associated with functional deficits in mature individuals are derived from perturbed cellular morphogenesis early in development.
Footnotes
This work was supported by NIH Grant AA021981 (C.D.K.), a grant from the Bill and Melinda Gates Foundation (C.D.K., A.E.F.), and NIH Grant OD011092. Access to Leica confocal microscopy was made available through National Center for Research Resources Grant RR024585. The content is solely the responsibility of the authors and does not necessarily represent the official views of the National Center for Research Resources or the National Institutes of Health. We thank C. F. Westin for discussions related to structure tensor calculations.
The authors declare no competing financial interests.
References
- Aggarwal M, Gobius I, Richards LJ, Mori S (2015) Diffusion MR microscopy of cortical development in the mouse embryo. Cereb Cortex 25:1970–1980. [DOI] [PMC free article] [PubMed] [Google Scholar]
- Armstrong E, Schleicher A, Omran H, Curtis M, Zilles K (1995) The ontogeny of human gyrification. Cereb Cortex 5:56–63. 10.1093/cercor/5.1.56 [DOI] [PubMed] [Google Scholar]
- Ball G, Srinivasan L, Aljabar P, Counsell SJ, Durighel G, Hajnal JV, Rutherford MA, Edwards AD (2013) Development of cortical microstructure in the preterm human brain. Proc Natl Acad Sci U S A 110:9541–9546. 10.1073/pnas.1301652110 [DOI] [PMC free article] [PubMed] [Google Scholar]
- Basser PJ, Pierpaoli C (1996) Microstructural and physiological features of tissues elucidated by quantitative-diffusion-tensor MRI. J Mag Reson 111:209–219. 10.1006/jmrb.1996.0086 [DOI] [PubMed] [Google Scholar]
- Batchelor PG, Atkinson D, Hill DL, Calamante F, Connelly A (2003) Anisotropic noise propagation in diffusion tensor MRI sampling schemes. Magn Reson Med 49:1143–1151. 10.1002/mrm.10491 [DOI] [PubMed] [Google Scholar]
- Bayly PV, Okamoto RJ, Xu G, Shi Y, Taber LA (2013) A cortical folding model incorporating stress-dependent growth explains gyral wavelengths and stress patterns in the developing brain. Phys Biol 10:016005. 10.1088/1478-3975/10/1/016005 [DOI] [PMC free article] [PubMed] [Google Scholar]
- Bock AS, Olavarria JF, Leigland LA, Taber EN, Jespersen SN, Kroenke CD (2010) Diffusion tensor imaging detects early cerebral cortex abnormalities in neuronal architecture induced by bilateral neonatal enucleation: an experimental model in the ferret. Front Syst Neurosci 4:149. [DOI] [PMC free article] [PubMed] [Google Scholar]
- Budday S, Raybaud C, Kuhl E (2014) A mechanical model predicts morphological abnormalities in the developing human brain. Sci Rep 4:5644. [DOI] [PMC free article] [PubMed] [Google Scholar]
- Budde MD, Frank JA (2012) Examining brain microstructure using structure tensor analysis of histological sections. Neuroimge 63:1–10. 10.1016/j.neuroimage.2012.06.042 [DOI] [PubMed] [Google Scholar]
- Budde MD, Shah A, McCrea M, Cullinan WE, Pintar FA, Stemper BD (2013) Primary blast traumatic brain injury in the rat: relating diffusion tensor imaging and behavior. Front Neurol 4:154. [DOI] [PMC free article] [PubMed] [Google Scholar]
- Chi JG, Dooling EC, Gilles FH (1977) Gyral development of the human brain. Ann Neurol 1:86–93. 10.1002/ana.410010109 [DOI] [PubMed] [Google Scholar]
- Cunningham CL, Martínez-Cerdeño V, Noctor SC (2013) Diversity of neural precursor cell types in the prenatal macaque cerebral cortex exists largely within the astroglial cell lineage. PLoS One 8:e63848. 10.1371/journal.pone.0063848 [DOI] [PMC free article] [PubMed] [Google Scholar]
- Dean JM, McClendon E, Hansen K, Azimi-Zonooz A, Chen K, Riddle A, Gong X, Sharifnia E, Hagen M, Ahmad T, Leigland LA, Hohimer AR, Kroenke CD, Back SA (2013) Prenatal cerebral ischemia disrupts MRI-defined cortical microstructure through disturbances in neuronal arborization. Sci Transl Med 5:168ra167 10.1126/scitranslmed.3004669 [DOI] [PMC free article] [PubMed] [Google Scholar]
- deIpolyi AR, Mukherjee P, Gill K, Henry RG, Partridge SC, Veeraraghavan S, Jin H, Lu Y, Miller SP, Ferriero DM, Vigneron DB, Barkovich AJ (2005) Comparing microstructural and macrostructural development of the cerebral cortex in premature newborns: diffusion tensor imaging versus cortical gyration. Neuroimage 27:579–586. 10.1016/j.neuroimage.2005.04.027 [DOI] [PubMed] [Google Scholar]
- Deoni SC, Dean DC 3rd, Remer J, Dirks H, O'Muircheartaigh J (2015) Cortical maturation and myelination in healthy toddlers and young children. Neuroimage 115:147–161. 10.1016/j.neuroimage.2015.04.058 [DOI] [PMC free article] [PubMed] [Google Scholar]
- Dubois J, Benders M, Borradori-Tolsa C, Cachia A, Lazeyras F, Ha-Vinh Leuchter R, Sizonenko SV, Warfield SK, Mangin JF, Hüppi PS (2008) Primary cortical folding in the human newborn: an early marker of later functional development. Brain 131:2028–2041. 10.1093/brain/awn137 [DOI] [PMC free article] [PubMed] [Google Scholar]
- Engelhardt E, Inder TE, Alexopoulos D, Dierker DL, Hill J, Van Essen D, Neil JJ (2015) Regional impairments of cortical folding in premature infants. Ann Neurol 77:154–162. 10.1002/ana.24313 [DOI] [PMC free article] [PubMed] [Google Scholar]
- Fogtmann M, Seshamani S, Kim K, Chapman T, Studholme C (2012) A unified approach for motion estimation and super resolution reconstruction from structural magnetic resonance imaging on moving subjects. Paper presented at MICCAI Workshop on Perinatal and Paediatric Imaging, Nice, France, October. [Google Scholar]
- Fogtmann M, Seshamani S, Kroenke C, Xi C, Chapman T, Wilm J, Rousseau F, Studholme C (2014) A unified approach to diffusion direction sensitive slice registration and 3-D DTI reconstruction from moving fetal brain anatomy. IEEE Trans Med Imaging 33:272–289. 10.1109/TMI.2013.2284014 [DOI] [PMC free article] [PubMed] [Google Scholar]
- Glasser MF, Van Essen DC (2011) Mapping human cortical areas in vivo based on myelin content as revealed by T1- and T2-weighted MRI. J Neurosci 31:11597–11616. 10.1523/JNEUROSCI.2180-11.2011 [DOI] [PMC free article] [PubMed] [Google Scholar]
- Glasser MF, Coalson TS, Robinson EC, Hacker CD, Harwell J, Yacoub E, Ugurbil K, Andersson J, Beckmann CF, Jenkinson M, Smith SM, Van Essen DC (2016) A multi-modal parcellation of human cerebral cortex. Nature 536:171–178. 10.1038/nature18933 [DOI] [PMC free article] [PubMed] [Google Scholar]
- Herculano-Houzel S, Mota B, Wong P, Kaas JH (2010) Connectivity-driven white matter scaling and folding in primate cerebral cortex. Proc Natl Acad Sci U S A 107:19008–19013. 10.1073/pnas.1012590107 [DOI] [PMC free article] [PubMed] [Google Scholar]
- Huang H, Jeon T, Sedmak G, Pletikos M, Vasung L, Xu X, Yarowsky P, Richards LJ, Kostovic I, Sestan N, Mori S (2013) Coupling diffusion imaging with histological and gene expression analysis to examine the dynamics of cortical areas across the fetal period of human brain development. Cereb Cortex 23:2620–2631. 10.1093/cercor/bhs241 [DOI] [PMC free article] [PubMed] [Google Scholar]
- Hunt BA, Tewarie PK, Mougin OE, Geades N, Jones DK, Singh KD, Morris PG, Gowland PA, Brookes MJ (2016) Relationships between cortical myeloarchitecture and electrophysiological networks. Proc Natl Acad Sci U S A 113:13510–13515. 10.1073/pnas.1608587113 [DOI] [PMC free article] [PubMed] [Google Scholar]
- Jespersen SN, Leigland LA, Cornea A, Kroenke CD (2012) Determination of axonal and dendritic orientation distributions within the developing cerebral cortex by diffusion tensor imaging. IEEE Trans Med Imaging 31:16–32. 10.1109/TMI.2011.2162099 [DOI] [PMC free article] [PubMed] [Google Scholar]
- Khan AR, Cornea A, Leigland LA, Kohama SG, Jespersen SN, Kroenke CD (2015) 3D structure tensor analysis of light microscopy data for validating diffusion MRI. Neuroimage 111:192–203. 10.1016/j.neuroimage.2015.01.061 [DOI] [PMC free article] [PubMed] [Google Scholar]
- Kim K, Habas PA, Rajagopalan V, Scott JA, Corbett-Detig JM, Rousseau F, Barkovich AJ, Glenn OA, Studholme C (2011) Bias field inconsistency correction of motion-scattered multislice MRI for improved 3D image reconstruction. IEEE Trans Med Imaging 30:1704–1712. 10.1109/TMI.2011.2143724 [DOI] [PMC free article] [PubMed] [Google Scholar]
- Knutsen AK, Kroenke CD, Chang YV, Taber LA, Bayly PV (2013) Spatial and temporal variations of cortical growth during gyrogenesis in the developing ferret brain. Cereb Cortex 23:488–498. 10.1093/cercor/bhs042 [DOI] [PMC free article] [PubMed] [Google Scholar]
- Kochunov P, Castro C, Davis D, Dudley D, Brewer J, Zhang Y, Kroenke CD, Purdy D, Fox PT, Simerly C, Schatten G (2010) Mapping primary gyrogenesis during fetal development in primate brains: high-resolution in utero structural MRI of fetal brain development in pregnant baboons. Front Neurosci 4:20. [DOI] [PMC free article] [PubMed] [Google Scholar]
- Kroenke CD, Van Essen DC, Inder TE, Rees S, Bretthorst GL, Neil JJ (2007) Microstructural changes of the baboon cerebral cortex during gestational development reflected in magnetic resonance imaging diffusion anisotropy. J Neurosci 27:12506–12515. 10.1523/JNEUROSCI.3063-07.2007 [DOI] [PMC free article] [PubMed] [Google Scholar]
- Kroenke CD, Taber EN, Leigland LA, Knutsen AK, Bayly PV (2009) Regional patterns of cerebral cortical differentiation determined by diffusion tensor MRI. Cereb Cortex 19:2916–2929. 10.1093/cercor/bhp061 [DOI] [PMC free article] [PubMed] [Google Scholar]
- Leigland LA, Kroenke CD (2011) A comparative analysis of cellular morphological differentiation within the cerebral cortex using diffusion tensor imaging. In: Animal models of behavioral analysis (Raber J, ed), pp 329–351. New York: Humana Press. [Google Scholar]
- Leigland LA, Budde MD, Cornea A, Kroenke CD (2013) Diffusion MRI of the developing cerebral cortical gray matter can be used to detect abnormalities in tissue microstructure associated with fetal ethanol exposure. Neuroimage 83:1081–1087. 10.1016/j.neuroimage.2013.07.068 [DOI] [PMC free article] [PubMed] [Google Scholar]
- McKinstry RC, Mathur A, Miller JH, Ozcan A, Snyder AZ, Schefft GL, Almli CR, Shiran SI, Conturo TE, Neil JJ (2002) Radial organization of developing preterm human cerebral cortex revealed by non-invasive water diffusion anisotropy MRI. Cereb Cortex 12:1237–1243. 10.1093/cercor/12.12.1237 [DOI] [PubMed] [Google Scholar]
- McSherry GM, Smart IH (1986) Cell production gradients in the developing ferret isocortex. J Anat 144:1–14. [PMC free article] [PubMed] [Google Scholar]
- Mori S, Itoh R, Zhang J, Kaufmann WE, van Zijl PC, Solaiyappan M, Yarowsky P (2001) Diffusion tensor imaging of the developing mouse brain. Magn Reson Med 46:18–23. 10.1002/mrm.1155 [DOI] [PubMed] [Google Scholar]
- Nordahl CW, Dierker D, Mostafavi I, Schumann CM, Rivera SM, Amaral DG, Van Essen DC (2007) Cortical folding abnormalities in autism revealed by surface-based morphometry. J Neurosci 27:11725–11735. 10.1523/JNEUROSCI.0777-07.2007 [DOI] [PMC free article] [PubMed] [Google Scholar]
- Rakic P. (1978) Neuronal migration and contact guidance in the primate telencephalon. Postgrad Med J 54:S25–S40. [PubMed] [Google Scholar]
- Rakic P. (2002) Neurogenesis in the adult primate neocortex: an evaluation of the evidence. Nat Rev Neurosci 3:65–71. [DOI] [PubMed] [Google Scholar]
- Richman DP, Stewart RM, Hutchinson JW, Caviness VS Jr (1975) Mechanical model of brain convolutional development. Science 189:18–21. 10.1126/science.1135626 [DOI] [PubMed] [Google Scholar]
- Rohlfing T, Kroenke CD, Sullivan EV, Dubach MF, Bowden DM, Grant KA, Pfefferbaum A (2012) The INIA19 template and NeuroMaps atlas for primate brain image parcellation and spatial normalization. Front Neuroinform 6:27. [DOI] [PMC free article] [PubMed] [Google Scholar]
- Rousseau F, Glenn OA, Iordanova B, Rodriguez-Carranza C, Vigneron DB, Barkovich JA, Studholme C (2006) Registration-based approach for reconstruction of high-resolution in utero fetal MR brain images. Acad Radiol 13:1072–1081. 10.1016/j.acra.2006.05.003 [DOI] [PubMed] [Google Scholar]
- Sawada K, Fukunishi K, Kashima M, Saito S, Sakata-Haga H, Aoki I, Fukui Y (2012) Fetal gyrification in cynomolgus monkeys: a concept of developmental stages of gyrification. Anat Rec (Hoboken) 295:1065–1074. 10.1002/ar.22478 [DOI] [PubMed] [Google Scholar]
- Schilling K, Janve V, Gao Y, Stepniewska I, Landman BA, Anderson AW (2016) Comparison of 3D orientation distribution functions measured with confocal microscopy and diffusion MRI. Neuroimage 129:185–197. 10.1016/j.neuroimage.2016.01.022 [DOI] [PMC free article] [PubMed] [Google Scholar]
- Sidman RL, Rakic P (1982) Development of the human central nervous system. In: Histology and histopathology of the nervous system. (Haymaker W, Adams R, eds), pp 3–145. Springfield, IL: Charles C. Thomas. [Google Scholar]
- Sizonenko SV, Camm EJ, Garbow JR, Maier SE, Inder TE, Williams CE, Neil JJ, Huppi PS (2007) Developmental changes and injury induced disruption of the radial organization of the cortex in the immature rat brain revealed by in vivo diffusion tensor MRI. Cereb Cortex 17:2609–2617. 10.1093/cercor/bhl168 [DOI] [PMC free article] [PubMed] [Google Scholar]
- Smart IH, McSherry GM (1986) Gyrus formation in the cerebral cortex in the ferret. I. Description of the external changes. J Anat 146:141–152. [PMC free article] [PubMed] [Google Scholar]
- Studholme C. (2011) Mapping fetal brain development in utero using MRI: the big bang of brain mapping. Annu Rev Biomed Eng 13:345–368. 10.1146/annurev-bioeng-071910-124654 [DOI] [PMC free article] [PubMed] [Google Scholar]
- Tallinen T, Chung JY, Biggins JS, Mahadevan L (2014) Gyrification from constrained cortical expansion. Proc Natl Acad Sci U S A 111:12667–12672. 10.1073/pnas.1406015111 [DOI] [PMC free article] [PubMed] [Google Scholar]
- Tallinen T, Chung JY, Rousseau F, Girard N, Lefevre J, Mahadevan L (2016) On the growth and form of cortical convolutions. Nat Phys 12:588–593. 10.1038/nphys3632 [DOI] [Google Scholar]
- Thornton JS, Ordidge RJ, Penrice J, Cady EB, Amess PN, Punwani S, Clemence M, Wyatt JS (1997) Anisotropic water diffusion in white and gray matter of the neonatal piglet brain before and after transient hypoxia-ischaemia. Magn Reson Imaging 15:433–440. 10.1016/S0730-725X(96)00378-5 [DOI] [PubMed] [Google Scholar]
- van der Knaap MS, van Wezel-Meijler G, Barth PG, Barkhof F, Adèr HJ, Valk J (1996) Normal gyration and sulcation in preterm and term neonates: appearance on MR images. Radiology 200:389–396. 10.1148/radiology.200.2.8685331 [DOI] [PubMed] [Google Scholar]
- Van Essen DC. (1997) A tension-based theory of morphogenesis and compact wiring in the central nervous system. Nature 385:313–318. 10.1038/385313a0 [DOI] [PubMed] [Google Scholar]
- Van Essen DC. (2005) A population-average, landmark- and surface-based (PALS) atlas of human cerebral cortex. Neuroimage 28:635–662. 10.1016/j.neuroimage.2005.06.058 [DOI] [PubMed] [Google Scholar]
- Van Essen DC, Drury HA, Dickson J, Harwell J, Hanlon D, Anderson CH (2001) An integrated software suite for surface-based analyses of cerebral cortex. J Am Med Inform Assoc 8:443–459. 10.1136/jamia.2001.0080443 [DOI] [PMC free article] [PubMed] [Google Scholar]
- Van Essen DC, Dierker D, Snyder AZ, Raichle ME, Reiss AL, Korenberg J (2006) Symmetry of cortical folding abnormalities in Williams syndrome revealed by surface-based analyses. J Neurosci 26:5470–5483. 10.1523/JNEUROSCI.4154-05.2006 [DOI] [PMC free article] [PubMed] [Google Scholar]
- Vinall J, Grunau RE, Brant R, Chau V, Poskitt KJ, Synne AR, Miller SP (2013) Slower postnatal growth is associated with delayed cerebral cortical maturation in preterm newborns. Sci Transl Med 5:168ra8 10.1126/scitranslmed.3004666 [DOI] [PubMed] [Google Scholar]
- Wang X, Pettersson DR, Studholme C, Kroenke CD (2015) Characterization of laminar zones in the mid-gestation primate brain with magnetic resonance imaging and histological methods. Front Neuroanat 9:147. [DOI] [PMC free article] [PubMed] [Google Scholar]
- Workman AD, Charvet CJ, Clancy B, Darlington RB, Finlay BL (2013) Modeling transformations of neurodevelopmental sequences across mammalian species. J Neurosci 33:7368–7383. 10.1523/JNEUROSCI.5746-12.2013 [DOI] [PMC free article] [PubMed] [Google Scholar]
- Xu G, Knutsen AK, Dikranian K, Kroenke CD, Bayly PV, Taber LA (2010) Axons pull on the brain, but tension does not drive cortical folding. J Biomech Eng 132:071013. 10.1115/1.4001683 [DOI] [PMC free article] [PubMed] [Google Scholar]
- Yu Q, Ouyang A, Chalak L, Jeon T, Chia J, Mishra V, Sivarajan M, Jackson G, Rollins N, Liu S, Huang H (2016) Structural development of human fetal and preterm brain cortical plate based on population-averaged templates. Cereb Cortex 26:4381–4391. [DOI] [PMC free article] [PubMed] [Google Scholar]
- Yushkevich PA, Piven J, Hazlett HC, Smith RG, Ho S, Gee JC, Gerig G (2006) User-guided 3D active contour segmentation of anatomical structures: Significantly improved efficiency and reliability. Neuroimage 31:1116–1128. 10.1016/j.neuroimage.2006.01.015 [DOI] [PubMed] [Google Scholar]