

Abstract
Orbitofrontal cortex (OFC), medial frontal cortex (MFC), and amygdala mediate stimulus–reward learning, but the mechanisms through which they interact are unclear. Here, we investigated how neurons in macaque OFC and MFC signaled rewards and the stimuli that predicted them during learning with and without amygdala input. Macaques performed a task that required them to evaluate two stimuli and then choose one to receive the reward associated with that option. Four main findings emerged. First, amygdala lesions slowed the acquisition and use of stimulus–reward associations. Further analyses indicated that this impairment was due, at least in part, to ineffective use of negative feedback to guide subsequent decisions. Second, the activity of neurons in OFC and MFC rapidly evolved to encode the amount of reward associated with each stimulus. Third, amygdalectomy reduced encoding of stimulus–reward associations during the evaluation of different stimuli. Reward encoding of anticipated and received reward after choices were made was not altered. Fourth, amygdala lesions led to an increase in the proportion of neurons in MFC, but not OFC, that encoded the instrumental response that monkeys made on each trial. These correlated changes in behavior and neural activity after amygdala lesions strongly suggest that the amygdala contributes to the ability to learn stimulus–reward associations rapidly by shaping encoding within OFC and MFC.
SIGNIFICANCE STATEMENT Altered functional interactions among orbital frontal cortex (OFC), medial frontal cortex (MFC), and amygdala are thought to underlie several psychiatric conditions, many related to reward learning. Here, we investigated the causal contribution of the amygdala to the development of neuronal activity in macaque OFC and MFC related to rewards and the stimuli that predict them during learning. Without amygdala inputs, neurons in both OFC and MFC showed decreased encoding of stimulus–reward associations. MFC also showed increased encoding of the instrumental responses that monkeys made on each trial. Behaviorally, changes in neural activity were accompanied by slower stimulus–reward learning. The findings suggest that interactions among amygdala, OFC, and MFC contribute to learning about stimuli that predict rewards.
Keywords: amygdala, learning, macaque, prefrontal, reward
Introduction
The orbitofrontal cortex (OFC) and medial frontal cortex (MFC) both play critical roles in reward-guided learning and choice behavior (Kable and Glimcher, 2009; Rushworth et al., 2011; Rudebeck and Murray, 2014). In macaques, lesions of either structure affect the ability to acquire and change stimulus–reward or action–reward associations (Hadland et al., 2003; Izquierdo et al., 2004; Kennerley et al., 2006; Rudebeck et al., 2008; Rhodes and Murray, 2013; Rudebeck et al., 2013b). Single neurons in both areas signal stimulus–reward associations during reward-guided behavior (Thorpe et al., 1983; Matsumoto et al., 2003). These signals develop rapidly during learning and track changes in reward contingency (Schoenbaum et al., 1998; Morrison and Salzman, 2009; Kennerley et al., 2011; Morrison et al., 2011), although the source of these signals remains unclear. Understanding OFC and MFC function at the systems level is important because dysfunction in the circuits connecting these two parts of prefrontal cortex with other parts of the brain is thought to contribute to numerous psychiatric disorders (Davidson, 2002; Clark et al., 2009; Price and Drevets, 2010).
One of the possible sources of reward-related information in frontal cortex that could be used to guide learning is the amygdala, which is reciprocally interconnected with both OFC and MFC (Carmichael and Price, 1995; Ghashghaei et al., 2007). Consistent with this idea, amygdala neurons, like neurons in the OFC and MFC, signal the contingency between stimuli and rewards (Paton et al., 2006). Furthermore, lesions of the amygdala or disconnection of the amygdala from the prefrontal cortex is associated with impairments in responding adaptively to altered stimulus–reward associations (Málková et al., 1997; Baxter et al., 2000). However, these data do not reveal the precise information that the amygdala contributes to OFC and MFC during learning.
To address this uncertainty and to better define the causal contributions of the amygdala to the development of neural activity related to stimulus–reward associations, we used a combined lesion and recording approach. Specifically, we recorded single neurons in the OFC and MFC of macaques performing a stimulus–reward learning task both before and after excitotoxic lesions of the amygdala. Previously, we reported on the effect of amygdala lesions on OFC and MFC encoding of well learned (familiar) stimulus–reward associations from the same three animals (Rudebeck et al., 2013a). This within-subjects design, which was used to control for individual differences, meant that we could also compare OFC and MFC encoding of reward associated with novel versus familiar stimuli.
Materials and Methods
Subjects
Three experimentally naive adult male rhesus macaques (Macaca mulatta), Monkeys H, N, and V, served as subjects. They were 8.5, 8.0, and 8.4 kg, and 7.0, 7.1, and 8.0 years old, respectively, at the beginning of training. Animals were pair housed when possible, kept on a 12 h light/dark cycle, tested during the light part of the day, and had access to food 24 h a day. Throughout training and testing, each monkey's access to water was controlled for 6 d per week. All procedures were reviewed and approved by the National Institute of Mental Health (NIMH) Animal Care and Use Committee.
Apparatus and materials
Monkeys were trained to perform a two-choice visually guided task for water rewards. Visual stimuli were presented on a 19-inch monitor screen located 56 cm in front of the monkey's head. During training and testing, monkeys sat in a primate chair with their heads restrained. Directly in front of the chair, 3 buttons were spaced horizontally 7 cm apart, center to center. The buttons were 25 × 12.5 × 12.5 mm machined aluminum blocks with embedded infrared sensors (EE-SB5VC; Omron) under each block. An optical-quality clear acrylic lens protected each sensor. Hand or finger contact on the lens was sufficient for activation of the button; no pressure or electrical contact was required. All trial events and timing were controlled using the open source program NIMH Cortex (ftp://helix.nih.gov/lsn/cortex/). Eye position and pupil size were monitored and acquired at 60 frames/s with a camera-based infrared oculometer (PC-60; Arrington Research). Fluid reward was provided by a high-precision liquid dispenser (Mitz, 2005). Stimuli were 48 × 48 pixel color bitmap images composed of combinations of a single letter and a single number.
Behavioral procedures
The task used for this experiment was designed specifically, based on prior work (Izquierdo and Murray, 2007), so that monkeys would be able to perform it adequately after lesions of the amygdala. This aspect of the experimental design and results is critical to interpreting any changes in neural data. If subjects had been unable to perform the task after the lesions, then any changes in neural activity observed postoperatively would have been uninterpretable.
The monkeys were trained to initiate a trial by contacting and holding the central button (Fig. 1A). Contact with the central button led to the presentation of a red fixation spot, 0.1° in diameter, at the center of the video monitor. To initiate the fixation period and continue with the trial, the monkeys had to orient their gaze within a ±1.5° square window centered on the fixation spot while keeping their hand on the central button. Once fixation was initiated, monkeys had to maintain fixation within a 3° window until the onset of the go signal.
Figure 1.

Two-choice reward-guided task and bilateral excitotoxic amygdala lesions. A, Monkeys initiated trials by pressing and holding a central button and fixating a central fixation spot for a variable interval. Two visually distinct stimuli were then sequentially presented and, after a brief delay, monkeys chose between the two stimuli by selecting the button nearest the chosen stimulus. The amount of reward associated with the chosen stimulus (0.0, 0.2, or 0.4 ml) was then dispensed after a 0.5 s delay. B, Yellow dashed lines show boundary of the amygdala (top row) in Monkeys N, V, and H. T2-weighted MRI scans taken after bilateral injections of excitotoxin into the amygdala for each monkey (middle row). Yellow arrows mark the boundaries of white hypersignal that reflects edema after injections. Photomicrographs of Nissl-stained coronal sections taken at corresponding levels (∼17 mm anterior to the interaural plane) showing cell loss in the amygdala bilaterally (bottom row).
After a variable delay (500, 1000, or 1500 ms), a first stimulus (S1) was presented 3.5° to either the right or left of the fixation spot with the location following a random order. This stimulus was randomly selected from a pool of three stimuli that were novel at the start of each session. After the presentation of S1, a second stimulus (S2) was randomly selected from the remaining stimuli in the three-stimulus pool. As a result, we never presented the same stimulus as both S1 and S2. The onset of S2 occurred 1000 ms after the onset of S1 and it always appeared equidistant from the fixation spot on the opposite side as S1. After a delay of 500–1500 ms, selected randomly in steps of 500 ms, the fixation spot brightened. This event served as a “go” cue, which signaled the monkey to make an instrumental response: a reaching movement to either the left or right button. The location of the button, to the left or right of the central button, matched the location of one of the two stimuli, to the left or right of screen center. Contact with either the right or left button led to disappearance of the nonchosen stimulus and, after 500 ms, delivery of the reward quantity associated with the chosen stimulus. Through trial and error, monkeys learned which novel stimulus was associated with 0, 2, or 4 drops of water, 0.1 ml each.
An intertrial interval (ITI) of 2.0 s followed a successfully completed trial. In the rare instances of a failure before a choice due to a break in fixation, release of the central button before the go signal, or taking too long to release the central button after the go signal, the trial was immediately terminated. After these aborted trials, all stimuli were removed from the monitor and a 4.0 s ITI began. Choosing the stimulus associated with no reward did not lead to a penalty delay period, but did result in a correction trial (i.e., a repeat of the previous trial). Only completed trials in which the monkey chose one of the two buttons were included in the analyses.
Monkeys completed at least 60 trials per learning session. One or two learning sessions were conducted on each day, depending on the performance of the monkey or stability of neural recordings. As mentioned below, we limited our analysis to the first of these sessions. This was done to control for different numbers of sessions between animals. In addition, by taking the first session in each day, we could more closely equalize motivation levels across subjects, ensuring that no factors other than the lesion could affect behavioral performance.
Surgical procedures
The full details of all surgical procedures have been described previously (Rudebeck et al., 2013a). In brief, each monkey was implanted with a titanium head restraint device and then, in a separate surgery, a plastic recording chamber (27 × 36 mm) was placed over the exposed dura mater of the left frontal lobe. The head restraint device and chambers were fixed to the cranium with titanium screws plus a small amount of dental acrylic.
Bilateral excitotoxic lesions of the amygdala were made over two separate operations at the conclusion of preoperative behavioral testing and recording. For each monkey, MRI was used to determine the stereotaxic coordinates for injections of excitotoxins. Monkeys received 18–24 injections of the excitotoxin ibotenic acid (Monkeys H and V) or a mixture of ibotenic acid and NMDA (Monkey N) into each amygdala. At each site, spaced ∼2 mm apart in each plane, we injected 0.6–1.0 μl of ibotenic acid (10 μg/μl; Sigma-Aldrich) or of ibotenic acid (10 μg/μl; Sigma-Aldrich)/NMDA (10 μg/μl; Sigma-Aldrich) at a rate of 0.2 μl/min. Monkey H received injections into the right amygdala in the first operation and Monkeys N and V received injections into the left amygdala first. During the second surgery, conducted at least 2 weeks after the first, each animal received injections into the amygdala in the intact hemisphere. The intended lesion comprised the entire amygdala, including the basolateral group of nuclei and the central, medial, and cortical nuclei.
Neural recordings
Potentials from single neurons were isolated with tungsten microelectrodes (0.5–1.5 MΩ at 1 kHz; FHC or Alpha Omega) advanced by an 8-channel micromanipulator (NAN Instruments) attached to the recording chamber. Spikes from putative single neurons were isolated online using a Plexon Multichannel Acquisition Processor and later verified with Plexon Off Line Sorter on the basis of principal-component analysis, visually differentiated waveforms, and interspike intervals.
OFC recordings were made on the ventral surface of the frontal lobe between the lateral and medial orbital sulci, approximately corresponding to Walker's (1940) areas 11 and 13. All OFC recordings were between 27 and 38 mm anterior to the interaural plane. Neurons in MFC were primarily recorded in the dorsal bank of the cingulate sulcus (areas 9 and 24), although some sites were in the ventral part of the fundus of the cingulate sulcus. MFC neurons were recorded between the anterior tip of the cingulate sulcus (∼+38 mm) and +24 mm. Both before and after lesions of the amygdala, recordings were made in overlapping regions in each of the three monkeys (Fig. 2).
Figure 2.

Recording locations. A, Coronal T1-weighted MRI of electrode recording locations (left) and photomicrographs of Nissl-stained sections with corresponding marking lesions (right) at two different anterior–posterior levels (+36 and +28 mm anterior to the interaural plane) within OFC of Monkey V. Yellow arrows denote the location of marking lesions. B, Recording locations in OFC and MFC plotted on ventral (OFC) and dorsal (MFC) views of the frontal lobe from a standard macaque brain. Larger symbols represent increasing numbers of neurons recorded at that location. Darker colors (OFC: blue; MFC: red) represent preoperative recording locations, whereas lighter colors (OFC: cyan; MFC: orange) represent postoperative recording locations.
Neurons were initially isolated before monkeys were engaged in any task. However, before neural activity was recorded in the stimulus–reward learning task with novel images, monkeys performed a task with well learned (familiar) stimulus–reward associations (Rudebeck et al., 2013a). In some cases, neurons were isolated during the familiar task and these neurons were then recorded in the learning version of the task. Other than the quality of isolation, there were no selection criteria for neurons.
Imaging and histological reconstruction of recording sites and lesions
The extent and location of the amygdala lesions was assessed using T2-weighted MRI scans acquired within 1 week of each surgery (Fig. 1B, middle row). Lesion volume was then confirmed from histology (Fig. 1B, bottom row). The locations and extents of the lesions were largely as intended. There was nearly complete cell loss in all nuclei in the amygdaloid complex (mean total damage = 95.5%). A small amount of inadvertent damage was evident in the entorhinal and perirhinal cortex. In addition, portions of the ventral claustrum and anterior hippocampus sustained slight cell loss. Importantly, with the possible exception of the entorhinal cortex, this unintended damage was slight (e.g., extending <2 mm in anteroposterior extent) and asymmetric between the hemispheres. Finally, one monkey (Monkey N) sustained an infarction in the dorsal caudate at the level of the amygdala bilaterally. Overall, damage in all three monkeys consistently centered on the amygdala bilaterally.
Recording sites were verified by T1-weighted MRI imaging of electrodes after recording sessions and by placing electrolytic marking lesions (15 μA direct current for 25 s, electrode positive) at selected locations in OFC after recordings had been completed. The location of marking lesions in OFC was used to aid localization of MFC recordings (Fig. 2A). At the conclusion of the study, monkeys were deeply anesthetized and transcardially perfused with saline (0.9%) followed by formalin. The brains were removed, sectioned in the coronal plane, stained with thionin, and mounted onto glass slides for visual inspection. Marking lesions were clearly visible in both posterior and anterior parts of OFC, confirming the boundaries of our recording zone in OFC (Fig. 2A,B).
Data analysis
Behavioral data.
To control for differences in day-to-day testing and motivation levels, only the behavioral data from the first learning session from each recording day were analyzed. This gave us 23 learning sessions for each monkey before lesions of the amygdala, which we compared with 23 sessions collected directly after lesions of the amygdala. Then, to ensure a consistent number of trials in each day's data, we analyzed the first 40 trials from each session. This number was selected because monkeys' choice performance had become asymptotic by this point and allowed us to include the greatest amount of learning data. For data analysis, correct trials were defined as those with choice of the high reward option (i.e., choice of stimulus associated with either 0.2 or 0.4 ml of fluid). Error trials were defined as those with choice of the low reward option. Choice response latency was defined as the interval from the onset of the “go” signal until release of the central button.
To quantify the effect of the amygdala lesion on learning, we analyzed the monkeys' behavioral choice data by comparing the number of correct trials across the 40-trial session using a five-trial sliding window stepped in one-trial increments. At each time point, we conducted an ANOVA with factors of surgery (two levels, fixed effect), monkey (three levels, fixed effect), and session (fixed effect). The same factors were used to assess the effect of reward on choice response latencies, but instead of a sliding window design, we analyzed responses across four 10-trial blocks.
We fit a reinforcement learning model to monkey's choices to estimate the trial-by-trial values of the three novel stimuli as monkeys learned. The model was fit separately to the choice behavior from each session producing estimates of stimulus value for each stimulus on each trial, as well as the learning rate and the inverse temperature for each session. The model updates the value, v, of a chosen option, i, based on reward feedback, r in trial t as follows:
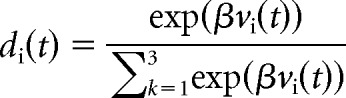
Therefore, the updated value of an option is given by its old value, vi(t − 1) plus a change based on the reward prediction error, r(t) − vi(t − 1), multiplied by the learning rate parameter, α. At the beginning of each session, the value, v, of all three novel stimuli is set to zero. The free parameters (the learning rate parameter, α, and the inverse temperature, β, which estimates how consistently animals choose the highest valued option), were fit by maximizing the likelihood of the choice behavior of the monkeys, given the model parameters. Specifically, we calculated the choice probability di(t) using the following formula:
 |
and then calculated the log-likelihood as follows:
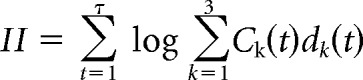 |
Where ck(t) = 1 when the subject chooses option k in trial t and ck(t) = 0 for all unchosen options, meaning that the model maximizes the choice probability, dk(t), of the actual choices the monkeys made. Parameters were maximized using standard techniques (Jang et al., 2015). To avoid local minima, learning rate parameters were drawn from a normal distribution with a mean of 0.5 and a SD of 3. The inverse temperature parameter was drawn from a normal distribution with a mean of 1 and an SD of 5. Model fits were repeated 1000 times and no constraints were placed on the estimated parameters. The maximum log-likelihood across the 1000 fits was used as the model's estimate.
Finally, we conducted a trial-by-trial analysis of monkey's choices using similar methods to those detailed in Rudebeck and Murray (2008). We determined the influence of positive (correct + 1) and negative feedback (error + 1) on subsequent performance using an ANOVA with effects of surgery (two levels, fixed effect), feedback (two levels, fixed effect), and monkey (three levels, random effect).
Neural data.
Neural data were analyzed using methods described by Rudebeck et al. (2013a). Unless otherwise stated, effects were consistent across subjects. To identify task-related neurons, all trials on which monkeys chose one of the two stimuli were analyzed (i.e., all trials on which monkeys did not break fixation or release the central button early and arrived on one of the two choice buttons within the permitted time). Within those trials, two separate periods were analyzed: a stimulus period 0–2 s after the onset of S1 and a reward period −1 s to +1 s from the onset of reward delivery.
A sliding ANOVA model was fitted to the firing rates of each neuron (200 ms bins starting at 0 ms, advanced in 10 ms increments) in each of these two periods. These parameters for the sliding window analysis were selected based on previous work in the field. Changing the size of the bins by ±50 ms did not alter the results. For the stimulus period, the model included factors of S1 reward value, S2 reward value, instrumental response (two levels), and all first-order interactions. S1 and S2 value were the trial-by-trial stimulus values obtained from the reinforcement learning model detailed above, modeled as continuous variables. For the reward period, the model included factors of chosen reward value (expected period, continuous variable) or reward amount (received period, three levels) and instrumental response (three levels). Chosen reward value was obtained on a trial-by-trial basis using the reinforcement learning model and was modeled as a continuous variable. Main factors and first-order interactions were included in both models.
For the analysis of the stimulus and reward periods, neurons were classified as encoding a factor or interaction if three consecutive bins of the sliding window analysis had p-values <0.001. These criteria were chosen based on analyses of a 1000 ms reference period, which occurred before the onset of S1 using the same sliding window ANOVA analysis conducted on the stimulus and reward periods. The criteria of p < 0.001 and three consecutive bins at this p-value produced a mean of <3% positive results for main factors on the reference period activity, which we take to be type I errors. We also assessed these criteria on the stimulus period using a permutation test (1000 repetitions) on 100 randomly selected neurons. This additional analysis revealed that the threshold of 3 consecutive bins at p < 0.001 produced type 1 errors at an average rate of <3%. Differences in the proportion of neurons in OFC and MFC classified as encoding a factor were subsequently assessed using χ2 tests or logistic regression.
Results
Amygdala lesion effects on stimulus–reward learning
We trained three monkeys to perform a stimulus–reward learning task for fluid rewards (Fig. 1A). On each trial, two visual stimuli, associated with different amounts of fluid reward, were presented sequentially. Stimuli were selected randomly from a pool of three stimuli that were novel at the start of each session. Each stimulus was assigned a 0.4, 0.2, or 0 ml fluid outcome for the duration of the session. Through trial-and-error, monkeys learned which stimuli were associated with 0.4, 0.2, or 0 ml of fluid. Monkeys were tested both before and after bilateral excitotoxic lesions of the amygdala (Fig. 1B).
Before excitotoxic lesions of the amygdala, all three monkeys rapidly learned the amount of reward associated with each stimulus; within ∼10 trials, the monkeys were choosing the stimulus associated with the highest amount of reward on ∼75% of trials (Fig. 3A). Postoperatively, although monkeys were able to acquire the stimulus–reward associations, they did so at a slower rate (sliding window analysis, ANOVA, false discovery rate corrected; Fig. 3A).
Figure 3.

The effect of excitotoxic amygdala lesions on stimulus–reward learning. A, Mean (±SEM) proportion of correct choices during the first 40 trials for subjects before (white) and after (gray) bilateral excitotoxic lesions of the amygdala. Data are smoothed using a five-trial filter. Open circles denote trials in which preoperative and postoperative scores differ based on ANOVA, p < 0.05, false discovery rate corrected. B, Mean (±SEM) proportion correct on trials immediately after either a correctly performed trial (correct + 1) or an error (error + 1) before (white bars) and after (gray bars) lesions of the amygdala. Connected symbols denote scores of individual subjects. C, Mean proportion correct on trials immediately after either a correctly performed trial (C + 1) or an error (E + 1) across four 10-trial blocks before (unfilled symbols) and after (filled symbols) lesions of the amygdala. *p < 0.05.
We next explored whether the amygdala lesions affected monkeys' choice response times: the time to make a choice in response to the go signal. Faster responses times were associated with choosing options associated with greater amounts of reward (effect of choice, F(2,4) = 20.54, p < 0.05), but amygdala lesions had no effect on this measure (effect of surgery or surgery by choice interaction, in all instances, F < 1.6, p > 0.1).
Next, we investigated whether the slower learning after lesions of the amygdala was caused by differences in the way the monkeys used positive and negative feedback to guide their choices (Rudebeck and Murray, 2008). For this first analysis, we define an error as choice of the lower rewarded option (either choice of 0 ml or choice of 0.2 ml when 0.2 is paired with 0.4 ml). Both preoperatively and postoperatively, monkeys were highly likely to choose the correct stimulus in a trial that followed selection of the high reward option (correct + 1). In contrast, after an error, monkeys were likely to make a subsequent error (error + 1, effect of feedback, F(1,2) = 97.81, p = 0.01; Fig. 3B). This pattern of behavior was altered by amygdala lesions (feedback by surgery interaction, F(1,2) = 23.07, p < 0.05). Although amygdala lesions did not influence the way that monkeys used positive feedback to guide choices (correct + 1, effect of surgery, F(1,2) = 12.059, p > 0.05), they produced a decrease in sensitivity to errors (error + 1, effect of surgery, F(1,2) = 185.03, p = 0.005).
We then looked at how different types of errors, rewarded (i.e., monkeys chose 0.2 ml over 0.4 ml) and unrewarded errors influenced subsequent choices. Whereas lesions of the amygdala had no effect on rewarded errors (error + 1, rewarded errors only, F(1,2) = 6.76, p > 0.1), they had a marked effect on unrewarded errors (error + 1, unrewarded errors only, F(1,2) = 24.52, p < 0.05). This suggests that lesions of the amygdala specifically affect the use of negative feedback to guide subsequent choices.
For completeness, we also analyzed how positive and negative feedback influenced choices across four 10-trial blocks. As before, we define errors as a selection of the stimulus associated with the lower amount of reward. Amygdala lesions disrupted the ability of monkeys to use positive feedback during the first block compared with the 3 later blocks (surgery by block interaction, F(3,6) = 10.35, p < 0.01; block 1, p < 0.05) and disrupted the ability of monkeys to use negative feedback across all blocks, an effect that was most apparent in blocks 3 and 4 (effect of surgery, F(1,3) = 31.44, p < 0.05; Fig. 3C).
Two additional analyses further probed the behavioral effects of amygdala lesions on learning. The first tested whether monkeys selected the same instrumental response as the rewarded trial immediately preceding an error (i.e., spatial perseveration). The second looked at whether monkeys were simply using the location of the first presented stimulus to guide their choices (i.e., spatial priming). Neither analysis revealed an effect of the amygdala lesions (p > 0.1 in both cases).
Therefore, our results indicate that the amygdala is critical for the rapid learning of stimulus–reward associations and, in the context of the present task, supports learning in part by updating stimulus–reward associations after errors.
Stimulus–reward encoding during learning
While monkeys performed the stimulus–reward learning task, we recorded the activity of 133 neurons in OFC (12 in Monkey H, 30 in Monkey N, and 91 in Monkey V) and 95 neurons in MFC (54 in Monkey H, 29 in Monkey N, and 12 in Monkey V) (Fig. 2B).
As monkeys acquired the stimulus–reward associations, the activity of neurons in OFC and MFC changed rapidly to reflect the amount of reward that was associated with the choice stimuli, which is consistent with previous reports (Wallis and Miller, 2003; Morrison and Salzman, 2009). For example, the activity of the neuron in Figure 4A shows higher rates of firing during the presentation of stimuli associated with larger amounts of fluid reward for both S1 and S2. Figure 4B shows that the activity of the neuron shown in Figure 4A discriminates rapidly among reward amounts associated with the three novel stimuli within the first 10 trials, matching the monkey's behavioral learning of the three stimulus–reward associations (Fig. 4B, inset).
Figure 4.

Stimulus–reward encoding within OFC and MFC during learning. A, Spike-density function and raster plot depicting the activity of a neuron recorded from OFC. The neuron exhibits the highest firing rate for stimuli associated with the greatest amount of reward and the lowest firing rate for stimuli associated with smallest amount of reward. Raster plots are sorted and color coded by the amount of reward associated with each stimulus. B, Mean (±SEM) activity of the neuron in A to the three different stimuli during the S1 and S2 periods relative to the start of the testing session. Mean responses are based on a running average of five trials. Yellow dots mark bins in which p < 0.05, FDR corrected. Inset shows trial-by-trial reward amounts associated with the three stimuli estimated from a reinforcement learning model fit to the data. C, Percentage of neurons classified by a sliding hierarchical ANOVA as encoding a factor during either the reference period (“Ref”, 1.0 s before the onset of the first stimulus), the S1 period (the initial 1.0 s after the onset of the first stimulus), or the S2 period (the initial 1.0 s after the onset of the second stimulus). D, Time course of encoding: mean (±SEM) percentage explained variance for neurons classified as encoding stimulus–reward associations in OFC (S1: dark blue; S2: cyan) and MFC (S1: red; S2: orange). Data are plotted relative to the onset of S1.
To quantify the pattern of activity across the population of recorded neurons, we conducted a sliding ANOVA on a 2.0 s period starting at the onset of the presentation of S1. This period was divided into two parts and neurons were classified as encoding a task factor within either the S1 or S2 periods. (Note, however, that S1 remained present during the S2 period.) The ANOVA included factors of S1 and S2 expected value estimated from a reinforcement learning model on a trial-by-trial basis, instrumental response (left or right), and all second-order interactions. The model was fit separately to the choice behavior from each session, producing estimates of stimulus value for each stimulus on each trial, as well as the learning rate and the inverse temperature for each session. The model-based value estimates for S1 and S2 for each trial controlled for different stimulus–reward behavior and learning rates across sessions.
A smaller proportion of neurons in OFC and MFC encoded the amount of reward associated with S1 (Fig. 4C, OFC: 11%, 15/133; MFC: 8%, 8/95) compared with S2 (OFC: 19%, 25/133; MFC: 13%, 12/95, effect of stimulus, χ2 = 3.7, p = 0.05). There was no difference between the proportions of neurons encoding stimulus reward value between the areas (effect of area, χ2 = 2.0, p > 0.1). A substantial proportion of neurons in OFC and MFC also continued to encode the amount of reward associated with S1 after S2 had been presented (OFC: 13%, 17/133; MFC: 16%, 15/95). Again, there was no difference between the proportions of neurons in each area encoding this factor (χ2 < 0.5, p > 0.5). OFC and MFC did differ, however, in the time course of the encoding of the reward associated with the two stimuli (dark blue/cyan vs red/orange curves; Fig. 4D). Neurons in OFC signaled the amount of reward associated with S1 and S2 earlier than neurons in MFC (latency of encoding, effect of area, F(1,56) = 4.33, p < 0.05).
Neurons that encoded the amount of reward associated with S1 during the S1 period were highly likely to switch to encoding the amount of reward associated with S2 during the S2 period, mirroring previous findings (Rudebeck et al., 2013a). This was true for both OFC (73%, 11/15 neurons) and MFC (38%, 3/8 neurons) and, in both areas, these proportions were substantially higher than would be expected by chance (binomial test against joint probability, p < 0.001). During stimulus evaluation, few neurons in either area encoded the instrumental response that the monkeys would subsequently make (OFC: 3%, 4/133; MFC: 3%, 3/95). Table 1 presents the full list of effects.
Table 1.
Summary of all effects from ANOVA on the activity of neurons during the stimulus period preoperatively
| Factor | S1 period (0–1000 ms after presentation of first stimulus) |
S2 period (1000–2000 ms after presentation of first stimulus) |
||||
|---|---|---|---|---|---|---|
| OFC | MFC | Total | OFC | MFC | Total | |
| S1 reward | 15 | 8 | 23 | 17 | 15 | 32 |
| S2 reward | 11 | 3 | 14 | 25 | 12 | 37 |
| Movement dir. | 2 | 2 | 4 | 4 | 3 | 7 |
| S1 × S2 reward | 5 | 1 | 6 | 4 | 2 | 6 |
| S1 reward × movement direction | 5 | 4 | 9 | 5 | 2 | 7 |
| S2 reward × movement direction | 4 | 0 | 4 | 8 | 1 | 9 |
| Total recorded | 133 | 95 | 228 | 133 | 95 | 228 |
Shown is the number of neurons classified in either the OFC or MFC as being significantly modulated by a main factor or first-order interaction by the sliding window ANOVA in the stimulus period preoperatively. The period is split into S1 and S2 periods.
We also explored the influence of the relative reward value of S1 on encoding of S2. Here, we define the relative value of S1 as whether the amount of reward associated with S1 was greater or smaller than the amount associated with S2. To do this, we conducted a sliding hierarchical ANOVA on a 1.0 s period starting at the onset of the presentation of S2. Factors included in the ANOVA were the reward amount associated with S2, the relative value of S1, and the interaction term. Neurons in OFC predominantly encoded the absolute reward value associated with S2 (14%, 18/133), as opposed to the S2 value as a function of S1 value (7/133 or 5%, χ2 = 2.1, p < 0.05). A similar proportion of neurons in OFC signaled the relative value of S1 (10/133 or 8%, χ2 = 1.4, p > 0.1). The same was not true in MFC. Similar proportions of neurons encoded the absolute value of S2 (10% or 9/95), relative value of S1 and S2 value as a function of S1 value (11% and 7%, 11/95 and 7/95, respectively, both comparisons χ2 < 2.6, p > 0.5). This analysis suggests that neurons in OFC, but not MFC, encode the value of S1 and S2 in a largely independent manner.
In summary, a similar proportion of neurons in OFC and MFC developed encoding related to the amount of reward associated with the novel stimuli presented for choice, but did so with slightly different dynamics. Neurons in OFC tended to encode the absolute value of reward associated with stimuli, as opposed to relative reward amounts.
Expected and received reward encoding during learning
In keeping with previous reports, neurons in both OFC and MFC also signaled the amount of reward the monkeys expected to receive for making a choice as well as the amount that they received. The activity of the neuron illustrated in Figure 5A increased just before monkeys made a choice and signaled the amount of reward the monkey expected to receive, with the highest firing rate for the stimulus associated with no reward. Figure 5B shows how the activity of the neuron in Figure 5A developed to distinguish between the amounts of reward that the monkey expected to receive after a choice.
Figure 5.

Expected and received reward encoding in OFC and MFC during learning. A, Spike-density function and raster plot depicting the activity of an OFC neuron during the expected (−1000–0 ms) and received (0–1000 ms) reward periods. Raster plots are sorted by chosen amount of reward and both spike-density functions and raster plots are color coded by reward amount. B, The mean (±SEM) activity of the neuron in A to the three different stimuli during the expected reward period during initial learning. Mean responses are based on a running average of five trials. Yellow dots mark bins in which p < 0.05, false-discovery rate corrected. Inset shows trial-by-trial reward amounts associated with the three stimuli estimated from a reinforcement learning model fit to the data. The red curve is truncated because, as the monkeys learned, they stopped choosing the stimulus predicting 0.0 ml of water. C, Percentage of neurons in OFC (top) and MFC (bottom) classified as being significantly modulated by chosen reward, instrumental response, and the interaction term during either the expected (−500–0 ms before reward onset) or received reward periods (0–1000 ms after reward onset).
To quantify these results across all recorded neurons, we conducted a sliding ANOVA on a 2.0 s period around reward delivery (from 1.0 s before until 1.0 s after the onset of reward delivery). This period was then split into either the expected reward period or the received reward period, with the former corresponding to the 1.0 s period before reward onset. The ANOVA included factors of chosen expected value estimated by the reinforcement learning model on a trial-by-trial basis, instrumental response (left or right), and second-order interactions.
Neurons in both OFC and MFC encoded the amount of reward that the monkeys expected to receive after a choice and there was no difference between these proportions (OFC: 16%, 21/133; MFC: 14%, 13/95, χ2 = 0.06, p > 0.5; Fig. 5C). Similar proportions of neurons in OFC (23%, 30/133) and MFC (25%, 24/95, χ2 = 0.1, p > 0.5) encoded the amount of reward the monkeys subsequently received. Somewhat surprisingly, only a small number of neurons in MFC encoded the instrumental response, left or right, that the monkeys made, whereas a higher proportion in OFC did so (OFC: 13%, 17/133; MFC: 2%, 2/95, χ2 = 6.93, p < 0.01; Fig. 5C). Table 2 presents the full list of effects. Overall, these data suggest that, during learning, encoding of expected and received reward develop similarly in OFC and MFC.
Table 2.
Summary of all effects from ANOVA on the activity of neurons during the reward period preoperatively
| Factor | Expected period (−1000–0 ms before reward delivery) |
Received period (0–1000 ms after reward delivery) |
||||
|---|---|---|---|---|---|---|
| OFC | MFC | Total | OFC | MFC | Total | |
| Chosen reward value | 21 | 13 | 34 | 30 | 24 | 54 |
| Movement direction | 17 | 2 | 19 | 8 | 2 | 10 |
| Chosen × movement direction | 15 | 2 | 17 | 7 | 0 | 7 |
| Total recorded | 133 | 95 | 228 | 133 | 95 | 228 |
Shown is the number of neurons classified as being significantly modulated by the main factors or first-order interactions by the sliding window ANOVA conducted in the reward period preoperatively. The period is split into expected and received reward periods.
Contrasting novel and familiar stimulus–reward versions of the task
We reported previously that 25–35% of neurons in OFC and MFC encoded stimulus–reward associations when monkeys chose between well learned or “familiar” stimuli (Rudebeck et al., 2013a). Furthermore, marked differences in reward encoding in OFC versus MFC were evident in that study. Given the nearly identical task parameters (e.g., stimulus timing) and that the recordings in the present study were from the same animals, it is surprising that only 10–20% of neurons in OFC and MFC encoded stimulus–reward associations during learning with “novel” stimuli in the present task and that there were few differences between OFC and MFC (Fig. 4). To quantify these differences across tasks, we compared directly the proportion of neurons encoding both stimulus–reward associations and expected and received reward when monkeys chose between familiar stimuli (Rudebeck et al., 2013a) versus when they had to learn the amount of reward associated with novel stimuli (present study). This comparison revealed that there were fewer neurons in OFC that encoded the amount of reward associated with S1 and S2 when they were novel compared with when they were familiar (χ2 test, p < 0.05; Fig. 6, left). In MFC, fewer neurons encoded the amount of reward associated with S1 (χ2 test, p < 0.05; Fig. 6, right). No other comparisons reached the threshold for significance in OFC or MFC (p > 0.1).
Figure 6.

Comparison of the proportion of neurons at the population level that encoded reward-related task factors in tasks with familiar or novel stimuli. The percentage of neurons in OFC (left) and MFC (right) that encoded the amount of reward associated with S1 and S2, as well the expected and received reward in a task with familiar (blue bars; Rudebeck et al., 2013a) as opposed to novel stimuli (red bars; present study). *p < 0.01.
To further explore this difference in encoding, we next investigated how individual neurons tracked reward-related features across the two tasks; that is, whether a neuron encoding S1 reward amount in the familiar task also encoded S1 reward amount in the learning task. This was possible because the two tasks were run sequentially and many of the neurons were recorded in both tasks. In total, we were able to record the neural activity of 101 neurons in OFC (12 in Monkey H, 22 in Monkey N, and 67 in Monkey V) and 74 in MFC (50 in Monkey H, 18 in Monkey N, and 6 in Monkey V) in both the novel stimulus and familiar stimulus versions of the task.
Of the neurons within this population, some consistently signaled the same task factors across tasks but others did not. For example, the activity of the neuron shown in Figure 7A signaled the amount of reward associated with S2 in the familiar, but not in the novel, task. For this individual neuron, there was also a substantial increase in firing rate across the two tasks that was potentially related to satiation, an effect of the task, or both, which is consistent with previous reports (Critchley and Rolls, 1996; Bouret and Richmond, 2010). In Figure 7B, the neuron signaled the amount of expected and received reward in both tasks, but with different encoding schemes. In the familiar task, the highest spike rate is associated with receiving the smallest reward in that task (0.1 ml), whereas, in the learning task, the highest firing rate is associated with the greatest amount of reward (0.4 ml).
Figure 7.

Comparison of reward encoding by individual neurons across tasks with familiar and novel stimuli. A, B, Spike-density functions, waveform plots, and raster plots depicting the activity of two neurons recorded within OFC in a familiar (top; Rudebeck et al., 2013a) and novel task (bottom; present study). The neuron in A increases its firing rate to stimuli associated with greater amount of reward in the familiar task, but a similar modulation by stimulus reward amount is not apparent in the task in which novel stimulus–reward associations have to be learned. The neuron in B has a higher firing rate when the monkey expects and then receives smaller amounts of reward in the familiar task, but has the opposite encoding in the novel task, where higher firing rates are associated with larger amounts of expected and received reward. C, Percentage of neurons that encode the amount of reward associated with S1, S2, expected, and received reward in the familiar task (blue) and the proportion of those neurons that also signal the same task factors in the novel task (red). Only neurons recorded in both tasks contributed to these plots and numbers in yellow give the overall percentages that encoded in both tasks relative to the familiar task.
To quantify these effects across the population of cells recorded in both tasks, we calculated the number of neurons that signaled the same reward-related task factor from the familiar to the novel task (i.e., encoded a factor in familiar AND novel tasks). In both OFC and MFC, <25% of the neurons that encoded the amount of reward associated with S1 and S2 in the familiar task also encoded the amount of reward associated S1 and S2 in the novel task (Fig. 7C). In contrast, between 40% and 60% of neurons in OFC and MFC that encoded the amount of expected and received reward in the familiar task also encoded the same task factors in the novel task. The most consistent encoding was found in OFC, where >60% of neurons that encoded the amount of received reward in the familiar task also did so in the novel task. There were no differences between the consistency of encoding in OFC and MFC. Together, these analyses reveal that reward encoding across tasks, even very similar tasks, is highly variable in OFC and MFC, consistent with reports in lateral prefrontal cortex (Asaad et al., 2000; Genovesio et al., 2012).
Amygdala lesion effects on stimulus–reward encoding during learning
At the completion of the preoperative recordings, each monkey received injections of excitotoxin into the amygdala bilaterally in two stages (Fig. 1). After surgery, subjects were retested under the same task conditions and we recorded the activity of 184 neurons in OFC (92 in Monkey N, 92 in Monkey V) and 88 in MFC (47 in Monkey H, 41 in Monkey N). Importantly, there was a high degree of overlap between locations recorded preoperatively and postoperatively in both OFC and MFC (Fig. 2B).
Similar to the preoperative data, postoperatively, many neurons in OFC and MFC encoded the amount of reward that monkeys had learned was associated with the different visual stimuli. Before applying the same types of analyses that were applied to the preoperative data to the postoperative data, we first confirmed that there were no differences in firing rate between the preoperative and postoperative datasets that might have skewed the results. The amygdala projections to the frontal cortex are excitatory and target both OFC and MFC, although the pattern of connections from different nuclei differs (Ghashghaei et al., 2007). Lesions could therefore lead to a significant reduction in firing rate in either area. This is a concern because a decrease in firing rates postoperatively could bias the statistical tests to potentially produce more type II (false-negative) errors. A comparison of baseline (0.5 s before S1 onset) and evoked (0.5 s after S1 onset) activity before and after surgery (2 levels) across OFC and MFC, however, failed to find any differences between the preoperative and postoperative recordings (baseline or evoked: effect of surgery or surgery by area interaction, F(1,498) < 2, p > 0.2). Given the lack of effect of amygdala removal on this measure of activity in OFC and MFC, we conclude that it is appropriate to apply the same statistical tests to the preoperative and postoperative datasets.
Applying the same sliding ANOVA used for the preoperative data, we found that the proportion of neurons in the OFC and MFC encoding the amount of reward associated with the different visual stimuli during learning was reduced after amygdalectomy (Fig. 8A). Preoperatively, 11% and 19% of OFC neurons and 8% and 13% of MFC neurons encoded the amount of reward associated with S1 and S2, respectively (also see Fig. 4C). Postoperatively, these percentages were virtually unchanged for S1 reward encoding (OFC: 23/184 or 13%; MFC: 4/88 or 5%, effect of surgery, χ2 = 0.68, p > 0.5), but were reduced for S2 reward encoding in both areas (OFC: 22/184 or 12%; MFC: 6/88 or 7%, effect of surgery, χ2 = 4.5, p < 0.05). We note that this change at S2 in OFC and MFC was most apparent in Monkey N (preoperative OFC: 27%; postoperative OFC: 14%) and Monkey H (preoperative MFC: 17%; postoperative MFC: 2%), respectively (Fig. 8C, bottom).
Figure 8.

Effect of excitotoxic lesions of the amygdala on stimulus–reward encoding in OFC and MFC during learning. A, Percentage of neurons in OFC and MFC encoding the amount of reward associated with S1 or S2 preoperatively (blue/cyan) and postoperatively (red/orange). B, Time course of encoding: mean (±SEM) percentage explained variance for neurons classified as encoding stimulus–reward associations in OFC (top) and MFC (bottom). For both plots, preoperative S1: dark blue; preoperative S2: cyan; postoperative S1: red; postoperative S2: orange. Data are plotted relative to the onset of S1. C, Mean percentage explained variance for S1 reward (top) and percentage of neurons encoding S2 reward (bottom) for individual monkeys before and after lesions of the amygdala. Inset plots show the percentage change for each subject combined across OFC and MFC. For both plots, preoperative OFC: dark blue; postoperative OFC: cyan; preoperative MFC: red; postoperative MFC: orange. *p < 0.05; # p < 0.1.
Despite there being no change in the proportion of neurons encoding the amount of reward associated with S1, there was a reduction in the information encoded by neurons in both OFC and MFC (maximum percentage explained variance within S1 period, effect of surgery, F(1,42) = 6.07, p < 0.02, surgery by monkey interaction, F(2,42) = 1.33, p > 0.2; Fig. 8B). Again, this effect was greatest in Monkeys H and N (Fig. 8C, top). A similar reduction in information was not seen for the encoding of S2 (p > 0.05).
Additional analyses investigated whether lesions of the amygdala affected the latency of neurons in OFC and MFC to encode the amount of reward associated with S1 or S2 (Fig. 8B) or the monkey's upcoming instrumental response or interaction between S2 reward amount and response. Neither analysis revealed any effect of the amygdala lesion (p > 0.1). Table 3 presents the full list of effects.
Table 3.
Summary of all effects from ANOVA on the activity of neurons during the stimulus period postoperatively
| Factor | S1 period (0–1000 ms after presentation of first stimulus) |
S2 period (1000–2000 ms after presentation of first stimulus) |
||||
|---|---|---|---|---|---|---|
| OFC | MFC | Total | OFC | MFC | Total | |
| S1 reward | 23 | 4 | 27 | 28 | 8 | 36 |
| S2 reward | 9 | 3 | 12 | 22 | 6 | 28 |
| Movement direction | 4 | 1 | 5 | 5 | 3 | 8 |
| S1 × S2 reward | 4 | 0 | 4 | 13 | 1 | 14 |
| S1 reward × movement direction | 5 | 1 | 6 | 5 | 4 | 9 |
| S2 reward × movement direction | 2 | 3 | 5 | 5 | 5 | 10 |
| Total recorded | 184 | 88 | 272 | 184 | 88 | 272 |
Shown is the number of neurons classified in either the OFC or MFC as being significantly modulated by a main factor or first-order interaction by the sliding window ANOVA in the stimulus period postoperatively. The period is split into S1 and S2 periods. All factors and main factor interactions are included. Compare and contrast with Table 1.
Together, the behavioral and physiological data suggest that lesions of the amygdala slow the rate at which monkeys acquire stimulus–reward associations by reducing the encoding, both in terms of the information signaled and the proportion of neurons related to stimulus–reward amount in OFC and MFC.
Amygdala lesion effects on neural activity near reward
In both the OFC and MFC, amygdala lesions did not alter the proportion of neurons that encoded the magnitude of expected and received reward. As explained below, however, loss of amygdala inputs did yield a change in the encoding of the instrumental response that monkeys made on each trial.
For expected reward, we found no difference in the proportion of OFC or MFC neurons that encoded the amount of expected reward between the preoperative and postoperative datasets (Fig. 9A, OFC postoperative: 20/184 or 11% vs preoperative: 21/133 or 16%; MFC: postoperative: 16/88 or 18% vs preoperative: 13/95 or 14%, effect of surgery, χ2 = 1.1, p > 0.2).
Figure 9.

The effect of excitotoxic lesions of the amygdala on expected and received reward encoding in OFC and MFC. A, Percentage of neurons encoding the expected and received reward value in OFC (top) and MFC (bottom) preoperatively and postoperatively. After removal of the amygdala, there was a slight reduction in the proportion of neurons encoding the value of expected and received reward in OFC and MFC. B, Percentage of neurons encoding the instrumental response in OFC (top) and MFC (bottom) preopeartively and postoperatively. Inset shows the percentage for individual subjects. After removal of the amygdala, there was an increase in the proportion of neurons encoding the response (left or right) in MFC, but not OFC. C, Percentage explained variance (PEV) associated with the instrumental response for each neuron in MFC recorded preoperatively (left) and postoperatively (right). Neurons are sorted according to when they were classified as being significantly modulated by the instrumental response. Lighter or “hotter” colors are associated with higher explained variance. *p < 0.05.
For received reward, we similarly found no change in the proportion of neurons in both OFC and MFC, similar to that observed for encoding of expected reward (Fig. 9A). Preoperatively, 23% and 25% of neurons in OFC and MFC encoded received reward, respectively. Postoperatively, this decreased slightly to 16% (30/184) and 17% (15/88) in OFC and MFC, respectively. As was the case for expected reward, these proportions were not statistically different from the preoperative data (effect of surgery, χ2 = 0.184, p > 0.5).
In contrast to the lack of effect of amygdala lesions on the proportions of neurons encoding expected and received reward, there was a change in the proportion of neurons across the two areas that encoded each monkey's instrumental response, left versus right, around the time of contact with the choice key (Fig. 9B,C). This change was manifest as a decrease in the proportion of neurons in OFC (preoperative OFC: 17/133 or 13%, postoperative OFC: 7/184 or 4%) and an increase in MFC (preoperative MFC: 2/95 or 2%, postoperative MFC: 10/88 or 11%, logistic regression, surgery by area interaction, χ2 = 8.56, p < 0.005; monkey by surgery interaction, χ2 = 0.11 p > 0.5).
Importantly, the increase in instrumental response encoding was not idiosyncratic to a single subject, but was seen in both monkeys in which postoperative MFC recordings were made (Monkey H, 4/47; Monkey N, 6/41 neurons; Fig. 9B, inset). Because previous studies have reported that a greater proportion of neurons in the MFC posterior to the genu of the corpus callosum encode instrumental responses (Luk and Wallis, 2009), we also examined the location of these response encoding neurons. Of the 10 neurons classified as encoding response, five were located anterior to the genu of the corpus callosum in the dorsal bank of the cingulate sulcus and five were located posterior to the genu. This indicates that an increase in instrumental response encoding was not simply due to postoperative recordings being in more posterior areas. Table 4 presents the full list of effects.
Table 4.
Summary of all effects from ANOVA on the activity of neurons during the reward period postoperatively
| Factor | Expected period (−1000–0 ms before reward delivery) |
Received period (0–1000 ms after reward delivery) |
||||
|---|---|---|---|---|---|---|
| OFC | MFC | Total | OFC | MFC | Total | |
| Chosen reward value | 20 | 16 | 36 | 30 | 15 | 45 |
| Movement direction | 7 | 10 | 17 | 8 | 8 | 16 |
| Chosen × movement direction | 6 | 1 | 7 | 2 | 0 | 2 |
| Total recorded | 184 | 88 | 272 | 184 | 88 | 272 |
Shown is the number of neurons classified as being significantly modulated by the main factors or first-order interactions by the sliding window ANOVA conducted in the reward period postoperatively. The period is split into expected and received reward periods. Compare and contrast with Table 2.
In summary, loss of amygdala inputs led to a change in task-related neural activity around the time of reward delivery, leading to a decrease in the encoding of instrumental responses in OFC and an increase in the encoding of instrumental responses in MFC.
Amygdala lesion effects across novel and familiar tasks
We reported previously that lesions of the amygdala reduce reward encoding in OFC and MFC by ∼30% in a task in which monkeys chose between familiar stimuli (Rudebeck et al., 2013a). To test whether amygdala lesions had a similar effect on the neural activity related to learning the amount of reward associated with novel stimuli, we compared directly the percentage of neurons encoding reward-related task variables in the familiar and novel tasks after amygdala lesions. As before, differences between the two tasks were confined to the stimulus period, but now there was a marked reduction of the encoding of both S1 and S2 in OFC and MFC in the novel compared with the familiar task (cf. Figs. 10A, 6; statistical significance determined by χ2 test, p < 0.01). Therefore, any stimulus period differences between OFC and MFC that were apparent in the preoperative data across the two tasks were now abolished.
Figure 10.

Comparison of reward encoding by individual neurons across tasks with familiar and novel stimuli before and after amygdala lesions. A, Percentage of neurons in OFC (left) and MFC (right) that encoded the amount of reward associated with S1, S2, expected, and received reward in the “familiar” (blue) and “novel” (red) tasks after amygdala lesions. Compare and contrast with Figure 6. B, Percentage of neurons that encode the amount of reward associated with S1, S2, expected, and received reward in the familiar task before and after amygdala lesions (light blue and light red) and the proportion of those neurons that also signaled the same task factors in the novel task (cyan and orange). Inset figure show percentages for individual subjects. Only neurons recorded in both tasks contributed to these plots. Numerals give the overall percentages of neurons in the familiar task that also signal the same task factor in the novel task. *p < 0.05; **p < 0.01.
Unexpectedly, this comparison revealed that, after lesions of the amygdala, more neurons in the MFC, but not OFC, encoded the expected reward during the task with novel stimuli compared with that with familiar stimuli (χ2 test, p < 0.05; Fig. 10A).
We next investigated how individual neurons tracked reward-related features across the two tasks after lesions of the amygdala. Specifically, we looked for any changes in the proportion of neurons that encoded reward-related task factors across both tasks. In total, we were able to record the neural activity of 144 neurons in OFC (75 in Monkey N, 69 in Monkey V) and 68 in MFC (41 in Monkey H, 27 in Monkey N) in both tasks. Using an approach identical to that used before (Figs. 6, 7), we calculated the number of neurons recorded after amygdala lesions that signaled the same reward-related task factors from the familiar to the novel task (i.e., encoded a factor in familiar AND learning tasks in the same trial periods). In both OFC and MFC, there was little change in the percentage of neurons that signaled reward-related task factors across the familiar and novel tasks after amygdala lesions (Fig. 10B). There was, however, one exception. After amygdalectomy, neurons in OFC that encoded received reward in the familiar task were less likely to do so in the novel task (preoperative: 61% or 14/23; postoperative: 25% or 6/24, χ2 = 4.8, p < 0.05). This finding should be treated with caution, however, because the reduction was present in Monkey N, but not Monkey V (Fig. 10B, inset). Therefore, in one monkey, amygdala lesions specifically affected the way that individual neurons in OFC encoded received rewards across the familiar and novel tasks, suggesting that the amygdala input to PFC shapes how networks of neurons signal reward across tasks.
Discussion
We found that monkeys were slower to learn stimulus–reward associations after amygdala lesions (Fig. 3A), an effect that may in part be driven by an inability to use negative feedback to guide choices (Figs. 3B,C). To compare behavioral and neural correlates of stimulus–reward learning more accurately, we applied trial-by-trial estimates of stimulus value from a reinforcement learning model to the activity of single neurons in OFC and MFC. Before lesions of the amygdala, neurons in both OFC and MFC developed responses that correlated with amount of reward associated with each stimulus (Fig. 4), as well as with the expected and received amount of reward (Fig. 5). On each trial, encoding of stimulus–reward associations was apparent in OFC before MFC. Comparisons between the present task, in which monkeys had to learn stimulus–reward associations, and a nearly identical task with highly familiar associations revealed differences in the stimulus–reward, but not expected or received reward encoding, between the tasks (Figs. 6, 7).
Lesions of the amygdala produced three changes in the signaling of task-related events in OFC and MFC: (1) a decrease in the encoding of the amount of reward associated with S1 and S2 during stimulus presentation in both regions (Fig. 8); (2) an increase in the proportion of neurons encoding the instrumental response in MFC, with a concomitant decrease in the proportion in OFC, around the time of choice (Fig. 9B,C); and (3) a decrease in the consistency with which neurons in OFC signaled received reward across tasks with novel and familiar stimuli (Fig. 10B).
Amygdala contributions to stimulus–reward learning
Previous studies in monkeys indicate that the amygdala is not necessary for the acquisition of stimulus–reward associations, but is required when established associations have to be updated according to current internal states (Izquierdo and Murray, 2007; Machado and Bachevalier, 2007). In contrast, our data suggest that the amygdala is required for normal rates of stimulus–reward learning (Fig. 3A). The apparent discrepancy between past and present results is likely due to a number of factors, including learning of novel stimuli within a day as opposed to across days (Málková et al., 1997), choosing between options associated with different magnitudes of reward as opposed to those associated with the presence or absence of reward, and using a within-subjects versus a between-subjects design.
The finding that amygdala lesions produced a deficit in learning from negative feedback (unrewarded or low reward) (error + 1) and, to a lesser degree, positive feedback (rewarded; Fig. 3B,C) is unexpected given previous reports of amygdala lesions facilitating choices after erroneous responses (Rudebeck and Murray, 2008; Izquierdo et al., 2013), but does potentially fit with a recent fMRI study in macaques (Chau et al., 2015). The previous reports of facilitation focused on learning after the reversal of established stimulus–reward associations as opposed to the initial acquisition, as in the present study. One way to reconcile these apparently conflicting results is that, during initial learning, monkeys without an amygdala likely formed degraded stimulus–reward associations, which would slow initial acquisition, but potentially augment performance after a reversal. The initial representation of the stimulus–reward contingencies would not, in this view, bias responding to the previously rewarded stimulus to the same degree as for unoperated controls. An alternative account relates to the use of reward magnitude to make choices, as opposed to presence or absence of reward.
Reward encoding in OFC and MFC during learning
Before lesions of the amygdala, 10–20% of neurons in both OFC and MFC developed responses that correlated with the amount of reward associated with visual stimuli (Fig. 4). In keeping with previous reports, neurons in OFC signaled the amount of reward associated with each stimulus earlier than neurons in MFC. Notably, these proportions are substantially lower than found in several previous reports (Kennerley et al., 2009; Morrison and Salzman, 2009; Cai and Padoa-Schioppa, 2012), including our own study performed in the same monkeys (Rudebeck et al., 2013a). This effect was especially true for the encoding of S1 reward amount, a difference that held both when the proportions of neurons across tasks were compared directly (Fig. 6) and when individual neuron responses were compared across tasks (Fig. 7). The main factor driving the proportion of stimulus–reward encoding is likely to be the familiarity of the stimulus–reward associations. Consistent with this idea, studies using well learned stimulus–reward associations (Kennerley et al., 2009) report higher proportions of anticipatory encoding relative to studies in which neuronal recordings were performed while monkeys learned stimulus–reward associations (Wallis and Miller, 2003).
What happens to encoding in OFC and MFC neurons during learning as stimulus–reward associations become established? It is possible that, during learning, stimulus–reward representations are more sparsely coded or represent multiple discriminative factors (e.g., reward type, reward magnitude, stimulus location). Through learning, these factors compete until only the ones that most immediately lead to reward or the goal of the animal are encoded by neurons in OFC and, potentially, MFC (Niv et al., 2015). Such an idea would potentially agree with the recent hypothesis that the OFC represents task space (Wilson et al., 2014).
Amygdala contributions to reward encoding in prefrontal cortex during learning
Interaction between frontal cortex and amygdala is vital for directing reward-guided behavior (Holland and Gallagher, 2004; Rudebeck and Murray, 2014). After amygdalectomy, we found a 30–40% decrease in the proportion of neurons in OFC and MFC that encoded stimulus–reward associations, a change confined to the S2 period (Fig. 8), together with a reduction in the information related to stimulus–reward amount (percentage of explained variance) encoded in OFC and MFC during the S1 period. We can only speculate as to why amygdala lesions had differential effects on encoding of S1 and S2. One possibility is that we were unable to find an alteration in the proportion of neurons signaling S1 after amygdala lesions because of the low percentage of neurons encoding this task variable preoperatively (i.e., a floor effect).
In contrast to the effect of amygdalectomy on stimulus–reward encoding during the period that monkeys evaluated the stimuli presented on each trial, there was no such effect on encoding of expected or received reward. This is in contrast to our previously reported finding that amygdala lesions reduce reward encoding in all task epochs when the association between stimuli and rewards are well learned.
The decrease in the reward encoding in both OFC and MFC would appear to complement previous findings in both humans (Hampton et al., 2007) and rodents (Schoenbaum et al., 2003); in these studies, lesions of the amygdala altered reward encoding within MFC and OFC during acquisition and reversal learning of stimulus–reward associations, respectively. The findings fit especially closely with those of Schoenbaum et al. (2003), who found a reduction in the number of neurons in OFC that signal stimulus–reward, but not expected or received reward, after lesions of the amygdala.
There was a marked increase in the encoding of the instrumental response within MFC after amygdala lesions (Fig. 9B,C), but a decrease within OFC. This increase could not be accounted for by intersubject variability or differences in location within the MFC between preoperative and postoperative recordings. Accordingly, such an increase must be related to a change in biasing signals, functional reorganization after lesions, or a change in cognitive strategy.
Interpretational issues
Based on anatomical connections (Ghashghaei et al., 2007), the effect of disconnection lesions (Baxter et al., 2000), and paired recordings between OFC and amygdala (Morrison and Salzman, 2011), there is good reason to think that the changes in behavior and neural activity after amygdala lesions reported here are related. Notably, the changes that we saw in OFC and MFC after amygdala lesions were specific to only one part of the trials, when subjects were evaluating the stimuli, as opposed to when they were receiving chosen rewards. Therefore, changes in activity might be expected to influence choice behavior. Further, the effects are specific to the stimulus–reward associations as opposed to other task factors such as stimulus presentation location. We acknowledge, however, that these are correlated changes. Therefore, it is possible that the changes in behavior and neural activity are independent effects of the lesion arising from separate processes. Although causal contributions could be addressed by using temporally limited manipulations (e.g., optogenetics or pharmacological inactivations), all designs that combine interference techniques with recordings of neural activity will suffer from this same problem. On the positive side, the use of chronic lesions, as was done here, can rule out the possibility that short-term plasticity yielded the results (Otchy et al., 2015).
Other interpretational issues include: the contribution of extra-amygdala damage, the variability of recordings preoperatively and postoperatively, and neuronal sampling biases toward larger, more active neurons. Because damage outside of the amygdala was not consistent across subjects, we do not believe that this influenced our results. Similarly, we recorded in the same locations preoperatively and postoperatively; if there was a sampling bias, it was matched between preoperative and postoperative recordings.
Conclusion
Dysfunction within the amygdala is thought to underlie a host of psychiatric conditions, most notably mood and anxiety disorders (Davidson, 2002; Murray et al., 2011). Here, using a combined lesion and recording approach, we provide evidence that the amygdala is critical for rapid learning in novel situations and that loss of amygdala input to the prefrontal cortex is associated with a reduction in the encoding of stimulus–reward, but not expected or received reward. These findings may add to our understanding of the neural bases of psychiatric disorders because they suggest that dysfunction within the amygdala is associated with a failure to learn rapidly, potentially as a result of an inability to update prefrontal stimulus–outcome associations.
Footnotes
This work was supported by the National Institute of Mental Health (Intramural Research Program Grant ZIAMH002886 to E.A.M.; BRAINS Award R01MH110822 to P.H.R.) and NARSAD (Young Investigator Award to P.H.R.). We thank Kevin Blomstrom, Kevin Fomalont and Ravi Chacko for assistance with data collection; James Fellows, Ping Yu Chen, and David Yu for help with surgery and histology; and Steven Wise for discussion and comments.
The authors declare no competing financial interests.
References
- Asaad WF, Rainer G, Miller EK (2000) Task-specific neural activity in the primate prefrontal cortex. J Neurophysiol 84:451–459. [DOI] [PubMed] [Google Scholar]
- Baxter MG, Parker A, Lindner CC, Izquierdo AD, Murray EA (2000) Control of response selection by reinforcer value requires interaction of amygdala and orbital prefrontal cortex. J Neurosci 20:4311–4319. [DOI] [PMC free article] [PubMed] [Google Scholar]
- Bouret S, Richmond BJ (2010) Ventromedial and orbital prefrontal neurons differentially encode internally and externally driven motivational values in monkeys. J Neurosci 30:8591–8601. 10.1523/JNEUROSCI.0049-10.2010 [DOI] [PMC free article] [PubMed] [Google Scholar]
- Cai X, Padoa-Schioppa C (2012) Neuronal encoding of subjective value in dorsal and ventral anterior cingulate cortex. J Neurosci 32:3791–3808. 10.1523/JNEUROSCI.3864-11.2012 [DOI] [PMC free article] [PubMed] [Google Scholar]
- Carmichael ST, Price JL (1995) Limbic connections of the orbital and medial prefrontal cortex in macaque monkeys. J Comp Neurol 363:615–641. 10.1002/cne.903630408 [DOI] [PubMed] [Google Scholar]
- Chau BK, Sallet J, Papageorgiou GK, Noonan MP, Bell AH, Walton ME, Rushworth MF (2015) Contrasting roles for orbitofrontal cortex and amygdala in credit assignment and learning in macaques. Neuron 87:1106–1118. 10.1016/j.neuron.2015.08.018 [DOI] [PMC free article] [PubMed] [Google Scholar]
- Clark L, Chamberlain SR, Sahakian BJ (2009) Neurocognitive mechanisms in depression: implications for treatment. Annu Rev Neurosci 32:57–74. 10.1146/annurev.neuro.31.060407.125618 [DOI] [PubMed] [Google Scholar]
- Critchley HD, Rolls ET (1996) Hunger and satiety modify the responses of olfactory and visual neurons in the primate orbitofrontal cortex. J Neurophysiol 75:1673–1686. [DOI] [PubMed] [Google Scholar]
- Davidson RJ. (2002) Anxiety and affective style: role of prefrontal cortex and amygdala. Biol Psychiatry 51:68–80. 10.1016/S0006-3223(01)01328-2 [DOI] [PubMed] [Google Scholar]
- Genovesio A, Tsujimoto S, Wise SP (2012) Encoding goals but not abstract magnitude in the primate prefrontal cortex. Neuron 74:656–662. 10.1016/j.neuron.2012.02.023 [DOI] [PMC free article] [PubMed] [Google Scholar]
- Ghashghaei HT, Hilgetag CC, Barbas H (2007) Sequence of information processing for emotions based on the anatomic dialogue between prefrontal cortex and amygdala. Neuroimage 34:905–923. 10.1016/j.neuroimage.2006.09.046 [DOI] [PMC free article] [PubMed] [Google Scholar]
- Hadland KA, Rushworth MF, Gaffan D, Passingham RE (2003) The anterior cingulate and reward-guided selection of actions. J Neurophysiol 89:1161–1164. [DOI] [PubMed] [Google Scholar]
- Hampton AN, Adolphs R, Tyszka MJ, O'Doherty JP (2007) Contributions of the amygdala to reward expectancy and choice signals in human prefrontal cortex. Neuron 55:545–555. 10.1016/j.neuron.2007.07.022 [DOI] [PubMed] [Google Scholar]
- Holland PC, Gallagher M (2004) Amygdala-frontal interactions and reward expectancy. Curr Opin Neurobiol 14:148–155. 10.1016/j.conb.2004.03.007 [DOI] [PubMed] [Google Scholar]
- Izquierdo A, Murray EA (2007) Selective bilateral amygdala lesions in rhesus monkeys fail to disrupt object reversal learning. J Neurosci 27:1054–1062. 10.1523/JNEUROSCI.3616-06.2007 [DOI] [PMC free article] [PubMed] [Google Scholar]
- Izquierdo A, Suda RK, Murray EA (2004) Bilateral orbital prefrontal cortex lesions in rhesus monkeys disrupt choices guided by both reward value and reward contingency. J Neurosci 24:7540–7548. 10.1523/JNEUROSCI.1921-04.2004 [DOI] [PMC free article] [PubMed] [Google Scholar]
- Izquierdo A, Darling C, Manos N, Pozos H, Kim C, Ostrander S, Cazares V, Stepp H, Rudebeck PH (2013) Basolateral amygdala lesions facilitate reward choices after negative feedback in rats. J Neurosci 33:4105–4109. 10.1523/JNEUROSCI.4942-12.2013 [DOI] [PMC free article] [PubMed] [Google Scholar]
- Jang AI, Costa VD, Rudebeck PH, Chudasama Y, Murray EA, Averbeck BB (2015) The role of frontal cortical and medial-temporal lobe brain areas in learning a bayesian prior belief on reversals. J Neurosci 35:11751–11760. 10.1523/JNEUROSCI.1594-15.2015 [DOI] [PMC free article] [PubMed] [Google Scholar]
- Kable JW, Glimcher PW (2009) The neurobiology of decision: consensus and controversy. Neuron 63:733–745. 10.1016/j.neuron.2009.09.003 [DOI] [PMC free article] [PubMed] [Google Scholar]
- Kennerley SW, Walton ME, Behrens TE, Buckley MJ, Rushworth MF (2006) Optimal decision making and the anterior cingulate cortex. Nat Neurosci 9:940–947. 10.1038/nn1724 [DOI] [PubMed] [Google Scholar]
- Kennerley SW, Dahmubed AF, Lara AH, Wallis JD (2009) Neurons in the frontal lobe encode the value of multiple decision variables. J Cogn Neurosci 21:1162–1178. 10.1162/jocn.2009.21100 [DOI] [PMC free article] [PubMed] [Google Scholar]
- Kennerley SW, Behrens TE, Wallis JD (2011) Double dissociation of value computations in orbitofrontal and anterior cingulate neurons. Nat Neurosci 14:1581–1589. 10.1038/nn.2961 [DOI] [PMC free article] [PubMed] [Google Scholar]
- Luk CH, Wallis JD (2009) Dynamic encoding of responses and outcomes by neurons in medial prefrontal cortex. J Neurosci 29:7526–7539. 10.1523/JNEUROSCI.0386-09.2009 [DOI] [PMC free article] [PubMed] [Google Scholar]
- Machado CJ, Bachevalier J (2007) The effects of selective amygdala, orbital frontal cortex or hippocampal formation lesions on reward assessment in nonhuman primates. Eur J Neurosci 25:2885–2904. 10.1111/j.1460-9568.2007.05525.x [DOI] [PubMed] [Google Scholar]
- Málková L, Gaffan D, Murray EA (1997) Excitotoxic lesions of the amygdala fail to produce impairment in visual learning for auditory secondary reinforcement but interfere with reinforcer devaluation effects in rhesus monkeys. J Neurosci 17:6011–6020. [DOI] [PMC free article] [PubMed] [Google Scholar]
- Matsumoto K, Suzuki W, Tanaka K (2003) Neuronal correlates of goal-based motor selection in the prefrontal cortex. Science 301:229–232. 10.1126/science.1084204 [DOI] [PubMed] [Google Scholar]
- Mitz AR. (2005) A liquid-delivery device that provides precise reward control for neurophysiological and behavioral experiments. J Neurosci Methods 148:19–25. 10.1016/j.jneumeth.2005.07.012 [DOI] [PubMed] [Google Scholar]
- Morrison SE, Salzman CD (2009) The convergence of information about rewarding and aversive stimuli in single neurons. J Neurosci 29:11471–11483. 10.1523/JNEUROSCI.1815-09.2009 [DOI] [PMC free article] [PubMed] [Google Scholar]
- Morrison SE, Salzman CD (2011) Representations of appetitive and aversive information in the primate orbitofrontal cortex. Ann N Y Acad Sci 1239:59–70. 10.1111/j.1749-6632.2011.06255.x [DOI] [PMC free article] [PubMed] [Google Scholar]
- Morrison SE, Saez A, Lau B, Salzman CD (2011) Different time courses for learning-related changes in amygdala and orbitofrontal cortex. Neuron 71:1127–1140. 10.1016/j.neuron.2011.07.016 [DOI] [PMC free article] [PubMed] [Google Scholar]
- Murray EA, Wise SP, Drevets WC (2011) Localization of dysfunction in major depressive disorder: prefrontal cortex and amygdala. Biol Psychiatry 69:e43–e54. 10.1016/j.biopsych.2010.09.041 [DOI] [PMC free article] [PubMed] [Google Scholar]
- Niv Y, Daniel R, Geana A, Gershman SJ, Leong YC, Radulescu A, Wilson RC (2015) Reinforcement learning in multidimensional environments relies on attention mechanisms. J Neurosci 35:8145–8157. 10.1523/JNEUROSCI.2978-14.2015 [DOI] [PMC free article] [PubMed] [Google Scholar]
- Otchy TM, Wolff SB, Rhee JY, Pehlevan C, Kawai R, Kempf A, Gobes SM, Ölveczky BP (2015) Acute off-target effects of neural circuit manipulations. Nature 528:358–363. 10.1038/nature16442 [DOI] [PubMed] [Google Scholar]
- Paton JJ, Belova MA, Morrison SE, Salzman CD (2006) The primate amygdala represents the positive and negative value of visual stimuli during learning. Nature 439:865–870. 10.1038/nature04490 [DOI] [PMC free article] [PubMed] [Google Scholar]
- Price JL, Drevets WC (2010) Neurocircuitry of mood disorders. Neuropsychopharmacology 35:192–216. 10.1038/npp.2009.104 [DOI] [PMC free article] [PubMed] [Google Scholar]
- Rhodes SE, Murray EA (2013) Differential effects of amygdala, orbital prefrontal cortex, and prelimbic cortex lesions on goal-directed behavior in rhesus macaques. J Neurosci 33:3380–3389. 10.1523/JNEUROSCI.4374-12.2013 [DOI] [PMC free article] [PubMed] [Google Scholar]
- Rudebeck PH, Murray EA (2008) Amygdala and orbitofrontal cortex lesions differentially influence choices during object reversal learning. J Neurosci 28:8338–8343. 10.1523/JNEUROSCI.2272-08.2008 [DOI] [PMC free article] [PubMed] [Google Scholar]
- Rudebeck PH, Murray EA (2014) The orbitofrontal oracle: cortical mechanisms for the prediction and evaluation of specific behavioral outcomes. Neuron 84:1143–1156. 10.1016/j.neuron.2014.10.049 [DOI] [PMC free article] [PubMed] [Google Scholar]
- Rudebeck PH, Behrens TE, Kennerley SW, Baxter MG, Buckley MJ, Walton ME, Rushworth MF (2008) Frontal cortex subregions play distinct roles in choices between actions and stimuli. J Neurosci 28:13775–13785. 10.1523/JNEUROSCI.3541-08.2008 [DOI] [PMC free article] [PubMed] [Google Scholar]
- Rudebeck PH, Mitz AR, Chacko RV, Murray EA (2013a) Effects of amygdala lesions on reward-value coding in orbital and medial prefrontal cortex. Neuron 80:1519–1531. 10.1016/j.neuron.2013.09.036 [DOI] [PMC free article] [PubMed] [Google Scholar]
- Rudebeck PH, Saunders RC, Prescott AT, Chau LS, Murray EA (2013b) Prefrontal mechanisms of behavioral flexibility, emotion regulation and value updating. Nat Neurosci 16:1140–1145. 10.1038/nn.3440 [DOI] [PMC free article] [PubMed] [Google Scholar]
- Rushworth MF, Noonan MP, Boorman ED, Walton ME, Behrens TE (2011) Frontal cortex and reward-guided learning and decision-making. Neuron 70:1054–1069. 10.1016/j.neuron.2011.05.014 [DOI] [PubMed] [Google Scholar]
- Schoenbaum G, Chiba AA, Gallagher M (1998) Orbitofrontal cortex and basolateral amygdala encode expected outcomes during learning. Nat Neurosci 1:155–159. 10.1038/407 [DOI] [PubMed] [Google Scholar]
- Schoenbaum G, Setlow B, Saddoris MP, Gallagher M (2003) Encoding predicted outcome and acquired value in orbitofrontal cortex during cue sampling depends upon input from basolateral amygdala. Neuron 39:855–867. 10.1016/S0896-6273(03)00474-4 [DOI] [PubMed] [Google Scholar]
- Thorpe SJ, Rolls ET, Maddison S (1983) The orbitofrontal cortex: neuronal activity in the behaving monkey. Exp Brain Res 49:93–115. [DOI] [PubMed] [Google Scholar]
- Walker A. (1940) A cytoarchitectural study of the prefrontal area of the macaque monkey. J Comp Neurol 73:59–86. 10.1002/cne.900730106 [DOI] [Google Scholar]
- Wallis JD, Miller EK (2003) Neuronal activity in primate dorsolateral and orbital prefrontal cortex during performance of a reward preference task. Eur J Neurosci 18:2069–2081. 10.1046/j.1460-9568.2003.02922.x [DOI] [PubMed] [Google Scholar]
- Wilson RC, Takahashi YK, Schoenbaum G, Niv Y (2014) Orbitofrontal cortex as a cognitive map of task space. Neuron 81:267–279. 10.1016/j.neuron.2013.11.005 [DOI] [PMC free article] [PubMed] [Google Scholar]