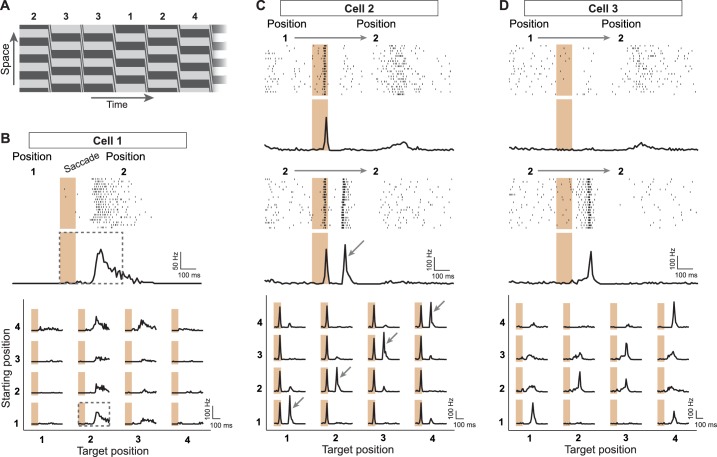
Figure 1. Sensitivity to image recurrence by retinal ganglion cells under saccade-like image shifts.
(A) Space-time representation of the saccade stimulus. The stimulus consisted of a spatial grating that was repeatedly shifted in a saccade-like fashion during 100 ms and then stopped randomly at one out of four different grating positions, where it then remained fixed for 800 ms before the next shift. The sequence of fixated grating positions, which are numbered from 1 to 4, is indicated in the top row. (B) Top: Raster plot and firing rate profile, obtained as the peristimulus time histogram (PSTH), for a ganglion cell (Cell 1) under shifts from grating position 1 to position 2. The saccade-like transition period is marked by the shaded region. Bottom: Firing rate profiles of the same cell for all 16 transitions between the four grating positions. Data are displayed for 400 ms, following transition onset. For comparison, the considered time window is shown by a dashed rectangle in the PSTH above. The fixation positions before and after the saccade-like transition are denoted as ‘starting position’ and ‘target position’, respectively. (C) Response patterns of a sample cell (Cell 2) with sensitivity to image recurrence (IRS cell). Raster plots and PSTHs are shown for transitions to grating position 2, starting either from position 1 (top) or from position 2 (center). Bottom: Firing rate profiles of this cell for all 16 transitions. The IRS response is apparent by the post-transition firing rate peak for traces along the diagonal of this matrix (marked by small arrows). (D) Same as (C) for another sample cell (Cell 3) with sensitivity to image recurrence, but without a response during the transition itself.

