Abstract
Objectives
Conventional material decomposition techniques for dual-energy CT (DECT) assume mass or volume conservation, where the CT number of each voxel is fully assigned to predefined materials. We present an image-domain contrast material extraction process (CMEP) method that preferentially extracts contrast-producing materials while leaving the remaining image intact.
Materials and Methods
Image processing freeware (Fiji) is used to perform consecutive arithmetic operations on a dual-energy ratio map to generate masks, which are then applied to the original images to generate material-specific images. First, a low-energy image is divided by a high-energy image to generate a ratio map. The ratio map is then split into material-specific masks. Ratio intervals known to correspond to particular materials (e.g. iodine, calcium) are assigned a multiplier of 1, while ratio values in between these intervals are assigned linear gradients from 0 to 1. The masks are then multiplied by an original CT image to produce material-specific images. The method was tested quantitatively at Dual-Source (DSCT) and Rapid kVp-Switching CT (RSCT) with phantoms using pure and mixed formulations of tungsten, calcium and iodine. Errors were evaluated by comparing the known material concentrations with those derived from the CMEP material-specific images. Further qualitative evaluation was performed in vivo at RSCT with a rabbit model using identical CMEP parameters to the phantom. Orally administered tungsten, vascularly administered iodine, and skeletal calcium were used as the three contrast materials.
Results
All five material combinations; tungsten, iodine and calcium, and mixtures of tungsten-calcium and iodine-calcium, showed distinct dual-energy ratios, largely independent of material concentration at both DSCT and RSCT. The CMEP was successful in both phantoms and in vivo. For pure contrast materials in the phantom, the maximum error between the known and CMEP-derived material concentrations was 0.9 mg/mL, 24.9 mg/mL and 0.4 mg/mL for iodine, calcium and tungsten respectively. Mixtures of iodine and calcium showed the highest discrepancies, which reflected the sensitivity of iodine to the image-type chosen for the extraction of the final material-specific image. The rabbit model was able to clearly show the three extracted material phases, vascular iodine, oral tungsten and skeletal calcium. Some skeletal calcium was misassigned to the extracted iodine image, however this did not impede the depiction of the vasculature.
Conclusions
The CMEP is a straightforward, image domain approach to extract material signal at dual-energy CT. It has particular value for separation of experimental high-Z contrast elements from conventional iodine contrast or calcium, even when the exact attenuation coefficient profiles of desired contrast materials may be unknown. The CMEP is readily implemented in the image-domain within freeware, and can be adapted for use with images from multiple vendors.
Keywords: Dual-energy CT, contrast material, high-Z element, material decomposition, material separation, rapid kVp-switching CT, Dual Source CT, iodine, calcium, tungsten
Introduction
First introduced a decade ago, Dual-energy CT (DECT) has emerged as a valuable imaging technique. Two main DECT implementations are currently available commercially, Rapid-kVp-Switching (RSCT), where a single x-ray source alternately pulses between low and high tube potentials during a single gantry rotation, and Dual Source CT (DSCT) where two x-ray sources offset by ∼90° operate at different tube potentials. A key benefit of DECT over conventional single energy CT is the ability to generate material-specific images, which can show and quantify the presence of particular elements, compounds or mixtures in a CT volume. Generation of these images relies on the relative change in the x-ray attenuation of different materials from low to high x-ray energies. With knowledge of the requisite materials within the image, and their attenuation coefficient profiles, the image can be separated into these constituent materials, a process known as material decomposition (MD). With RSCT vendor software, MD is performed for two materials in the projection space, via simultaneous equations in which the materials’ attenuation coefficient profiles and the actual attenuation at the two energies are the known terms, and material-specific attenuations are the unknown terms (1). With DSCT vendor software, it is performed for three materials in the image domain, with two body materials (such as fat and soft tissue) and an iodine enhancement vector (2). The voxel is assigned a ratio of fat and soft tissue, and the offset from this point on the slope of the iodine vector defines the iodine content (3, 4). Though three materials are used in the decomposition, this approach produces only two material-specific images, usually an iodine map and a virtual unenhanced map. This is due to the use of an iodine vector rather than the generation of material triplets, as employed for other three material decomposition approaches (5, 6).
Implementations of three material decomposition that operate independently of commercial DECT software have been developed using MATLAB (4, 7). Niu et al. added iterative noise suppression and regularization terms to better preserve image quality, and were able to increase low contrast detection (8). Liu et al. described a method to use mass, rather than volume as the conservation term for three material decomposition, which has advantages for materials that can be considered “in solution” and do not contribute to volume totals (6). Mendonça et al. introduced a multi-material decomposition (MMD) for use with more than three materials (5).. An optimization algorithm is used to solve the ill-posed problem, which contains too many unknown terms for an analytical solution. Long and Fessler expanded this method with further iterative image optimization algorithms (9).
Despite these advances, several disadvantages associated with MD persist. The most fundamental among these is the complete assignment of the original image data into chosen constituent materials, which assumes knowledge of all materials present. False positive signal is therefore frequently observed due to the inability to express all materials accurately (10, 11). This is evident in particular for the commonly used two-MD of iodine and water, where calcium is assigned partly to the iodine map and partly to the water map, as its attenuation coefficient profile lies between the two (12). Second, the assumption of volume conservation results in the unphysical presence of negative concentrations of materials, notably iodine when using commercially available two-MD (5). Third, MD is often not compatible with high atomic number (Z) contrast elements currently in development (13–16). This is because these elements have k-absorption edges that lie within the diagnostic energy range (∼ 40 – 140 keV) (15, 17). The k-edge discontinuity is not represented well at DECT, as attenuation data is only captured at two discrete x-ray spectra.
We propose a straightforward, empirical alternative, termed the “Contrast Material Extraction Process” (CMEP). Rather than decomposing the volume into a predetermined number of materials, CMEP selectively extracts positive (>0 HU) contrast-producing materials directly from the CT image volume by means of their dual-energy ratio. Dual-energy ratios are the quotient of the low-to-high energy CT numbers. Dual-energy ratios tend to be independent of concentration for a given material (18), and as a result of this robust behavior have received attention recently for screening the separability of different elements for MD (18, 19), and for evaluation of DECT source filtration options (20, 21). Despite their conceptual simplicity and utility, dual-energy ratios have only been used on a limited scale, including separation of iodine from calcium (22), bone removal (23), and determination of different kidney stone compositions (24).
The purpose of our pilot study was to assess the feasibility of the CMEP using the two most common dual energy CT scanners, in a phantom and in vivo rabbit model. The phantom contained tungsten, calcium and iodine solutions to various concentrations and mixtures. The rabbit model used oral tungsten and vascular iodine, while the skeletal calcium was separated as the third material.
Materials and Methods
Overview of the CMEP
The overall workflow for the CMEP is shown in Figure 1. Aside from the initial generation of low and high energy images by the CT scanner software, the CMEP is performed entirely within the Fiji freeware (25). As such it can be used for both DSCT and RSCT data. The step-by-step process of Figure 1 and the rationale for each step can be summarized as follows:
Generation of images. Low- (E1) and high-energy (E2) image datasets (subsequently referred to as images) are generated. At Dual Source CT (DSCT), the original 80 and 140 kVp images are accessible to the user, and can be used respectively as E1 and E2. At rapid-kVp switching CT (RSCT), the 80 and 140 kVp images are not available to the user. Instead, Virtual Monochromatic Spectral (VMS) images can be generated either at the scanner console or using commercial DECT software (GSI Viewer, GE Healthcare, Waukesha, WI). VMS images represent the appearance of the CT volume as if imaged by a monochromatic x-ray source. This is achieved via decomposition of projection data into the density integrals of two basis materials; water and iodine (26). The resulting image data can be displayed at VMS levels from 40–140 keV. 60 and 80 keV levels are suitable choices for E1 and E2 as they approximate the mean energies of the physical 80 and 140 kVp x-ray spectra (18).
Generation of ratio map: A division of E1 by E2 is performed to generate the dual-energy CT number ratio map, which contains the material-specific information.
Generation of the binary masks: Using either known dual-energy ratios, such as those available in literature (18, 19, 21), or via data generated with a calibration phantom, the ratio map is separated into energy-specific masks using a threshold function. For ratio intervals that are known to correspond to pure materials, binary masks are created (B1 for Material 1 and B2 for Material 2), which assign a value of 1 to regions that correspond to the material, and a value of 0 to regions that do not correspond to the material. As the dual-energy ratio is largely independent of concentration (18), this binary interval for a given material may be fairly narrow. The range of the binary interval is defined in this study to extend to the midpoint between the pure material ratio value and the nearest mixture value (e.g. if iodine has a ratio of 2.0 and a mixture containing 80% iodine and 20% of calcium has a ratio of 1.8, the lower limit of the iodine binary interval is set as 1.9).
Generation of the gradient masks: Between the binary intervals, a linear gradient mask of values from 0 to 1 is created for Material 2: G2. This is then inverted for application to Material 1: G1. Gradient masks are required for two reasons, first to enable a mixture of the two materials to exist in a single voxel and second, to provide a smooth material-specific images without discontinuities at particular ratio values (Fig. 2).
Generation of final masks: B1+G1 and B2+G2 additions are performed to create the final masks, F1 and F2.
Generation of the final images. The final masks are multiplied by an unprocessed CT image (E3) to generate the final material-specific images, M1 and M2. Using DSCT, a blended image representing the mean voxel values of the 80 and 140 kVp can be generated by the scanner and used for this task. Using RSCT, a 70 keV VMS image can be used, or indeed any VMS level. The VMS level should be chosen according to the optimum contrast and noise levels present, as the final material-specific image will have similar properties.
Figure 1.
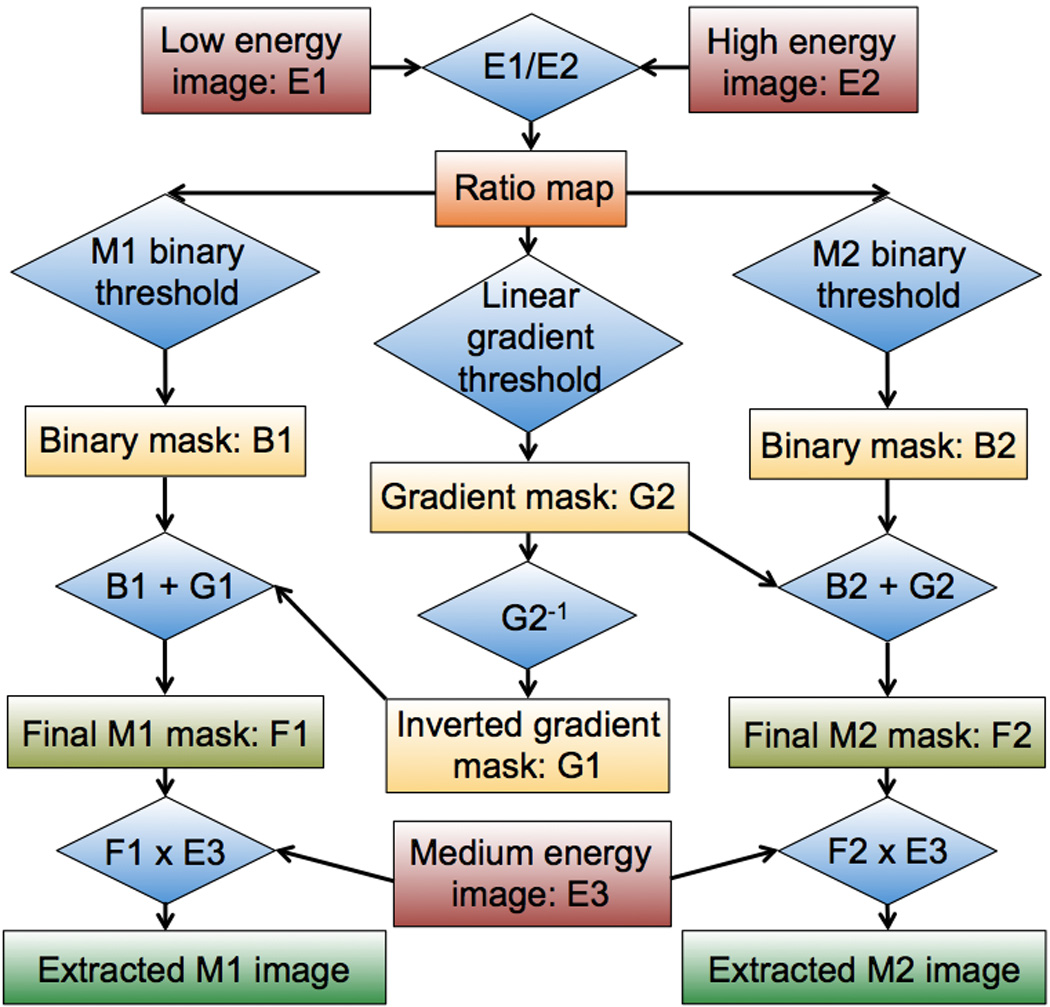
Flow diagram showing an overview of the CMEP. Rectangles denote image datasets while diamonds denote operations. B = binary, E = energy, M = material, G = gradient.
Figure 2.
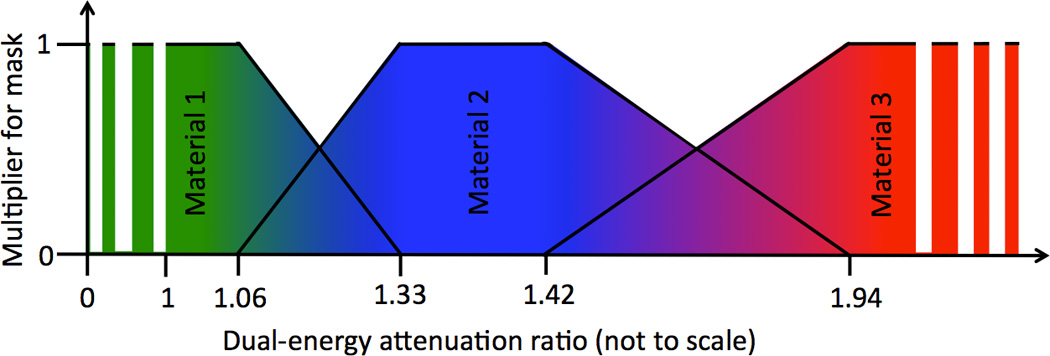
Schematic plot showing the three image masks required for a three material extraction process. The regions with a multiplier of 1 correspond to the binary masks, while the sloped regions correspond to the gradient masks (Fig. 1). The values used in this example correspond to tungsten (Material 1), calcium (Material 2) and iodine (Material 3) as determined from the calibration phantom at RSCT (Section 2.4). The intermittent extension of Materials 1 and 3 denote their continued extension to zero and infinity respectively.
Extension to three materials
The method may be extended to three materials, given the presence of a third positive contrast-producing material with a distinct dual-energy ratio. To achieve this, masks B3 and G4 are created from the same ratio map, and summed to produce F3. An inverted gradient mask (G3) for the upper region of M2 is also required, as shown in Figure 2.
Virtual non-contrast images and color-coding
Within Fiji, generation of virtual non-contrast images from the CMEP is also possible. A subtraction of one or more of the extracted images (M1, M2 etc.) from an original VMS image can be performed to generate a virtual unenhanced image. This is useful for instances where “background” material is contextually required, since the CMEP inherently generates images with zero-value “black” backgrounds. Likewise, any two or more contrast images can be summed to generate multiple contrast images. Material-specific images can also be color-coded. This is achieved first via conversion of the 32-bit image to 8-bit, and the subsequent application of a color-graded look-up-table (LUT). In this study we apply a simple red-green-blue (RGB) coding scheme to the three extracted materials (Fig. 2). Preset LUTs corresponding to common color-coding schemes such as a rainbow spectrum, or the “hot” LUTs used in commercial DECT or PET imaging are also available in Fiji.
Phantoms
To assess the performance of the CMEP and to provide calibration values for the animal study, a phantom experiment was conducted. A cylindrical, acrylic phantom measuring 210 mm in diameter and 140 mm in length was filled with water. 50 mL polyethylene vials were mounted within the phantom in a 4×3 matrix. Three contrast-producing materials were included; tungsten, iodine and calcium, details of which are provided in Table 1. Tungsten was chosen for it’s distinct dual-energy ratio compared to calcium and iodine (19) and because it has been identified as a candidate element for contrast agent development (15, 17, 19, 27). Iodine and tungsten were formulated to concentrations of 5, 10, 15 and 20 mg/mL of the active element, while calcium was formulated to 20, 30, 40 and 50% calcium nitrate by weight. These elements were mounted within the phantom in three configurations:
Iodine-Calcium: The pure contrast materials at the four different concentrations were placed in the top and bottom rows of the phantom. Mixtures of 20–80%, 40–60%, 60–40% and 80–20% iodine-calcium composition by weight were placed in the middle row. These were mixed from the original 10 mg/mL iodine and 30 wt% calcium nitrate solutions.
Tungsten-Calcium: The same configuration as the Iodine-Calcium, but using tungsten instead of iodine. The 10 mg/mL tungsten solution was used as the basis for the mixtures.
Iodine-Calcium-Tungsten: The four concentrations of the three contrast materials were placed in the three rows of the phantom without any mixtures.
Table 1.
Specification of the contrast elements
| Element | Compound used | Chemical Formula | Concentration range |
|---|---|---|---|
| Tungsten | Sodium tungstate dihydrate | Na2WO4 • 2H2O | 5 – 20 mg W/mL |
| Iodine | Iohexol | C19H26I3N3O9 | 5 – 20 mg I/mL |
| Calcium | Calcium nitrate | Ca(NO3)2 | 20 – 50 wt% Ca(NO3)2 |
An Iodine-Tungsten configuration was not evaluated as the very distinct dual-energy ratios of iodine and tungsten imply an easier separation task than the three configurations that were chosen.
CT Scanning
The phantom was scanned using both DSCT and RSCT. DSCT was performed with a Definition Flash (Siemens Healthcare, Forchheim, Germany), while RSCT employed a Discovery CT 750 HD (GE Healthcare). All scans were performed with dual-energy tube potentials of 80 and 140 kVp, with tin filtration of the 140 kVp source in the DSCT scans, subsequently denoted as Sn140 kVp. Further protocol details are provided in Table 2.
Table 2.
CT protocol definition for calibration phantom scanning
| Dual Source CT | Rapid kVp-switching CT | |
|---|---|---|
| Tube potentials | 80 kVp, Sn140 kVp | 80 kVp, 140 kVp |
| Pitch | 0.8:1 | Axial mode |
| Rotation time | 0.33 s | 0.7 s |
| Detector collimation (detector rows × detector width) |
19.2 mm (32 × 0.6 mm) | 40 mm (64 × 0.625 mm) |
| Reconstructed image datasets used as E1; E2; E3 |
80 kVp; Sn-140 kVp; 50/50 blend of 80-Sn140 |
60 keV, 80 keV, 70 keV |
| Reconstructed image thickness | 3 mm | 2.5 mm |
| Reconstruction kernel | B30f | Standard |
| Reconstructed FOV | 30 cm | 30 cm |
| Total CTDIvol | 8.9 mGy | 8.9 mGy |
Image analysis
In the E1/E2 ratio map, circular ROIs 19 mm in diameter were placed within each vial in 10 consecutive images from a single scan and the mean values taken. These values were then used to defined material thresholds for the CMEP. Following the CMEP, the same ROIs were used to analyze the material-specific images. To convert CT numbers to material concentrations in mg/mL the E3 images were used; a 50% blend of 80 and 140 kVp for DSCT and 70 keV for RSCT. Using the Iodine-Calcium-Tungsten phantom configuration, HU/mg/mL conversion factors were obtained from the 20 mg/mL vial for iodine and the 20 mg/mL vial for tungsten, and the 50wt% calcium nitrate vial for calcium. This implied a single conversion factor for each element and DECT type, for a total of six conversion factors (three for DSCT and three for RSCT). True material concentrations were assumed to correspond exactly to the ideal formulations (5–20 mg/mL for iodine and tungsten, 20–50wt% calcium nitrate). The weight percentages for calcium nitrate were converted to mg/mL of elemental calcium using its molecular weight, assuming an ideal solution. Error bars for the true material concentrations were approximated using the standard deviation of the CT number among the 10 measurements for each element in the 20 mg/mL vial, converted to mg/mL. Material concentrations were compared between the CMEP-converted values and the true concentrations. For each configuration and element, the maximum error between CMEP and true concentration was calculated for pure element and mixture vials. In the Iodine-Calcium-Tungsten configuration where no mixtures were present, the maximum false positive signal of each element among eight vials not containing the element was recorded.
Animals
To assess the CMEP in vivo, an animal study was conducted according to the protocol approved by our institutional animal care and use committee. One female New Zealand White rabbit (4.1 kg, Western Oregon Rabbit Co., Philomath, OR) was given 180 mL of an 8.7 mg W/mL aqueous tungsten solution (Na2WO4•2H2O, Sigma-Aldrich, St. Louis, MO) via gastric gavage using a 12-Fr feeding tube. 45 minutes elapsed before imaging to allow sufficient passage of the contrast medium into the small bowel. The rabbit was then anesthetized by intramuscular injection of 35 mg/kg ketamine (Ketaset, Fort Dodge Animal Health, Fort Dodge, Iowa) and 5 mg/kg xylazine hydrochloride (AnaSed, Lloyd Laboratories, Shenandoah, IA), and maintained under general anesthesia with 1–3% inhaled isofluorane (Attane, Piramal Critical Care, Bethlehem, PA). Intravenous iohexol (Omnipaque 350, GE Healthcare) at a dose of 600 mg I/kg was manually injected as a bolus via an auricular vein catheter 10 seconds prior to CT imaging. Animal model images were acquired in helical mode with a pitch of 0.984:1 using the same RSCT scanner as the phantom experiments. A GSI preset of 40 was used, which corresponds to a large bow-tie filter, a tube current of ∼360 mA, a collimation of 40 mm, a rotation time of 0.6 s and a CTDIvol of 12.1 mGy.
Results
Materials concentration conversion factors
At DSCT, using the 50% blend of the 80 and Sn140 kVp images, the conversion factors from HU to material concentrations were determined as 14.2, 1.8 and 25.7 HU/mg/mL for iodine, calcium and tungsten respectively. At RSCT, using the 70 keV image, the conversion factors were determined as 13.4, 1.7 and 25.9 HU/mg/mL for iodine, calcium and tungsten. The similar values observed for DSCT and RSCT reflect the suitability of using these DECT image types as the “E3” inputs for the CMEP. The comparatively low values for calcium reflects its lower x-ray attenuation in the diagnostic energy range, due to its lower atomic number.
Dual-energy ratio intervals
Dual-energy ratio intervals were determined from the E1/E2 ratio map values for DSCT (Table 3) and RSCT (Table 4). All five material types (the three pure materials and the two gradient regions between them) were found to have distinct dual-energy ratios with no overlapping regions at both DSCT and RSCT, which was encouraging for the CMEP application.
Table 3.
80:Sn140 kVp Dual Source CT dual-energy ratios for the three materials and two mixtures. The upper limit of the binary mask for tungsten (1.09) was chosen as the midpoint between the highest concentration tungsten ratio (1.05) and the minimum observed tungsten-calcium blend ratio (1.14). This approach was repeated for the other binary limits.
| Material | Contrast element concentrations | Ratio range for mask |
|||
|---|---|---|---|---|---|
| 5 mg/mL | 10 mg/mL | 15 mg/mL | 20 mg/mL | ||
| Pure tungsten | 1.06 | 1.06 | 1.05 | 1.05 | 0 – 1.09 |
| Pure iodine | 3.2 | 3.02 | 2.95 | 2.94 | 2.75 – ∞ |
| Calcium nitrate concentration by weight % | |||||
| 20% | 30% | 40% | 50% | ||
| Pure calcium | 1.54 | 1.54 | 1.56 | 1.57 | 1.51 – 1.69 |
| Tungsten or iodine solution in mixture by weight % | |||||
| 20% W/I | 40% W/I | 60% W/I | 80% W/I | ||
| Tungsten-Calcium mixture | 1.44 | 1.33 | 1.24 | 1.14 | 1.09 – 1.51 |
| Iodine-Calcium mixture | 1.78 | 1.99 | 2.2 | 2.6 | 1.69 – 2.75 |
Table 4.
60:80 keV Rapid kVp-Switching CT dual-energy ratios for the three materials and two mixtures.
| Material | Contrast element concentrations | Ratio range for mask |
|||
|---|---|---|---|---|---|
| 5 mg/mL | 10 mg/mL | 15 mg/mL | 20 mg/mL | ||
| Pure tungsten | 1.04 | 1.03 | 1.02 | 1.02 | 0 – 1.06 |
| Pure iodine | 2.02 | 2.05 | 2.05 | 2.01 | 1.94 – ∞ |
| Calcium nitrate concentration by weight % | |||||
| 20% | 30% | 40% | 50% | ||
| Pure calcium | 1.36 | 1.36 | 1.36 | 1.37 | 1.33 – 1.42 |
| Tungsten or iodine solution in mixture by weight % | |||||
| 20% W/I | 40% W/I | 60% W/I | 80% W/I | ||
| Tungsten-Calcium mixture | 1.3 | 1.23 | 1.16 | 1.1 | 1.06 – 1.33 |
| Iodine-Calcium mixture | 1.48 | 1.6 | 1.72 | 1.87 | 1.42 – 1.94 |
Iodine-Calcium extraction
The iodine-calcium contrast extraction was qualitatively successful for both DSCT (Fig. 3 A-C) and RSCT (Fig. 3 D-F). Minimal false-positive signal was observed in the iodine and calcium material-specific images (Fig. 3 B, C, E, F). The mixture vials correctly showed increasing amounts of the materials present. The extraction of the pure materials was also successful quantitatively, with almost all the original contrast signal retained in the extracted images (Fig. 4, 5). At DSCT (Fig. 4), the maximum error between extracted versus true iodine concentration was 0.7 mg/mL (in the 10 mg/mL vial) while for calcium it was 11.7 mg/mL (for the 30% vial). At RSCT (Fig. 5), the maximum error between extracted versus true iodine was again 0.7 mg/ml (for the 5 mg/mL vial) while for calcium it was 12.6 mg/ml (for the 30% vial). The mixtures showed lower fidelity; at DSCT the maximum percentage difference was 7.1 mg/ml for iodine (in the 80% iodine vial) and 11.5 mg/ml for calcium (in the 40% iodine vial) (Fig. 4). At RSCT, the maximum error in the mixtures was 7.4 mg/ml for iodine (in the 80% iodine vial) and 5.9 mg/ml for calcium (in the 80% iodine vial) (Fig. 5).
Figure 3.
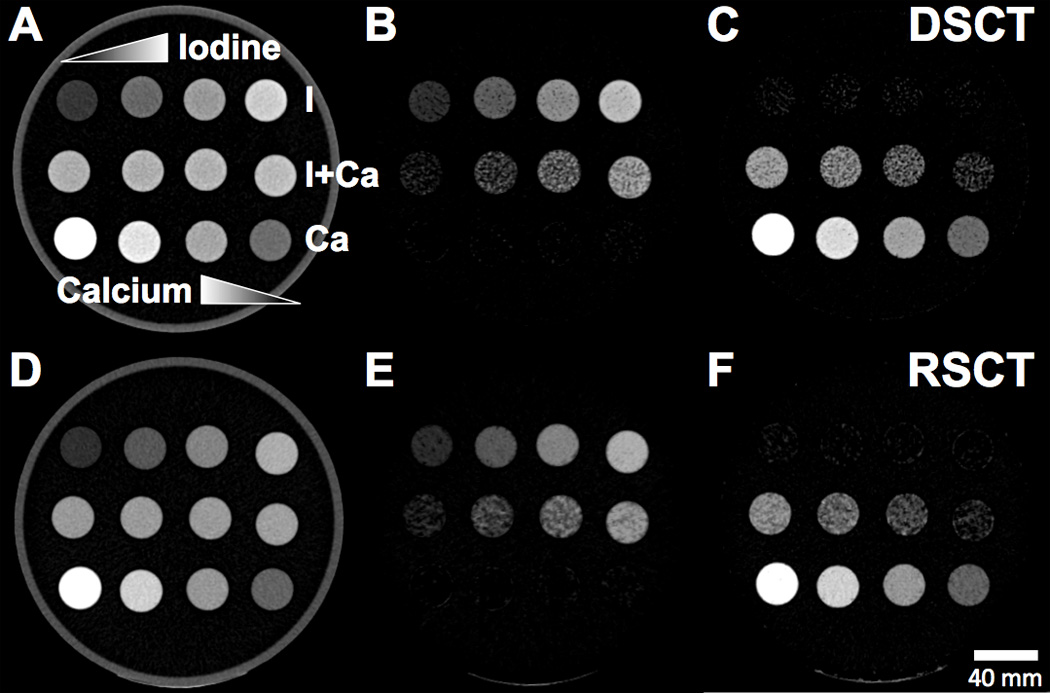
Axial CT images of the Iodine-Calcium-Mixtures phantom configuration.. Top rows of vials: Pure iodine solutions with increasing concentration left to right. Middle row of vials: Iodine-calcium mixture vials with increasing iodine concentration left to right. Bottom row of vials: Pure calcium solutions with increasing calcium concentration right to left. A) Unprocessed 80-Sn140 kVp blended image scanned at DSCT. B) Extracted iodine map from DSCT. C) Extracted calcium map from DSCT. D) Unprocessed 70 keV VMS image scanned at RSCT. E) Extracted iodine map from RSCT. F) Extracted calcium map from RSCT.
Figure 4.
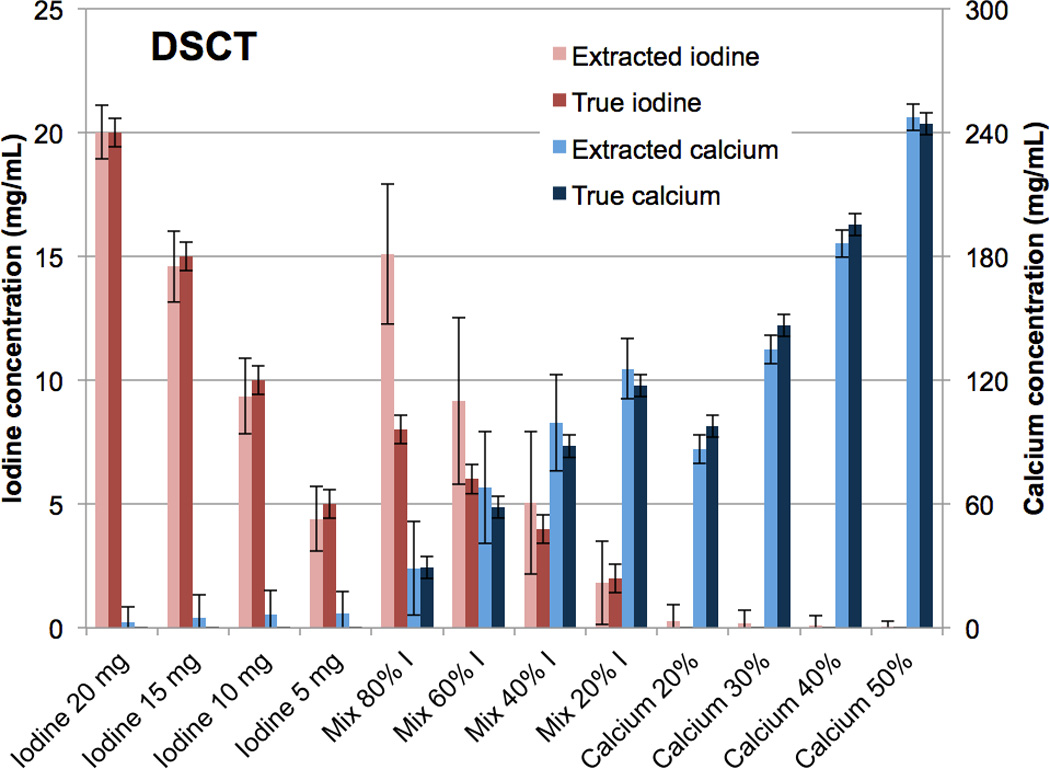
Bar chart showing the mean concentrations of the CMEP-extracted versus true iodine and calcium vials at Dual Source CT. Error bars represent +/− the standard deviation of the mean CT number among the 10 consecutive images.
Figure 5.
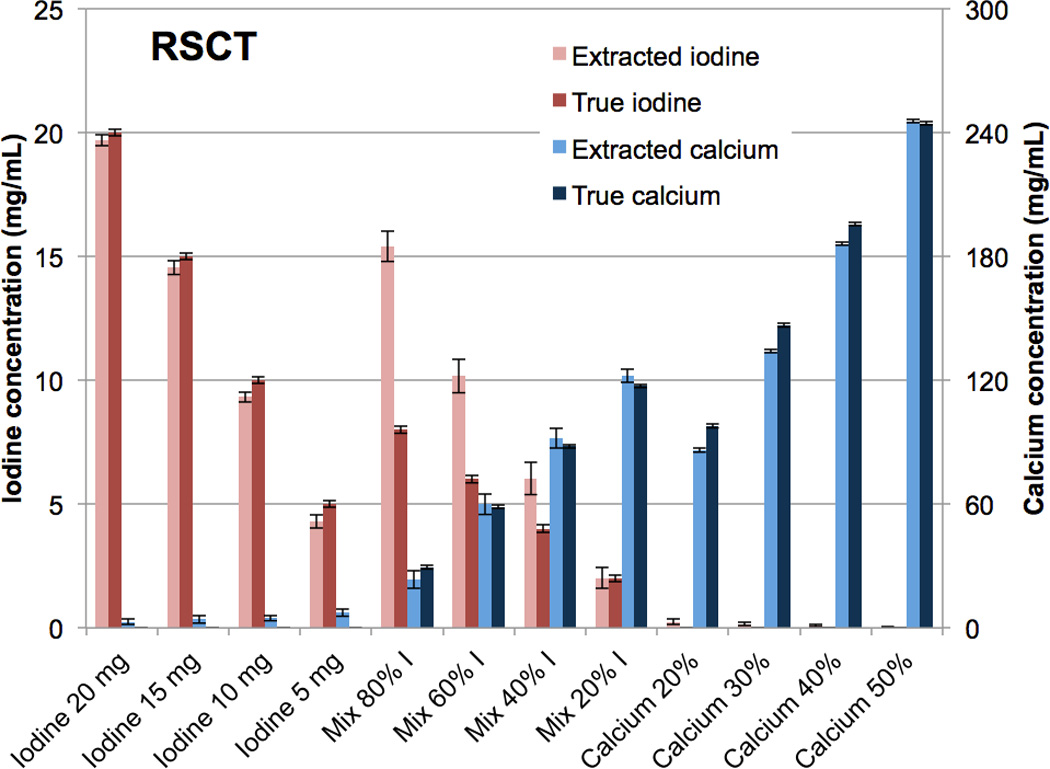
Bar chart showing the mean concentrations of the CMEP-extracted versus true iodine and calcium vials at rapid kVp-switching CT.
Tungsten-Calcium extraction
As with the iodine-calcium separation, the tungsten-calcium extraction was qualitatively successful (Fig. 6 B,C,E,F). Quantitatively, the results for the pure vials were similar to the iodine-calcium separation (Fig. 7, 8). At DSCT (Fig. 7), the maximum error for the extracted versus true tungsten concentration was 0.4 mg/mL (for the 15 mg/mL vial) while for calcium it was 20.9 mg/mL (for the 30% calcium vial). At RSCT (Fig. 8), the maximum error was 0.3 mg/mL (for the 15 mg/mL vial) for tungsten while for calcium it was 15.7 mg/mL (for the 30% calcium vial). The mixture vials again had lower accuracy compared to the pure materials, but showed an improved performance compared to the iodine-calcium mixture vials. At DSCT the maximum error for tungsten was 0.3 mg/mL (for the 60% tungsten vial) while for calcium it was 11.2 mg/mL (for the 40% tungsten vial). At RSCT, the maximum error in the mixtures for tungsten was 0.7 mg/mL (for the 40% tungsten vial) while for calcium it was 11 mg/mL (for the 80% tungsten vial).
Figure 6.
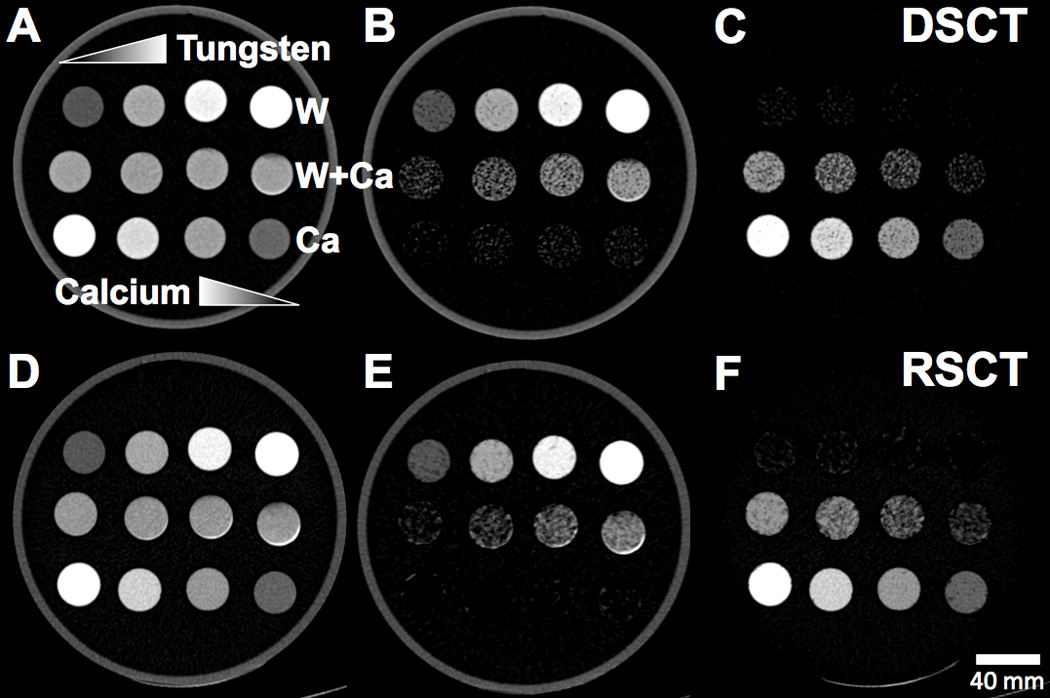
Axial CT images of the Tungsten-Calcium-Mixtures phantom configuration.. Top rows of vials: Pure tungsten solutions with increasing concentration left to right. Middle row of vials: Tungsten-calcium mixture vials with increasing tungsten concentration left to right. Bottom row of vials: Pure calcium solutions with increasing calcium concentration right to left. A) Unprocessed 80-Sn140 kVp blended image scanned at DSCT. B) Extracted tungsten map from DSCT. C) Extracted calcium map from DSCT. D) Unprocessed 70 keV VMS image scanned at RSCT. E) Extracted tungsten map from RSCT. F) Extracted calcium map from RSCT.
Figure 7.
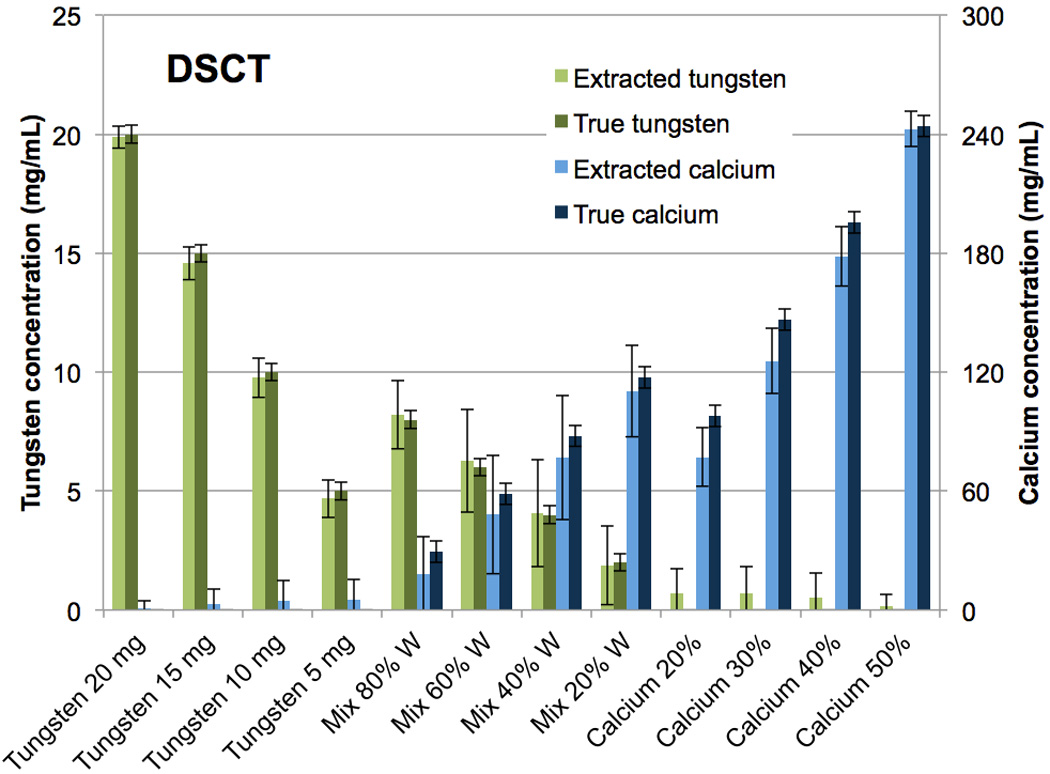
Bar chart showing the mean concentrations of the CMEP-extracted versus true tungsten and calcium vials at Dual-Source CT.
Figure 8.
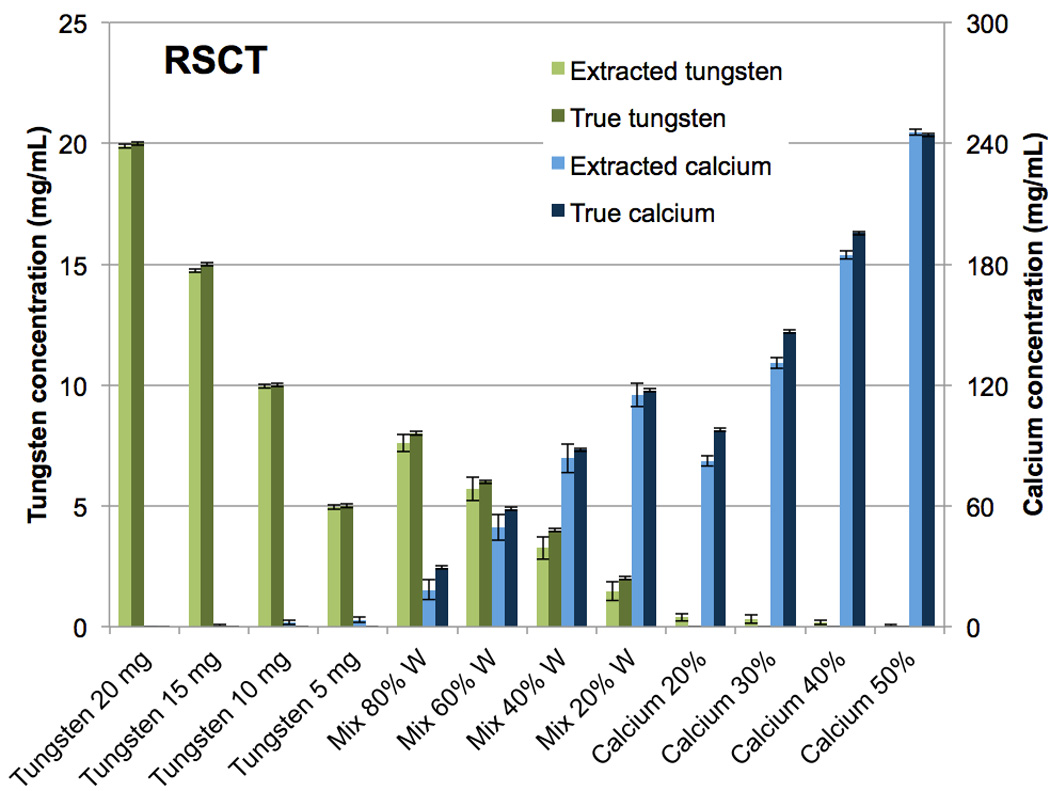
Bar chart showing the mean concentrations of the CMEP-extracted versus true tungsten and calcium vials at rapid kVp-switching CT.
Tungsten-Calcium-Iodine extraction
The tungsten-calcium-iodine extraction of pure formulations with no mixtures was successfully achieved (Fig. 9, 10). At DSCT (Fig. 9), the maximum error for the extracted versus true iodine was 0.9 mg/mL (for the 10 mg/mL vial). For calcium it was 24.9 mg/mL (for the 30% calcium vial) while for tungsten it was 0.4 mg/mL (for the 15 mg/mL vial). The highest observed iodine signal in a vial not containing iodine was 0.2 mg/mL (in the 20% calcium vial). The highest false positive signal for calcium was 7.3 mg/ml (in the 15 mg/mL tungsten vial) and for tungsten was 0.8 mg/mL (in the 30% calcium vial). At RSCT (Fig. 10) the maximum error for the extracted versus true iodine was 0.7 mg/mL (for the 10 mg/mL vial). For calcium it was 20.1 mg/mL (for the 30% calcium vial) while for tungsten it was 0.2 mg/mL (for the 15 mg/mL vial). Corresponding false positive signals were 0.3 mg/mL for iodine (for the 20% calcium vial), 7.4 mg/mL for calcium (for the 5 mg/mL iodine vial), and 0.4 mg/mL for tungsten (for the 30% calcium vial). The successful separation of the pure materials was also evident qualitatively in the CT images of the three-material phantom (Fig. 11). The color-coded extracted image shows minimal bleed from one material to another for both DSCT and RSCT. The acrylic phantom housing is displayed as tungsten because it is denser than water and has a low dual-energy ratio (i.e. little change in attenuation between low and high x-ray energies.)
Figure 9.
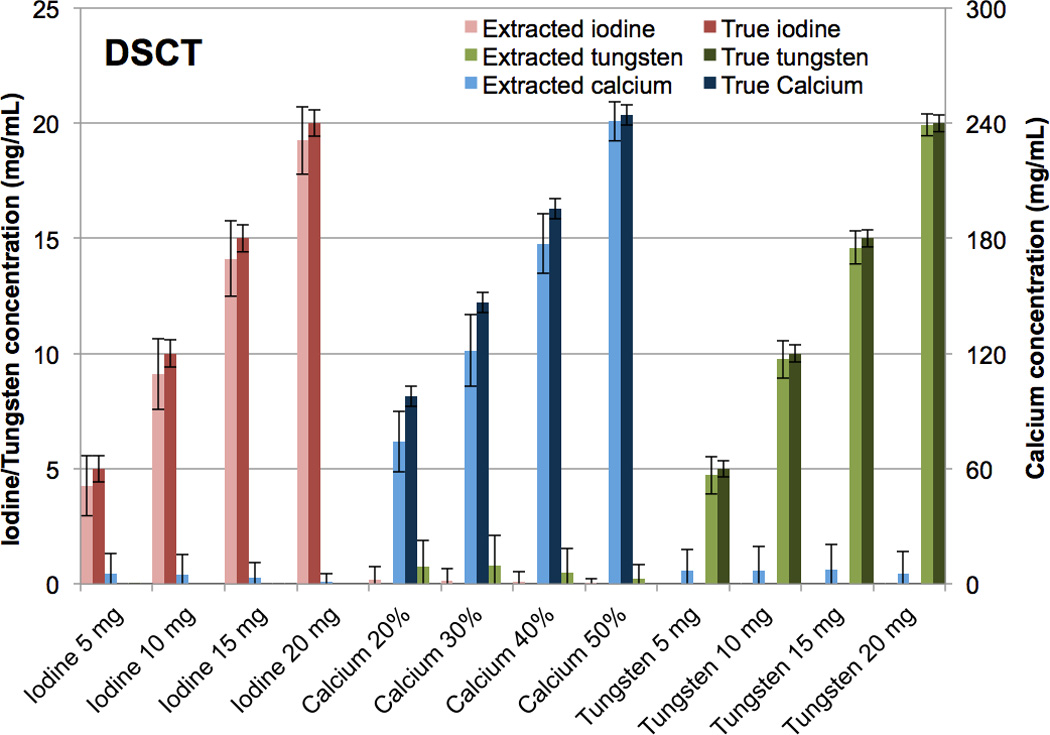
Bar chart showing the mean concentrations of the true versus CMEP-extracted CT numbers for pure tungsten, calcium and iodine vials at Dual Source CT.
Figure 10.
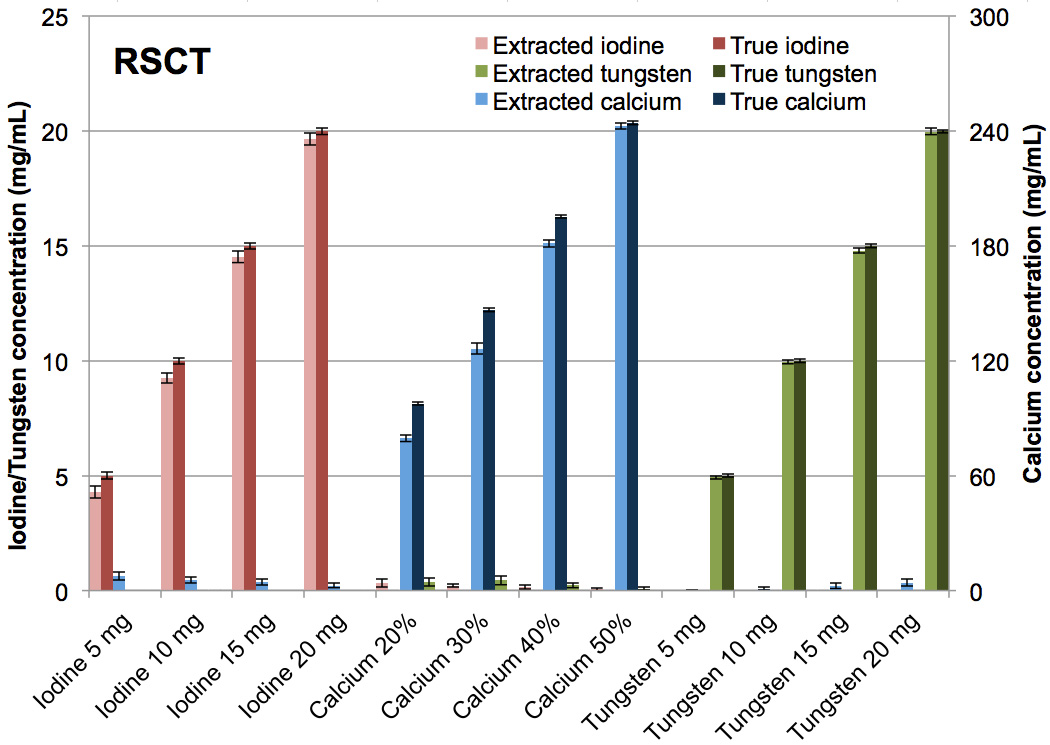
Bar chart showing the mean concentrations of the true versus CMEP-extracted CT numbers for pure tungsten, calcium and iodine vials at rapid kVp-switching CT.
Figure 11.
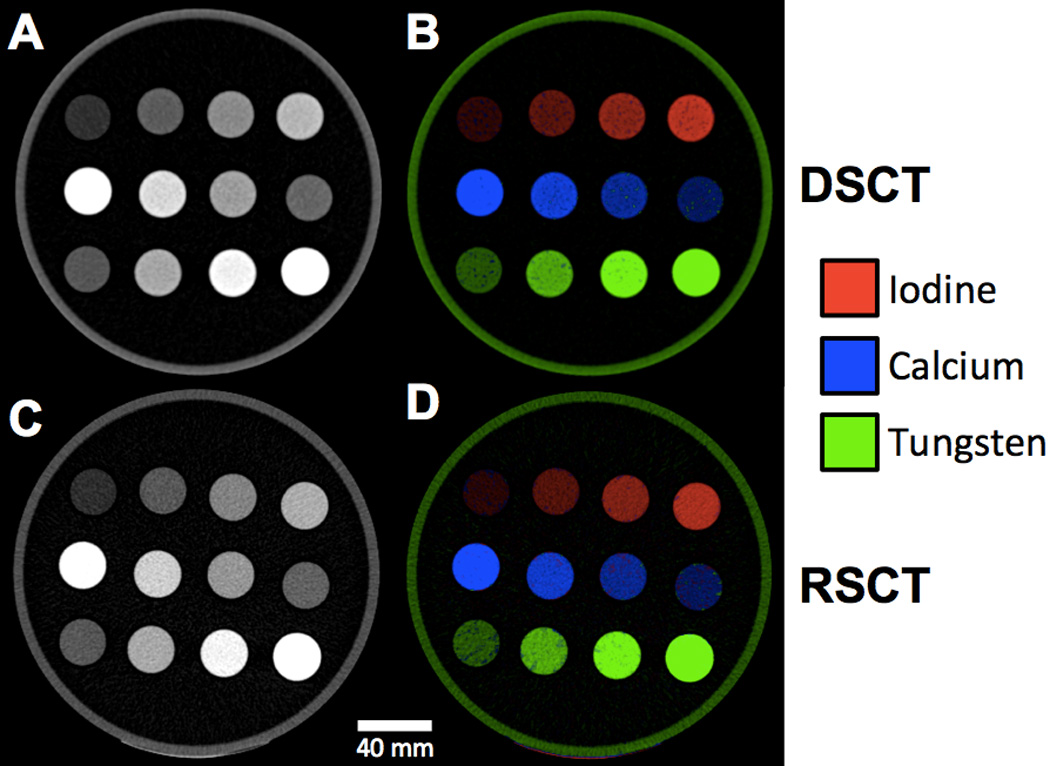
Axial CT images of the tungsten-calcium-iodine phantom configuration. Top row: Pure iodine solutions with increasing concentrations left to right. Middle row: Pure calcium solutions with increasing concentrations right to left. Bottom row: Pure tungsten solutions with increasing concentration left to right A) Unprocessed 80-Sn140 kVp blended image scanned at DSCT. B) Color-coded extracted material image from DSCT. C) Unprocessed 70 keV VMS image scanned at RSCT. D) Color-coded extracted image from RSCT.
Animal results
A CMEP identical to that used for the calibration phantom (Table 4) was applied to the rabbit model images (Fig. 12). The contrast materials were extracted successfully, although the fidelity of the material-specific images was not as high as the calibration phantom. False positive calcium signal in the extracted iodine image was the main limitation, particularly in the lower extremities (Fig. 12 E). Despite this false positive calcium, the vasculature was still readily depicted. Two unexpected contrast enhanced regions were observed. The first, at the base of the bladder and extracted solely as tungsten (Fig. 12 C), is thought to be silica deposits which occur in high concentrations in rabbit urine. The second was in the anterior small bowel, and was extracted solely as calcium (Fig. 12 D). Some rabbit food such as alfalfa has a high calcium content (28), and as such this is thought to be a dense lump of calcium-rich food.
Figure 12.
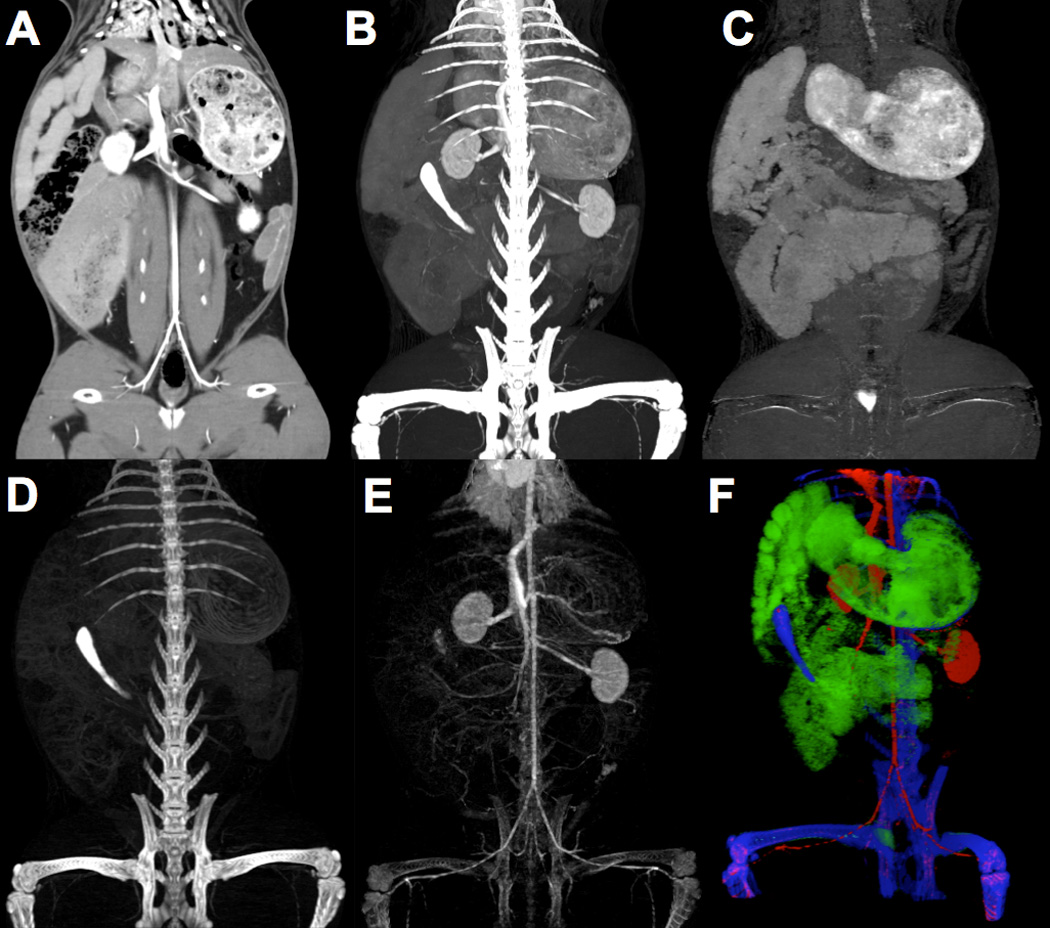
RSCT images of rabbit model with intravenous iodine and oral tungsten contrast materials. A) An unprocessed 70 keV VMS coronal image at the level of the inferior vena cava. B) Coronal Maximum Intensity Projection (MIP) showing the indistinguishably bright vascular contrast, oral contrast and bone. C) Coronal MIP of extracted tungsten delineating the stomach, small bowel and large bowel lumen. D) Extracted calcium MIP showing the skeleton and calcium-like small bowel material. E) Extracted iodine MIP showing the vasculature. F) Three-color, oblique coronal three-dimensional render of the extracted contrast materials showing iodine (red), calcium (blue) and tungsten (green).
Discussion
Our study presents an image-domain material separation method that directly utilizes dual-energy ratios, and can be adapted for use with dual-energy data from multiple vendors. The separation method, termed “Contrast Material Extraction Process” (CMEP), was shown to operate successfully for Dual-Source and rapid kVp-switching CT, both in phantoms and in vivo. Such a ratio-based method offers several advantages over conventional MD. First, as there is no volume or mass conservation assumption, the CMEP can be performed with the same setup for any number of contrast elements, provided they have distinct dual-energy ratios. Second, as materials are preferentially extracted, the approach is more conservative than the “either/or” nature of conventional MD. This decreases the prevalence of false-positive signal and also precludes negative concentrations of contrast elements. Finally, no a priori information, such as the materials’ elemental compositions or their corresponding attenuation coefficient profiles, is required. As such it can be directly applied to reconstructed DECT images.
The first major finding of our work was the high fidelity of the extraction in the formulations of the pure contrast materials: tungsten, calcium and iodine. This was due to the consistent dual-energy ratios of the different materials, which remained distinct from one another at different concentrations as noted previously (18). As a result, non-overlapping dual-energy ratio intervals were present for all five material combinations. Although the contrast elements in our study were selected to produce such distinct ratios, the CMEP is not limited to these elements. Several other high-Z elements that are candidates for novel contrast agents such as gold (29), hafnium (30), tantalum (13) and ytterbium (31) have dual-energy ratios similar to that of tungsten. Other elements, such as gadolinium, have ratios similar to that calcium (19), while others still, such as barium, have ratios similar to iodine (18). Many contrast combinations would therefore produce similar results to those shown here.
The second major finding of our work was that the CMEP was successful for the two most common DECT scanner types: DSCT and RSCT. Each DECT type has advantages and disadvantages regarding CMEP application. In DSCT, the actual 80 kVp and 140 kVp data are provided to the user, enabling direct generation of dual energy ratios and application of the process. A second advantage is the improved spectral separation provided by the tin-filtered 140 kVp source, increasing the dual energy ratio of iodine from ∼2 to ∼3, as noted previously (18, 20). A disadvantage is that the two datasets are uncoupled in terms of their noise properties, and noise is therefore amplified upon generation of the ratio map. The high noise of the ratio map propagates to the final material specific images, and can be observed by the modest-sized error bars of Figures 4, 7 and 9. This is a well-known problem for dual-energy imaging (22), and while various noise reduction techniques have been proposed (32, 33), evaluation of those techniques were beyond the scope of our proof-of-concept work. A second disadvantage with DSCT is the slightly lower temporal resolution due to the 90° offset of the two sources (34). As such the images may have imperfect registration, which was why we chose to perform the in vivo imaging using the rapid kVp-switching scanner. At RSCT, the VMS images already incorporate information from the two energy datasets, and thus image noise is much lower. This translates to low noise in the final material-specific images and can be observed by the small error bars of Figures 5, 8 and 10. A disadvantage is that the VMS images are themselves generated via a two-material decomposition of water and iodine, and therefore a convoluted path towards the final CMEP images is present (26).
The third major finding of our work was the successful translation of the CMEP in vivo. Using the same calibration parameters, tungsten, calcium and iodine were successfully extracted and correspondingly the bowel, skeleton and vasculature were visible in the material-specific images. There was some calcium bleed to the extracted iodine image, however this did not impede the depiction of the vasculature. Imperfect calcium iodine separation is also a known problem with conventional MD techniques (7, 35). Through optimization of the CMEP calibration parameters it is likely that this separation could be improved in the in vivo images, however we wished to demonstrate the robustness of the method using the same parameters derived from the phantom experiments. The addition and color-coding of the extraction images was readily achieved within the Fiji framework, and may help depict anatomy with greater confidence or conspicuity than possible with conventional greyscale images (17, 36). Two unexpected material regions were noted in the rabbit. Although their exact composition remained unknown, their extraction as particular material types enabled informed guesses as to their nature, highlighting the utility of this technique.
There are several limitations inherent to the CMEP. First, the technique is dependent on the intensity of contrast enhancement of the materials in the original DECT images relative to water. Larger errors may therefore be present when separating low intensity contrast signals (i.e. <50 HU). Although the theoretical dual-energy ratio should not lose fidelity at these low contrast levels, the contrast-to-noise ratio will be lower, which will reduce the image quality of the ratio map and subsequent masks. Second, due to the gradient mask approach, extraction properties of the different materials are inter-dependent. As demonstrated in Figure 2, the two gradient regions for Material 2 are dependent on the dual-energy ratios of Materials 1 and 3. For instance, if Material 3 were to have a dual-energy ratio of 1.8 rather than 2, the gradient region would be steepened and less material would be assigned as calcium. However, conventional MD, which forces CT numbers to be assigned to one or another material based on mass or volume conservation, are highly material inter-dependent. For the CMEP, unlike MD, the binary intervals that correspond to pure materials remain independent of the other materials chosen for extraction. Probabilistic definition of the regions between known ratio values has been proposed as an alternative to the gradient regions (22), however these preclude the existence of multiple materials within a given voxel. A final limitation is the CT number dependency of the final extracted images on the E3 image chosen. Such a dependency was evident in the current study, with an over-estimation of the iodine content in the iodine-calcium mixtures at both DSCT and RSCT. This was because at the E3 levels chosen, an 80-Sn140 kVp blend for DSCT and a 70 keV VMS level for RSCT, calcium produces a larger proportion of contrast compared to iodine. To account for this, the CMEP could be refined with selection of a lower energy blended image for E3. This would result in a higher iodine contrast relative to calcium, and accordingly the E3 image could be tailored so that equal mixture proportions provide equal contrast in the extracted images. For simplicity in this pilot study, the same E3 levels were used for the contrast extraction throughout. An alternative, if keeping the equal 80-Sn140 kVp blend and 70 keV VMS level were desirable, would be to use non-linear gradient regions for the iodine and calcium masks.
Several limitations were also explicit to our study design. First, we did not compare the CMEP to conventional MD techniques. However, generation of the tungsten, or indeed any high-Z decomposition images is precluded at RSCT as the commercial software is limited to materials that do not have a k-edge between 40 and 140 keV (15, 17). Furthermore both RSCT and DSCT software are unable to generate three separate material-specific images; both are limited to two materials. This would have precluded a meaningful comparison for the three-material phantom configuration. Second, the assumption of nominal concentrations was made for the true vial comparisons (5 mg/mL, 10 mg/mL etc.). Actual concentrations in the vials may have differed slightly from these nominal values. Third, as the conversion factors from HU to mg/mL were obtained from the E3 image, which itself was used for the CMEP, a dependency exists between the two. This dependency was minimized by using as few conversion factors as possible, with single HU/mg/mL factors derived per element per scanner-type. Finally, only one animal was used for this pilot study. Statistical power for in vivo image quality evaluation was therefore not met, however we expect similar separation properties in further experiments.
In conclusion, we believe the contrast material extraction process described here presents a robust and flexible, yet conservative approach to material-specific dual-energy imaging. It may be easily understood and readily applied on data from multiple DECT platforms due to the straightforward paradigm and implementation using freeware. We believe the CMEP has particular value for the extraction of experimental high-Z contrast elements, which is currently precluded with commercial material decomposition software, and for associated future phantom and pre-clinical research studies, where exact attenuation coefficient profiles of desired contrast-producing materials may be unknown.
Acknowledgments
Funding sources:
NIH, National Institute of Biomedical Imaging and Bioengineering (NIBIB): R01EB015476
NIH, National Institute of Biomedical Imaging and Bioengineering (NIBIB): 1R41DK104580
NIH, National Center for Advancing Translational Sciences (NCATS): UL1 TR000004
Research reported in this publication was supported by the National Institute of Biomedical Imaging and Bioengineering, National Institutes of Health under Award Numbers R01EB015476 and 1R41DK104580 and also by the National Center for Advancing Translational Sciences, National Institutes of Health, through UCSF-CTSI Grant Number UL1 TR000004. The content is solely the responsibility of the authors and does not necessarily represent the official views of the National Institutes of Health.
References
- 1.Goodsitt MM, Christodoulou EG, Larson SC. Accuracies of the synthesized monochromatic CT numbers and effective atomic numbers obtained with a rapid kVp switching dual energy CT scanner. Medical physics. 2011;38(4):2222–2232. doi: 10.1118/1.3567509. [DOI] [PubMed] [Google Scholar]
- 2.Petersilka M, Bruder H, Krauss B, et al. Technical principles of dual source CT. Eur. J. Radiol. 2008;68(3):362–368. doi: 10.1016/j.ejrad.2008.08.013. [DOI] [PubMed] [Google Scholar]
- 3.Krauss B, Schmidt B, Flohr TG. Dual Source CT. In: Johnson T, Fink C, Schönberg SO, Reiser MF, editors. Dual energy CT in clinical practice: Springer Science & Business Media. 2011. [Google Scholar]
- 4.Johnson TR, Krauss B, Sedlmair M, et al. Material differentiation by dual energy CT: initial experience. Eur. Radiol. 2007;17(6):1510–1517. doi: 10.1007/s00330-006-0517-6. [DOI] [PubMed] [Google Scholar]
- 5.Mendonca PR, Lamb P, Sahani DV. A Flexible Method for Multi-Material Decomposition of Dual-Energy CT Images. IEEE Trans. Med. Imaging. 2014;33(1):99–116. doi: 10.1109/TMI.2013.2281719. [DOI] [PubMed] [Google Scholar]
- 6.Liu X, Yu L, Primak AN, McCollough CH. Quantitative imaging of element composition and mass fraction using dual-energy CT: three-material decomposition. Med Phys. 2009;36(5):1602–1609. doi: 10.1118/1.3097632. [DOI] [PMC free article] [PubMed] [Google Scholar]
- 7.Tran DN, Straka M, Roos JE, et al. Dual-energy CT discrimination of iodine and calcium: experimental results and implications for lower extremity CT angiography. Acad. Radiol. 2009;16(2):160–171. doi: 10.1016/j.acra.2008.09.004. [DOI] [PubMed] [Google Scholar]
- 8.Niu T, Dong X, Petrongolo M, Zhu L. Iterative image-domain decomposition for dual-energy CT. Med Phys. 2014;41(4):041901. doi: 10.1118/1.4866386. [DOI] [PubMed] [Google Scholar]
- 9.Long Y, Fessler JA. Multi-material decomposition using statistical image reconstruction for spectral CT. IEEE Trans. Med. Imaging. 2014;33(8):1614–1626. doi: 10.1109/TMI.2014.2320284. [DOI] [PMC free article] [PubMed] [Google Scholar]
- 10.Wait JM, Cody D, Jones AK, et al. Performance Evaluation of Material Decomposition With Rapid-Kilovoltage-Switching Dual-Energy CT and Implications for Assessing Bone Mineral Density. Am J Roetgenol. 2015;204(6):1234–1241. doi: 10.2214/AJR.14.13093. [DOI] [PubMed] [Google Scholar]
- 11.Feuerlein S, Heye TJ, Bashir MR, Boll DT. Iodine quantification using dual-energy multidetector computed tomography imaging: phantom study assessing the impact of iterative reconstruction schemes and patient habitus on accuracy. Invest. Radiol. 2012;47(11):656–661. doi: 10.1097/RLI.0b013e31826585bb. [DOI] [PubMed] [Google Scholar]
- 12.Fuchs TA, Stehli J, Dougoud S, et al. Coronary artery calcium quantification from contrast enhanced CT using gemstone spectral imaging and material decomposition. Int. J. Cardiovasc. Imaging. 2014;30(7):1399–1405. doi: 10.1007/s10554-014-0474-0. [DOI] [PubMed] [Google Scholar]
- 13.FitzGerald PF, Butts MD, Roberts JC, et al. A Proposed Computed Tomography Contrast Agent Using Carboxybetaine Zwitterionic Tantalum Oxide Nanoparticles: Imaging, Biological, and Physicochemical Performance. Invest. Radiol. 2016 doi: 10.1097/RLI.0000000000000279. [DOI] [PMC free article] [PubMed] [Google Scholar]
- 14.Liu Y, Ai K, Liu J, et al. A high-performance ytterbium-based nanoparticulate contrast agent for in vivo X-ray computed tomography imaging. Angew. Chem. Int. Ed. Engl. 2012;51(6):1437–1442. doi: 10.1002/anie.201106686. [DOI] [PubMed] [Google Scholar]
- 15.Rathnayake S, Mongan J, Torres AS, et al. In vivo comparison of tantalum, tungsten, and bismuth enteric contrast agents to complement intravenous iodine for double-contrast dual-energy CT of the bowel. Contrast Media Mol Imaging. 2016;11(4):254–261. doi: 10.1002/cmmi.1687. [DOI] [PMC free article] [PubMed] [Google Scholar]
- 16.Yeh BM, FitzGerald PF, Edic PM, et al. Opportunities for new CT contrast agents to maximize the diagnostic potential of emerging spectral CT technologies. Adv Drug Deliv Rev. 2016 doi: 10.1016/j.addr.2016.09.001. (In Press) [DOI] [PMC free article] [PubMed] [Google Scholar]
- 17.Mongan J, Rathnayake S, Fu Y, et al. In vivo differentiation of complementary contrast media at dual-energy CT. Radiology. 2012;265(1):267–272. doi: 10.1148/radiol.12120692. [DOI] [PMC free article] [PubMed] [Google Scholar]
- 18.Gabbai M, Leichter I, Mahgerefteh S, Sosna J. Spectral material characterization with dual-energy CT: comparison of commercial and investigative technologies in phantoms. Acta Radiol. 2015;56(8):960–969. doi: 10.1177/0284185114545150. [DOI] [PubMed] [Google Scholar]
- 19.Falt T, Soderberg M, Wasselius J, Leander P. Material Decomposition in Dual-Energy Computed Tomography Separates High-Z Elements From Iodine, Identifying Potential Contrast Media Tailored for Dual Contrast Medium Examinations. J. Comput. Assist. Tomogr. 2015;39(6):975–980. doi: 10.1097/RCT.0000000000000298. [DOI] [PubMed] [Google Scholar]
- 20.Primak AN, Ramirez Giraldo JC, Liu X, et al. Improved dual-energy material discrimination for dual-source CT by means of additional spectral filtration. Med. Phys. 2009;36(4):1359–1369. doi: 10.1118/1.3083567. [DOI] [PMC free article] [PubMed] [Google Scholar]
- 21.Krauss B, Grant KL, Schmidt BT, Flohr TG. The importance of spectral separation: an assessment of dual-energy spectral separation for quantitative ability and dose efficiency. Invest. Radiol. 2015;50(2):114–118. doi: 10.1097/RLI.0000000000000109. [DOI] [PubMed] [Google Scholar]
- 22.Vlassenbroek A. Dual Layer CT. In: Johnson RC, Fink C, Schonberg SO, Reiser MF, editors. Dual energy CT in clinical practice. 2011. pp. 21–34. [Google Scholar]
- 23.Morhard D, Fink C, Graser A, et al. Cervical and cranial computed tomographic angiography with automated bone removal: dual energy computed tomography versus standard computed tomography. Invest. Radiol. 2009;44(5):293–297. doi: 10.1097/RLI.0b013e31819b6fba. [DOI] [PubMed] [Google Scholar]
- 24.Hidas G, Eliahou R, Duvdevani M, et al. Determination of renal stone composition with dual-energy CT: in vivo analysis and comparison with x-ray diffraction. Radiology. 2010;257(2):394–401. doi: 10.1148/radiol.10100249. [DOI] [PubMed] [Google Scholar]
- 25.Schindelin J, Arganda-Carreras I, Frise E, et al. Fiji: an open-source platform for biological-image analysis. Nature methods. 2012;9(7):676–682. doi: 10.1038/nmeth.2019. [DOI] [PMC free article] [PubMed] [Google Scholar]
- 26.Wu X, Langan DA, Xu D, et al. Monochromatic CT image representation via fast switching dual kVp. Proc. SPIE 7258, Medical Imaging: Physics of Medical Imaging, 725845. 2009:725845–725849. (March 13, 2009) [Google Scholar]
- 27.Nowak T, Hupfer M, Brauweiler R, et al. Potential of high-Z contrast agents in clinical contrast-enhanced computed tomography. Med Phys. 2011;38(12):6469–6482. doi: 10.1118/1.3658738. [DOI] [PubMed] [Google Scholar]
- 28.Cheeke PR. Nutrition and nutritional diseases. The biology of the laboratory rabbit. 1994;2:321–323. [Google Scholar]
- 29.Hainfeld J, Slatkin D, Focella T, Smilowitz H. Gold nanoparticles: a new X-ray contrast agent. Br. J. Radiol. 2014;79(939):248–253. doi: 10.1259/bjr/13169882. [DOI] [PubMed] [Google Scholar]
- 30.Roessler AC, Hupfer M, Kolditz D, et al. High Atomic Number Contrast Media Offer Potential for Radiation Dose Reduction in Contrast-Enhanced Computed Tomography. Invest. Radiol. 2016;51(4):249–254. doi: 10.1097/RLI.0000000000000232. [DOI] [PubMed] [Google Scholar]
- 31.Liu Y, Liu J, Ai K, et al. Recent advances in ytterbium-based contrast agents for in vivo X-ray computed tomography imaging: promises and prospects. Contrast media & molecular imaging. 2014;9(1):26–36. doi: 10.1002/cmmi.1537. [DOI] [PubMed] [Google Scholar]
- 32.Warp RJ, Dobbins JT., 3rd Quantitative evaluation of noise reduction strategies in dual-energy imaging. Med. Phys. 2003;30(2):190–198. doi: 10.1118/1.1538232. [DOI] [PubMed] [Google Scholar]
- 33.Leng S, Yu L, Fletcher JG, McCollough CH. Maximizing iodine contrast-to-noise ratios in abdominal CT imaging through use of energy domain noise reduction and virtual monoenergetic dual-energy CT. Radiology. 2015;276(2):562–570. doi: 10.1148/radiol.2015140857. [DOI] [PMC free article] [PubMed] [Google Scholar]
- 34.Marin D, Boll DT, Mileto A, Nelson RC. State of the art: dual-energy CT of the abdomen. Radiology. 2014;271(2):327–342. doi: 10.1148/radiol.14131480. [DOI] [PubMed] [Google Scholar]
- 35.Kaemmerer N, Brand M, Hammon M, et al. Dual-Energy Computed Tomography Angiography of the Head and Neck With Single-Source Computed Tomography: A New Technical (Split Filter) Approach for Bone Removal. Invest. Radiol. 2016;51(10):618–623. doi: 10.1097/RLI.0000000000000290. [DOI] [PubMed] [Google Scholar]
- 36.Mongan J, Rathnayake S, Fu Y, et al. Extravasated Contrast Material in Penetrating Abdominopelvic Trauma: Dual-Contrast Dual-Energy CT for Improved Diagnosis—Preliminary Results in an Animal Model. Radiology. 2013;268(3):738–742. doi: 10.1148/radiol.13121267. [DOI] [PMC free article] [PubMed] [Google Scholar]


