

Abstract
Insulin signaling is coordinated by insulin receptor substrates (IRSs). Many insulin responses, especially for blood glucose metabolism, are mediated primarily through Irs-1 and Irs-2. Irs-1 knockout mice show growth retardation and insulin signaling defects, which can be compensated by other IRSs in vivo; however, the underlying mechanism is not clear. Here, we presented an Irs-1 truncated mutated mouse (Irs-1−/−) with growth retardation and subcutaneous adipocyte atrophy. Irs-1−/− mice exhibited mild insulin resistance, as demonstrated by the insulin tolerance test. Phosphatidylinositol 3-kinase (PI3K) activity and phosphorylated Protein Kinase B (PKB/AKT) expression were elevated in liver, skeletal muscle, and subcutaneous adipocytes in Irs-1 deficiency. In addition, the expression of IRS-2 and its phosphorylated version were clearly elevated in liver and skeletal muscle. With miRNA microarray analysis, we found miR-33 was down-regulated in bone marrow stromal cells (BMSCs) of Irs-1−/− mice, while its target gene Irs-2 was up-regulated in vitro studies. In addition, miR-33 was down-regulated in the presence of Irs-1 and which was up-regulated in fasting status. What’s more, miR-33 restored its expression in re-feeding status. Meanwhile, miR-33 levels decreased and Irs-2 levels increased in liver, skeletal muscle, and subcutaneous adipocytes of Irs-1−/− mice. In primary cultured liver cells transfected with an miR-33 inhibitor, the expression of IRS-2, PI3K, and phosphorylated-AKT (p-AKT) increased while the opposite results were observed in the presence of an miR-33 mimic. Therefore, decreased miR-33 levels can up-regulate IRS-2 expression, which appears to compensate for the defects of the insulin signaling pathway in Irs-1 deficient mice.
Keywords: insulin signaling pathway, IRS-1, IRS-2, miR-33
INTRODUCTION
The insulin signaling pathway is a complex network that regulates a series of metabolic processes in a tissue-specific manner (Zhang and Liu, 2014). Insulin suppresses glucose production and increases glycogen synthesis in liver (Rui, 2014); promotes glucose and fatty acid uptake in skeletal muscle (Blaak, 2005); inhibits lipolysis and stimulates lipid biosynthesis in adipose tissues (Newsholme and Dimitriadis, 2001); and positively regulates insulin secretion and β-cell function (Kubota et al., 2004; Leibiger et al., 2008). It has been reported that any defects in the insulin signaling pathway will lead to hyperglycemia and insulin resistance (Kadowaki, 2000), which are important pathophysiological features of a pre-diabetic state (Benito, 2011).
Insulin signaling is coordinated by counter-regulatory signaling through tyrosine phosphorylation of insulin receptor substrates (IRSs) (White, 2003). Although the role of each of these substrates merits attention, researches had revealed that many insulin responses, especially for blood glucose metabolism and bone metabolism, are mediated largely through Irs-1 and Irs-2 (Bu et al., 2010; Kido et al., 2000). Gene knockout (KO) mice models have been used to elucidate the role of Irs-1 and Irs-2 in controlling growth and nutrient homeostasis (Guo, 2013). For example, the β-cell mass in Irs-2 KO mice was reduced compared with wild type mice (Withers et al., 1998). Irs-2 KO mice also displayed metabolic defects in liver, muscle, and adipose tissues, and later developed diabetes secondary to pancreatic β-cell failure (Withers et al., 1998). Moreover, deletion of Irs-1 resulted in severe growth retardation and mild peripheral insulin resistance, which mainly occurred in skeletal muscle (Withers et al., 1998). However, the β-cell mass in Irs-1 KO mice was almost double that of the wild type mice (Withers et al., 1998). Therefore, it appears that Irs-1 null mice can avoid developing diabetes because of the Irs-2 dependent pancreatic β-cell growth and compensatory insulin secretion (Araki et al., 1994), however, the underlying mechanism is not clear.
MicroRNAs (miRNAs) are a class of small non-coding RNAs consisting of 20–23 nucleotides that regulate gene expression (Cheng et al., 2015; Giudice et al., 2016). They cause translational repression or transcriptional degradation by binding to complementary sites in their 3′ untranslated region (3′ UTR) of target mRNAs (Berindan-Neagoe et al., 2014; Rebustini et al., 2016). miRNAs play key roles in regulating several metabolic processes in pancreatic β-cells, such as insulin biosynthesis, insulin secretion, and β-cell survival (Guay and Regazzi, 2015; Mao et al., 2013). In addition, miRNAs lead dominant roles in cellular differentiation, proliferation, apoptosis, cholesterol biosynthesis, and cancer development (Fernandez-Hernando et al., 2013). It has been reported that miR-33a/b contributes to the regulation of fatty acid metabolism and insulin signaling (Davalos et al., 2011), and miR-503 inhibits adipogenesis through classical insulin signal of PI3K/AKT by targeting bone morphogenetic protein receptor 1a (Man et al., 2016).
To test the hypothesis that there was other IRSs compensating for the defects of insulin signaling pathway because of Irs-1 deficiency, we conducted a series of in vivo and in vitro experiments and identified that miR-33 was notably down-regulated and Irs-2 was significantly up-regulated in Irs-1−/− mice, and found that miR-33 bound to and regulated Irs-2 expression, which compensated for the defects of the insulin signaling pathway in Irs-1 deficient mice.
MATERIALS AND METHODS
Animals and metabolic analysis
Protocols for mouse experiments were approved by the Animal Ethics Committee of Central South University. Three-month-old Irs-1 spontaneous truncated mutation heterozygous mice (Jackson Laboratory, stock number: 007240) were mated to produce homozygous mice. All mice were maintained on a 12:12-h light-dark cycle and housed at the Animal Experiment Center at the Second Xiangya Hospital of Central South University.
Body weights of the wild type (Irs-1+/+), heterozygous (Irs-1+/−), and homozygous (Irs-1−/−) mice were measured from 1 to 12 weeks of age. Fasting blood glucose (FBG) levels of the three mouse genotypes were determined using tail blood samples and a glucometer (Roche, Germany). Blood was obtained from the tail vein in the fasting state (starved for 8 hours) for the insulin tolerance test (ITT). After weighing the body mass of the mice, insulin (0.08 U/ml) at a final amount of 0.016–0.02 U was intraperitoneal injected to each mouse by 1 ml syringe, the blood glucose was detected after 0 min, 5 min, 10 min, 15 min, 30 min, and 60 min of injection. In order to know serum Insulin-like Growth Factor 1 (IGF-1) levels in Irs-1−/− mice, we use mouse IGF-1 Elisa kit (Cusabio, China) to detect the IGF-1 levels according to the manufacturer’s instruction.
Fasting and Re-feeding for mouse
In order to clearly get know of the relationship between miR-33 and insulin signaling pathway, we constructed fasting and re-feeding wild-type mouse models. In fasting mice group, mice (n = 3) were fasted and then re-fed, after 24 h of fasting, we re-fed these mice for another 24 h (n = 3). All the mice were sacrificed and the subcutaneous fat were isolated for RT-PCR analysis.
Immunohistochemistry
Liver, skeletal muscle, and subcutaneous adipose tissue of Irs-1+/+, Irs-1+/−, and Irs-1−/− mice (n = 3 mice per genotype) at 4 weeks of age were fixed overnight in 10% formalin, prior to paraffin embedding and sectioning. After deparaffinating, the tissue on the slides were stained for IRS-2 and p-IRS-2 (Santa Cruz Biotechnology, USA) overnight at 4°C. The next day, all procedures were performed by using the GTVisionTM II Detection System/Mo&Rb (Gene Tech, China), according to manufacturer’s instruction. The microscope images were assessed using Image-Pro Plus 6.0 software, and the mean integrated optical density (IOD) of each photograph was collected. Mean IOD was referred to the average level of positive tissues.
PI3-kinase activity
PI3K activity was determined using a commercially available kit (Echelon Biosciences, USA). The liver, skeletal muscle, and subcutaneous adipose tissue of Irs-1+/+, Irs-1+/−, and Irs-1−/− mice (aged 1 month) were washed in ice-cold PBS and lysed in 500 μl ice-cold lysis buffer [137 mmol l−1 NaCl, 20 mmol l−1 Tris-HCl (pH 7.4), 1 mmol l−1 CaCl2, 1 mmol l−1 MgCl2, 0.1 mmol l−1 sodium orthovanadate, 1% NP-40, and 1 mmol l−1 phenylmethylsulfonyl fluoride] before immunoprecipitation. As to direct assessment of PI3K activity, PI3K was separated by immunoprecipitation with an anti-PI3K antibody (Cell Signaling) to the p85 adapter subunit, and the ability of the co-precipitated catalytic p110 catalytic subunit to convert a standard PIP2 to PIP3 in a kinase reaction was estimated by measuring the creating PIP3 through the ELISA kit. Each result was repeated for three times.
Western blot analysis
Transfected primary liver cells of wild type mice, as well as liver and skeletal muscle tissues of Irs-1+/+, Irs-1+/−, and Irs-1−/− mice were homogenized in homogenization buffer. Western blot analysis of insulin signaling proteins was performed as normally described by using 40 μg of each sample. Then each sample was separated by sodium dodecyl sulfate-polyacrylamide gel electrophoresis (SDS-PAGE), and transferred to polyvinylidene fluoride (PVDF) membranes (EMD Millipore Corporation, USA). The membranes were incubated with specific antibodies to IRS-1 (Cell Signaling Technology, USA), IRS-2, phosphorylated tyrosine (pTyr)-IRS-1, p-IRS-2 (USA), PI3K p85 antibody, AKT, p-AKT (Thr308) (Cell Signaling), β-actin (Abcam), or GAPDH (Santa Cruz), and then incubated with appropriate HRP-conjugated secondary antibodies. Blots were developed using an ECL Kit (Santa Cruz), and exposed to X-ray films. The intensity of the chemiluminescence for the corresponding bands was analyzed using Image J software.
Cell culture
Bone marrow stromal cells (BMSCs) from 2-month-old mice were maintained with DMEM (Hyclone, Logan, USA) and primary liver cells from 1-month-old wild type mice were cultured with DMEM/F12 medium (Invitrogen Life Technologies, USA), containing 10% fetal bovine serum (Invitrogen), penicillin (100 U/ml) and streptomycin (100 mg/ml), cultured in humidified 5% CO2 atmosphere at 37°C. The medium was refreshed every 2–3 days and cells were spread after reaching to 90% confluence. After an overnight culture without serum, cells were stimulated with 100 nM insulin (Sigma, USA) for 10 min. In addition, in order to get know of the relative expression of miR-33 in the presence of insulin or absence of insulin, 100 nM insulin were added into the liver cells after reaching to 80–90% confluence in six-well plates for 2 h in experimental group, and the control group was with equal amount of 0.9% NaCl.
MiRNA microarray assay
At the very beginning of this research, we found the size of Irs-1−/− mice was smaller than wild type mice, and we first wondered if there were great changes in the bone. Therefore, we used the BMSCs of three genotypes mice for miRNA microarray analysis. Total RNAs were isolated from 2-month-old Irs-1+/+, Irs-1+/−, and Irs-1−/− mice BMSCs with TRIzol® Reagent (Invitrogen), and then each sample was 3′-end-labeled with Hy3TM fluorescent reagent. The fragmentation mixtures were hybridized on the miRCURYTM LNA Array (v.16.0) (Exiqon) according to the array manual. Scanned images were then imported into GenePix Pro 6.0 software (Axon) for grid alignment and data extraction. Replicated miRNAs were averaged and miRNAs with intensities ≥ 50 in all samples were chosen for calculating the normalization factor. Expressed data were normalized using the Median normalization. After normalization, differentially expressed miRNAs were identified through Fold Change filtering.
Bioinformatic analysis
The online software program TargetScan was used to predict the target genes of miR-33 with reference to the mouse gene sequence. The target genes predicted with the software program were intersected for further analysis. The software program website for target gene prediction is: TargetScanMouse http://www.targetscan.org/.
3′ UTR luciferase reporter assay
Mimic and inhibitor oligonucleotides of mmu-miR-33 and the negative control were synthesized by Yingrun Technology Corporation (China). The IRS-2 3′ untranslated region (3′ UTR) containing the predicted mmu-miR-33 binding site was PCR amplified and inserted downstream of the Renilla and Firefly luciferase gene, which were together constructed into the pYr-MirTarget-IRS-2-3U plasmid. 3T3-L1 cells were co-transfected with the pYr-MirTarget-IRS-2-3U plasmid and the miR-33 mimic (50 nmol l−1), inhibitor (100 nmol l−1), and negative control (50 nmol l−1). After 48 h, the Renilla and Firefly luciferase activities were measured using the Dual-Luciferase Reporter Assay kit (Promega, USA) according to the instructions. The luciferase-based target in vitro assay was applied to test whether miR-33 could bind to the 3′ UTR of the predicted target in IRS-2.
miR-33 and anti–miR-33 transfection
Primary cultured liver cells of 1-month-old wild type mice were isolated and cultured in 6-well plates to 70% confluence, then the miR-33 mimic (50 nmol l−1) and inhibitor (100 nmol l−1) were transfected into the cells with Lipofectamine 2000 (Invitrogen) with the help of Opti-MEM I (Invitrogen). All experimental control samples were treated with an equal concentration of a mimic negative control sequence or an inhibitor negative control sequence (NC) to control for nonsequence-specific effects in the miRNA experiments. After 4–6 h, the cells were refreshed with normal growth medium. The cells were cultured for another 2 days at 37°C, and then subjected to the further analyses.
RNA isolation and quantitative real-time RT-PCR
Total RNA from tissues or cultured cells was isolated using the TRIzol reagent (Invitrogen), and reverse transcription was performed using 1 μg of total RNA and SuperScript II (Invitrogen). Amplification reactions were set up in 25 μl reaction volumes containing SYBR Green PCR Master Mix (PE Applied Biosystems, USA) and amplification primers. A 1 μl volume of cDNA was used in each amplification reaction and eventually we performed qRT-PCR using a Roche Molecular Light Cycler. Primer sequences were as follows: IRS-2, CATCGACTTCCTGTCCCATCA (forward) and CCCATCCTC-AAGGTCAAAGG (reverse); β-actin, CAACGAGCGGTTCC-GATG (forward) and GCCACAGGATTCCATACCCA (reverse). The comparative Ct method was used to measure relative RNA expression levels.
Statistical analysis
One-way analysis of variance (ANOVA) with a post-hoc Bonferroni test between the three or more groups while Student’s t test with two groups was performed with SPSS (version 17.0), quantitative datas are expressed as the mean ± standard errors of the means (SEM). Statistical significance was defined as P < 0.05.
RESULTS
IRS-1 deficient mice show phenotypic changes and insulin resistance
The Irs-1−/− mouse was obviously smaller than the wild type and heterozygous mice (Fig. 1A). By detecting the weight change of each mouse from the first week to the twelve weeks, we found that the Irs-1−/− mouse was the lightest, only reaching ~40–60% of the weight of the wild type and heterozygous mice (Fig. 1B). However, no significant differences were found between the weight of the wild type and heterozygous mice. Irs-1−/− mice also showed a slightly decline in fasting blood glucose (FBG) levels compared with wild type and heterozygous mice (P < 0.05; Fig. 1C). However, Irs-1−/− mice exhibited mild insulin resistance, as determined by the insulin tolerance test (ITT) (Fig. 1D), and IGF-1 level was significantly higher in Irs-1−/− mice than in wild type mice through the detection of mouse IGF-1 Elisa Kit (Fig. 1E).
Fig. 1. Phenotypic changes in wild type (Irs-1+/+), heterozygous (Irs-1+/−), and homozygous (Irs-1−/−) mice.
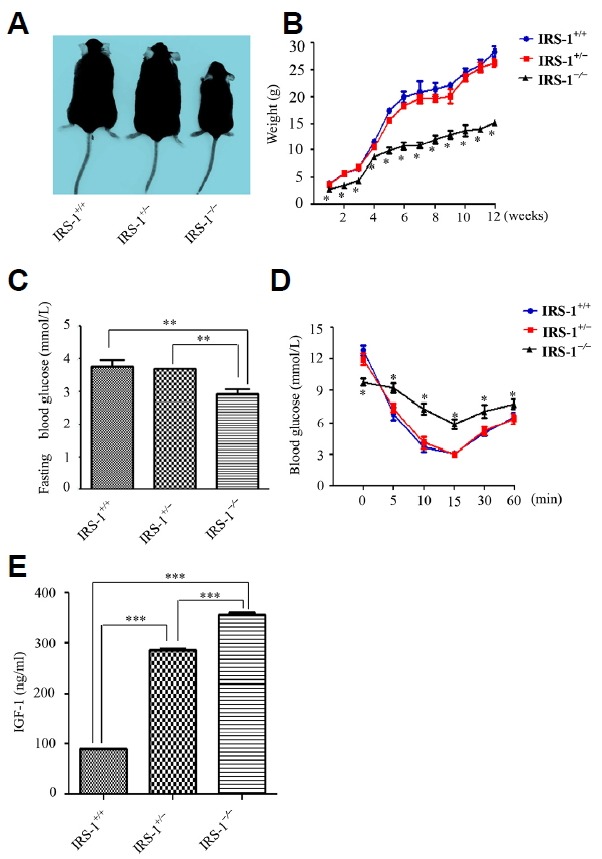
(A) The mice showed obvious differences in size and shape. (B) Weight changes in the mice from the first to the twelve weeks. Homozygous mice weighed only ~40 – 60% of the wild type and heterozygous mice. (C) Measurement of the fasting blood glucose (FBG) level from the tail vein indicated that homozygous mice showed statistically lower FBG than the wild type and heterozygous mice. (D) Insulin tolerance test results for the wild type, heterozygous, and homozygous mice. Blood glucose levels decreased the least (and eventually remained the highest) in the homozygous mice. (E) With mouse IGF-1 Elisa kit detecting the serum IGF-1 levels of the three genotypes mice, the results demonstrated that in Irs-1−/− mice, the serum IGF-1 level was the highest while the lowest in Irs-1+/+ mice. Values are means ± SEM; n = 3 mice per genotype. *P < 0.05, **P < 0.01, *** P < 0.001.
IRS-2 shows differential expression in various tissues of IRS-1 deficient mice
To investigate the mechanisms behind the decline in FBG in the Irs-1−/− mice, we detected the expression and distribution of IRS-2 protein by immunohistochemistry in the main target tissues of insulin (i.e., the liver, skeletal muscle, and subcutaneous adipocytes). The results indicated that IRS-2 protein expression, and its tyrosine phosphorylated product (p-IRS-2), were seemed higher in all three insulin target tissues in Irs-1−/− mice, especially in liver and skeletal muscle (Figs. 2A–2C), while the results were opposite in spleen (Fig. 2D). Through Image Pro-Plus 6.0 analyses, in the liver and skeletal muscle, the mean IOD of IRS-2 in Irs-1−/− mice were 2.6 and 3.6 folds higher respectively than in wild type mice (Fig. 2E). In addition, there were 18.4 and 11.0 folds much higher respectively in Irs-1−/− mice than in wild type mice as the mean IOD of p-IRS-2 in the liver and skeletal muscle were taken into consideration (Fig. 2F). The mean IOD of IRS-2 or p-IRS-2 were no statistical significance in subcutaneous adipocytes in Irs-1−/− and wild type mice (Figs. 2E and 2F). However, the mean IOD of IRS-2 or p-IRS-2 were 5.8 and 11.5 folds higher respectively in non-insulin target tissue the spleen in wild type mice than in Irs-1−/− mice (Figs. 2E and 2F).
Fig. 2. Differential IRS-2 protein expression in various tissues of the wild type (Irs-1+/+), heterozygous (Irs-1+/−), and homozygous (Irs-1−/−) mice.
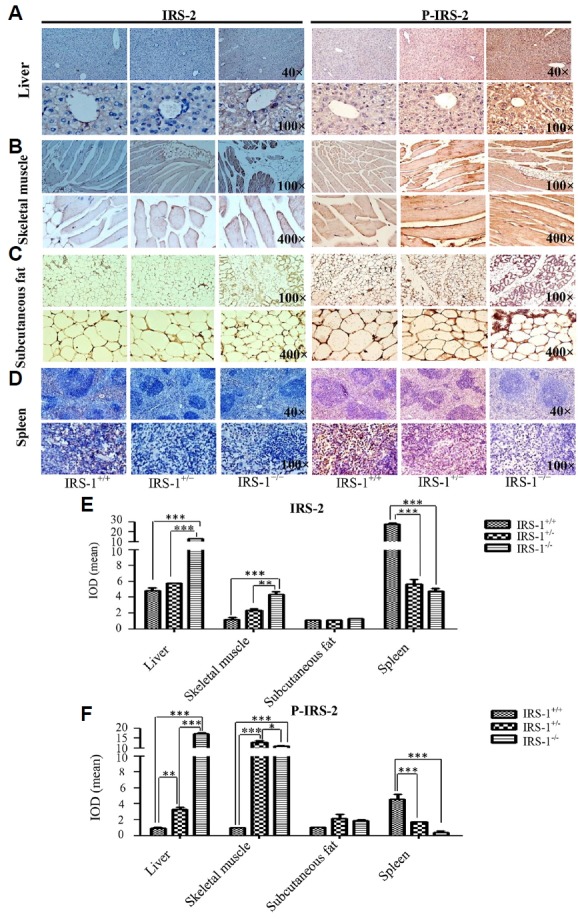
(A–D) In the liver and in the spleen, the figure above was 40 maganification and figure below was 100 maganification. In the skeletal muscle and subcutaneous fat, the figure above was 100 maganification and figure below was 400 maganification. (E–F) With Image Pro-Plus 6.0 software quantitative analyses, in the expression of IRS-2 or p-IRS-2, at least three high definition vision of every group were photoed as the final datas. Thus, in liver and skeletal muscle, the expression of IRS-2 and p-IRS-2 were all statistically elevated in Irs-1−/−mice than in Irs-1+/+ mice. In addition, there were no statistical differences in the expression of subcutaneous fat among the three genotypes mice. Howerer, in the spleen, this expression pattern was completely opposite compared with that observed in liver and skeletal muscle. *P < 0.05,**P < 0.01, ***P < 0.001.
Insulin signaling proteins exhibit disparate levels in diverse tissues of IRS-1 deficient mice
In order to further confirm the changes in expression of downstream insulin signaling proteins in Irs-1−/− mice, we compared PI3K level alterations among the mice. We found that PI3K expression was significantly elevated in the insulin target tissues (liver, skeletal muscle, and subcutaneous fat) of Irs-1−/− mice (P < 0.05; Fig. 3A). This indicates that IRS-1 is replaced by an alternate substrate protein and maintains insulin signaling in Irs-1 deficient mice.
Fig. 3. Levels of the insulin signaling proteins in liver, skeletal muscle, and subcutaneous adipose tissues from wild type (Irs-1+/+), heterozygous (Irs-1+/−), and homozygous (Irs-1−/−) mice.
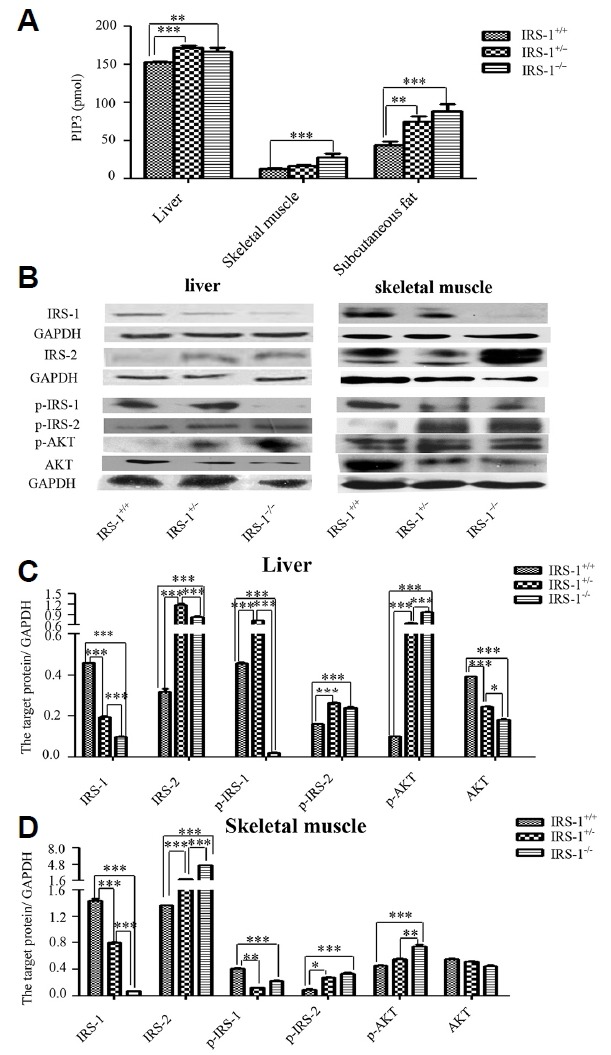
(A) In liver, skeletal muscle, and subcutaneous adipose tissues, PI3K expression (as determined by ELISA) was highest in the homozygous mice, followed by the heterozygous and wild type mice. (B) Insulin signaling proteins expression in liver and skeletal muscle of three genotypes mice by WB. (C) Through Image J bands quantitative analyses, whether in liver or in skeletal muscle, IRS-1 and p-IRS-1 expression were lowest in the homozygous mice. IRS-2, p-IRS-2, p85, and p-AKT expression were much higher in homozygous or heterozygous mice compared with wild type mice. *P < 0.01, **P < 0.01, ***P < 0.001.
To verify the hypothesis that the alternate substrate protein was IRS-2, we extracted proteins from liver and skeletal muscle tissues of the three different genotypes mice. We found that IRS-2 protein levels, as well as the levels of the downstream insulin signaling proteins (i.e., PI3K regulatory subunit p85, p-AKT), were increased in Irs-1−/− mice (Fig. 3B). Through Image J bands analyses, in liver, the expression of IRS-1 and p-IRS-1 in Irs-1−/− mice were declined 4.6 and 21.7 folds respectively in comparison with wild type mice, while the expression of IRS-2, p-IRS-2 and p-AKT were elevated 2.6, 1.5 and 9.5 folds respectively (Fig. 3C). In the skeletal muscle, the expression of IRS-1 and p-IRS-1 in Irs-1−/− mice were declined 19.3 and 1.8 folds respectively in comparison with wild type mice, however, the expression of IRS-2, p-IRS-2 and p-AKT were elevated 3.4, 3.5 and 1.6 folds respectively (Fig. 3D).
MiR-33 targets IRS-2 and is regulated by the insulin signaling pathway
To discover the underlying mechanisms of the increased IRS-2 expression in diverse tissues of the Irs-1 deficient mice, we isolated BMSCs from the mice and performed a microarray assay for miRNAs. We found that 34 miRNAs were up-regulated and 46 miRNAs were down-regulated in Irs-1−/− mice compared with wild type mice (Supplementary Table S1). We also showed that miR-33 was clearly down-regulated in Irs-1−/− mice compared with wild type mice (Supplementary Table S1).
With TargetScan software and a dual-luciferase reporter gene assay, we confirmed that Irs-2 is one target gene that is regulated by miR-33 (Figs. 4A–4C). The relative expression of miR-33 was significantly down-regulated in the presence of insulin compared with the absence of insulin in primary liver cells (Fig. 4D). In addition, the expression of miR-33 was obviously up-regulated in the fasting status in the subcutaneous fat compared with in normal (control) or re-feeding status (Fig. 4E). After the primary cultured liver cells were transfected with the miR-33 mimic, miR-33 levels increased while IRS-2 and the downstream insulin signaling proteins levels (p85 and p-AKT) were decreased (Figs. 4F and 4G). Through band analyses, the IRS-2, p85 and p-AKT were statistically declined 6.0, 1.3 and 1.4 folds compared with the miR-33 mimic NC (Fig. 4G). On the other hand, miR-33 levels decreased in the presence of the miR-33 inhibitor, while IRS-2 levels and levels of the downstream insulin signaling proteins (p85 and p-AKT) were elevated (Figs. 4H and 4I). Additionally, the IRS-2, p85 and p-AKT were statistically promoted 3.0, 1.4 and 1.6 folds compared with the miR-33 inhibitor NC (Fig. 4I). However, there were no statistical differences in the expression of IRS-2 mRNA whatever transfected with miR-33 mimic or inhibitor (Figs. 4F and 4H).
Fig. 4. MiR-33 targets IRS-2 and regulates and is regulated by insulin signaling pathway.
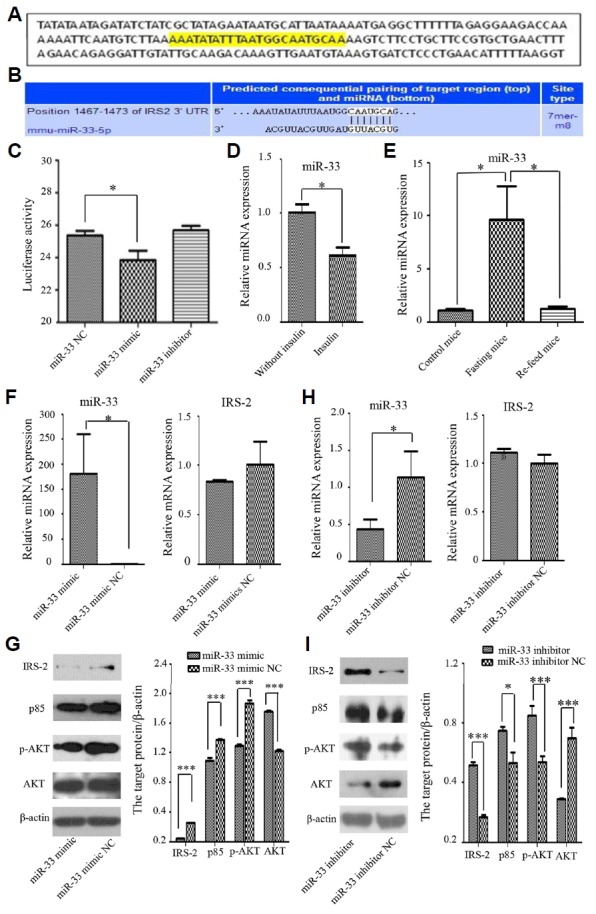
(A) The predicted miR-33 binding site (yellow) in the 3′ UTR of mouse Irs-2 using Targetscan software. (B) Consequential pairing of the Irs-2 3′ UTR region and miR-33. (C) Luciferase reporter gene assay showing activity after transfection with the miR-33 mimic, inhibitor, and negative control (NC). Luciferase activity was significantly reduced in the presence of the miR-33 mimic. (D) The relative expression of miR-33 was significantly down-regulated in the presence of insulin in comparison with absence of insulin. (E) The relative expression of miR-33 was obviously up-regulated in the fasting status in the subcutaneous fat compared with in normal (control) or re-feeding status. (F) The expression of miR-33 was significantly promoted, but the mRNA levels of Irs-2 in primary liver cells transfected with the miR-33 mimic and its NC showed that Irs-2 was no statistical difference in the presence of the miR-33 mimic. (G) Western blot analysis showed that the insulin signaling proteins (IRS-2, p85 and p-AKT) were down-regulated in the presence of the miR-33 mimic. (H) The expression of miR-33 was significantly declined, but the mRNA levels of Irs-2 in primary liver cells transfected with the miR-33 inhibitor and its NC showed that Irs-2 was also no statistical difference in the presence of the miR-33 inhibitor. (I) Western blot showed the insulin signaling proteins (IRS-2, p85 and p-AKT) were increased transfected with the miR-33 inhibitor. *P < 0.05, *** P < 0.001.
MiR-33 is down-regulated and IRS-2 is up-regulated in insulin target tissues of IRS-1 deficient mice
To validate the relationship between miR-33 and Irs-2 in vivo in insulin target tissues of Irs-1 deficient mice, we extracted the total RNA from liver, skeletal muscle, and subcutaneous adipocytes of mice with the three different genotypes, and reverse transcribed it. We found that miR-33 was down-regulated, while Irs-2 was up-regulated in Irs-1 deficient mice compared with wild type mice (Figs. 5A and 5B). Together, our results indicate that miR-33 negatively regulates Irs-2.
Fig. 5. MiR-33 and IRS-2 expression in the insulin target tissues of wild type (Irs-1+/+), heterozygous (Irs-1+/−), and homozygous (Irs-1−/−) mice.
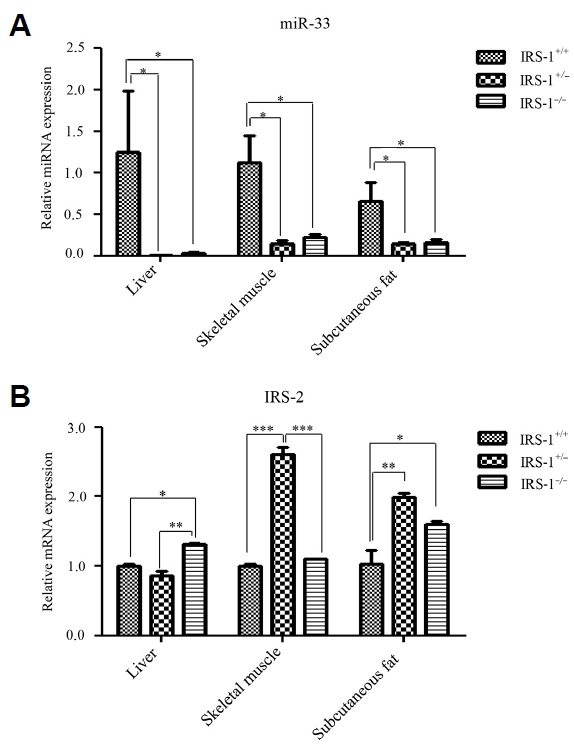
(A) MiR-33 expression in liver, skeletal muscle, and subcutaneous fat. MiR-33 expression was significantly reduced in all three tissues of homozygous and heterozygous mice compared with wild type mice. (B) Irs-2 expression in liver, skeletal muscle, and subcutaneous fat. Irs-2 expression was significantly increased in homozygous mice compared with wild type mice in liver and subcutaneous fat but not in skeletal muscle. On the other hand, Irs-2 expression was significantly increased in heterozygous mice compared with wild type mice in the skeletal muscle and subcutaneous fat but not in liver. *P < 0.05, **P < 0.01, ***P < 0.001.
DISCUSSION
It is known that Irs-1 deficiency dysregulates the classical insulin signaling pathway, which is of critical importance in insulin resistance and blood glucose homeostasis (Lu et al., 2012). While Irs-1 deficiency was previously shown to reduce glucokinase expression in fetal brown adipocytes resulting in hyperglycemia (Guo, 2014; Valverde et al., 1998), in this study, we found that Irs-1−/− mice showed slight insulin resistance and lower FBG levels than in wild type mice. In addition, the expression of downstream insulin signaling proteins was increased in Irs-1−/− mice compared with wild type mice. Therefore, the deficiency of Irs-1 didn’t result in hyperglycemia, which indicated that there existed the compensation of insulin pathway, so we detected the expression of IRS-2, another member in IRSs family in these mice. Our results showed that IRS-2 expression was increased significantly in liver and skeletal muscle, which support those found in a previous study, in which IRS-2 was shown to be the alternate substrate of the insulin receptor in liver and skeletal muscle in Irs-1 deficient mice (Patti et al., 1995). Similarly, Simmons et al. found that the expression of Irs-2 was up-regulated inIrs-1 null myofibroblasts. (Simmons et al., 2007). In addition, if endogenous Irs-2 were down-regulated, Irs-1 was up-regulated in PTP1B−/− neonatal hepatocytes and livers of PTP1B−/− neonates (Gonzalez-Rodriguez et al., 2007), all the previous researches indicated that IRS-2 possesses the potential to connect insulin signaling to both PI3K and Ras activation in a manner similar to IRS-1. In this study, we showed that Irs-2 could compensate for the defects of insulin signaling in Irs-1 deficient mice in insulin target tissues (i.e., liver and skeletal muscle), where the IRS-2 protein distribution and expression was found to be much higher than in wild type mice. Besides the compensation of IRS-2, the increased serum IGF-1 levels also makes up for the defects of insulin signaling pathway in regulating the FBG level, which might lead to the low blood glucose level.
As further evidence, Irs-1 and Irs-2 share many structural and functional characteristics (Sun et al., 1995). While the overall amino acid sequence similarity between Irs-1 and Irs-2 is only 43%, some domains show up to 65% and 75% sequence identity (such as the PH and PTB domains, respectively) (Sesti et al., 2001). More importantly, Irs-2 contains 22 potential tyrosine phosphorylation sites, of which 14 are almost identical to those in Irs-1, including phosphorylation sites that can bind the SH2 domains of PI3K, Grb 2, and SHPTP2 (Sun et al., 1995). Thus, due to their similarities, it is likely that Irs-2 can indeed compensate for the defects of insulin signaling pathway in the deficiency of Irs-1.
Insulin resistance leading to an insufficient compensatory increase in insulin secretion by β cells is the major etiology of type 2 diabetes mellitus (Papaetis et al., 2015). IRS-1 is a docking protein that combines with the insulin receptor, and plays a central role in stimulating insulin’s actions, including the binding and activation of PI3K, and the subsequent increase in glucose transport (Li et al., 2014). In subjects with non-insulin dependent diabetes mellitus, IRS-1 is notably reduced, and IRS-2 becomes the main docking protein for PI3K in subcutaneous adipose tissue (Rondinone et al., 1997). In this research, we found that IRS-2 protein expression was no statistical differences in subcutaneous fat between in Irs-1−/− mice and wild type mice, but it was notable statistical differences in liver and skeletal muscle. In other words, the compensation for Irs-1 deficiency by other IRSs was tissue-specific to some degree. As this Irs-1−/− mice still retains 56 amino acids on the N-terminal. It is possibly that this 56 amino acids peptide can still regulate insulin signaling pathway and blood glucose levels, at the same time, the overexpression of Irs-2 will enhance the insulin signals, the synergetic effects of them may lower FBG levels in Irs-1−/− mice. However, as most of the Irs-1 gene sequence was deleted, Irs-1−/− mice exhibited slightly insulin resistance. In fact, our groups have researched many aspects involved in the bone (Guo et al., 2016), fat (Man et al., 2016), and hepatic metabolism about this Irs-1−/− mice. About hepatic metabolism, we found lipogenic gene - Sterol regulatory element-binding protein (SREBP)-1c was closely associated with hepatic metabolism (data not shown here).
Irs-2 possesses a unique region comprising amino acids 591–786 that interacts specifically with the kinase regulatory loop binding (KRLB) domain of the insulin receptor β subunit (Sawka-Verhelle et al., 1996). This region may contribute to the signaling specificity of Irs-2, as it is absent in Irs-1. Moreover, Irs-2 has been shown to compensate for Irs-1 deficiency more effectively in liver and pancreatic β cells than in skeletal muscle and adipocytes (Bruning et al., 1997; Kaburagi et al., 1997). Studies in mice with combined heterozygous knockout of Irs-1 and Irs-2 have indicated that Irs-1 plays a central role in skeletal muscle while Irs-2 is important in liver (Guo, 2013). Coincidentally, our results showed in liver and skeletal muscle, the distribution of IRS-2 in Irs-1−/− mice were 2.6 and 3.6 folds higher respectively than in wild type mice. In addition, there were 18.4 and 11.0 folds much higher respectively in p-IRS-2 distribution. However, there were no statistical differences in IRS-2 or p-IRS-2 distribution in subcutaneous fat. Moreover, in liver, the expression of IRS-1 and p-IRS-1 were declined 4.6 and 21.7 folds respectively in Irs-1−/− mice than in wild type mice, while the expression of IRS-2, p-IRS-2 and p-AKT were elevated 2.6, 1.5 and 9.5 folds respectively. In skeletal muscle, the expression of IRS-1 and p-IRS-1 were declined 19.3 and 1.8 folds respectively in Irs-1−/− mice than in wild type mice, but the expression of IRS-2, p-IRS-2 and p-AKT were elevated 3.4, 3.5 and 1.6 folds respectively. All these datas demonstrated that Irs-2 can partially compensate for the Irs-1 deficiency to restore the insulin signaling pathway and regulate blood glucose levels. More importantly, Irs-2 compensated more effectively in liver and skeletal muscle than in subcutaneous adipocytes in Irs-1 deficient mice, which may be due to differences in structure and tissue specific expression. In this research, we found that PIP3 level was increased but IRS-2 protein expression and distribution was no change in subcutaneous fat of Irs-1−/− mice. In fact, more than half of insulin stimulated glucose transporter 4 (GLUT4) translocation and glucose transport was saved by a signaling pathway involving Irs-3 rather than Irs-2 in adipocytes of Irs-1 deficient mice (Kaburagi et al., 1997). In addition, overexpression of Irs-3 in rat adipocytes led to a sharp increase in the number of GLUT4 molecules translocated to the cell surface, even when insulin was lacking (Zhou et al., 1999). Hence, Irs-3 might be able to compensate for Irs-1 deficiency more effectively in subcutaneous adipocytes than Irs-2. Nevertheless, this does not mean that Irs-2 cannot compensate for the defects of insulin signaling in the subcutaneous adipocytes in the deficiency of Irs-1 (Rondinone et al., 1997). In peripheral tissues, miR-33 was significantly down-regulated in liver, skeletal muscle and subcutaneous fat of Irs-1−/− mice. Due to the reason that IRS-3 was mainly expressed in the subcutaneous fat (Kaburagi et al., 1997; Zhou et al., 1999), thus we did not detect the expression of IRS-2 in protein level. It demonstrated that single gene deletion or double gene deletion of Irs-1 make a difference in different tissues of Irs-2 compensation in mRNA or protein level. Whatever, the expression of IRS-2 was up-regulated in Irs-1 knockout mice in comparison with wild-type mice.
BMSCs are a kind of pluripotent stem cell which has the ability to self-renew and differentiate into functional cells such as osteoblasts, chondrocytes, adipocytes and so on (Fang et al., 2014; Li and Song, 2012). Therefore, we used BMSCs for the miRNA microarray analysis. The result of our miRNA microarray demonstrated that miR-33 was significantly down-regulated in BMSCs from Irs-1−/− mice than those from Irs-1+/+ mice. It has been proved that miRNAs are associated with metabolic disorders, mainly in cardiovascular diseases and type 2 diabetes mellitus (Kong et al., 2012). In addition, miRNAs are considered as diagnostic biomarkers and therapeutic targets in metabolic diseases (Richardson et al., 2013). In primary liver cells transfected with miR-33 mimic, we found that its target gene Irs-2 and its phosphorylation were significantly declined and the downstream signaling proteins – PI3K (p85 subunit) and AKT phosphorylation were also significantly down-regulated. And the results turned to be opposite after miR-33 inhibitor was transfected into the liver cells. In addition, the relative expression of miR-33 was down-regulated in the presence of insulin compared with absence of insulin treatment in the liver cells. What’s more, the expression of miR-33 was significantly up-regulated in the fasting status in the subcutaneous fat compared with in normal (control) or re-feeding status. It means that miR-33 mimic down-regulated insulin signaling pathway while miR-33 inhibitor up-regulated insulin signaling pathway led by Irs-2, and the insulin pathway could also regulated the expression of miR-33. Therefore, we can clearly knew that ITT was obviously affected whatever miR-33 mimic or inhibitor transfected into the liver cells. Together, our results showed that miR-33 could negatively regulate and be regulated by the insulin signaling pathway through Irs-2. Furthermore, miR-33 was previously shown to be a regulator of insulin signaling in liver and circulating blood of the rats (Bae et al., 2014).
In conclusion, considering the fact that miR-33 is intimately associated with the insulin signaling pathway led by Irs-2, we may be able to intervene in type 2 diabetes mellitus by down-regulating miR-33 and up-regulating Irs-2 expression. However, there are some limitations to this goal, and the role of miR-33 in metabolic disorders of insulin resistance is an area for further research.
Supplementary data
ACKNOWLEDGMENTS
This work was supported by grants from the National Natural Scientific Foundation of China [grant numbers 81370975, 81070278, 81401835] and the Hunan Provincial Natural Science Foundation of China [grant numbers 2015JC3012, 100JJ1007].
Footnotes
Note: Supplementary information is available on the Molecules and Cells website (www.molcells.org).
REFERENCES
- Araki E., Lipes M.A., Patti M.E., Bruning J.C., Haag B., 3rd, Johnson R.S., Kahn C.R. Alternative pathway of insulin signalling in mice with targeted disruption of the IRS-1 gene. Nature. 1994;372:186–190. doi: 10.1038/372186a0. [DOI] [PubMed] [Google Scholar]
- Bae C.R., Hasegawa K., Akieda-Asai S., Kawasaki Y., Senba K., Cha Y.S., Date Y. Possible involvement of food texture in insulin resistance and energy metabolism in male rats. J Endocrinol. 2014;222:61–72. doi: 10.1530/JOE-13-0553. [DOI] [PubMed] [Google Scholar]
- Benito M. Tissue specificity on insulin action and resistance: past to recent mechanisms. Acta Physiol. 2011;201:297–312. doi: 10.1111/j.1748-1716.2010.02201.x. [DOI] [PubMed] [Google Scholar]
- Berindan-Neagoe I., del Monroig P.C., Pasculli B., Calin G.A. MicroRNAome genome: a treasure for cancer diagnosis and therapy. CA Cancer J Clin. 2014;64:311–336. doi: 10.3322/caac.21244. [DOI] [PMC free article] [PubMed] [Google Scholar]
- Blaak E.E. Metabolic fluxes in skeletal muscle in relation to obesity and insulin resistance. Best Pract Res Clin Endocrinol Metab. 2005;19:391–403. doi: 10.1016/j.beem.2005.04.001. [DOI] [PubMed] [Google Scholar]
- Bruning J.C., Winnay J., Cheatham B., Kahn C.R. Differential signaling by insulin receptor substrate 1 (IRS-1) and IRS-2 in IRS-1-deficient cells. Mol Cell Biol. 1997;17:1513–1521. doi: 10.1128/mcb.17.3.1513. [DOI] [PMC free article] [PubMed] [Google Scholar]
- Bu Y.H., He Y.L., Zhou H.D., Liu W., Peng D., Tang A.G., Tang L.L., Xie H., Huang Q.X., Luo X.H., et al. Insulin receptor substrate 1 regulates the cellular differentiation and the matrix metallopeptidase expression of preosteoblastic cells. J Endocrinol. 2010;206:271–277. doi: 10.1677/JOE-10-0064. [DOI] [PubMed] [Google Scholar]
- Cheng C.J., Bahal R., Babar I.A., Pincus Z., Barrera F., Liu C., Svoronos A., Braddock D.T., Glazer P.M., Engelman D.M., et al. MicroRNA silencing for cancer therapy targeted to the tumour microenvironment. Nature. 2015;518:107–110. doi: 10.1038/nature13905. [DOI] [PMC free article] [PubMed] [Google Scholar]
- Davalos A., Goedeke L., Smibert P., Ramirez C.M., Warrier N.P., Andreo U., Cirera-Salinas D., Rayner K., Suresh U., Pastor-Pareja J.C., et al. miR-33a/b contribute to the regulation of fatty acid metabolism and insulin signaling. Proc Natl Acad Sci USA. 2011;108:9232–9237. doi: 10.1073/pnas.1102281108. [DOI] [PMC free article] [PubMed] [Google Scholar]
- Fang J.K., Zhou Y.P., Li M.L. [Research progress on effects of traditional Chinese medicines on proliferation, apoptosis and differentiation of bone marrow mesenchymal stem cells] Zhongguo Zhong Yao Za Zhi. 2014;39:2834–2837. [PubMed] [Google Scholar]
- Fernandez-Hernando C., Ramirez C.M., Goedeke L., Suarez Y. MicroRNAs in metabolic disease. Arterioscler Thromb Vasc Biol. 2013;33:178–185. doi: 10.1161/ATVBAHA.112.300144. [DOI] [PMC free article] [PubMed] [Google Scholar]
- Giudice A., D’Arena G., Crispo A., Tecce M.F., Nocerino F., Grimaldi M., Rotondo E., D’Ursi A.M., Scrima M., Galdiero M., et al. Role of viral miRNAs and epigenetic modifications in epstein-barr virus-associated gastric carcinogenesis. Oxid Med Cell Longev. 2016;2016:6021934. doi: 10.1155/2016/6021934. [DOI] [PMC free article] [PubMed] [Google Scholar]
- Gonzalez-Rodriguez A., Clampit J.E., Escribano O., Benito M., Rondinone C.M., Valverde A.M. Developmental switch from prolonged insulin action to increased insulin sensitivity in protein tyrosine phosphatase 1B-deficient hepatocytes. Endocrinology. 2007;148:594–608.30. doi: 10.1210/en.2006-0644. [DOI] [PubMed] [Google Scholar]
- Guay C., Regazzi R. MicroRNAs and the functional beta cell mass: for better or worse. Diabetes Metab. 2015;41:369–377.20. doi: 10.1016/j.diabet.2015.03.006. [DOI] [PubMed] [Google Scholar]
- Guo S. Molecular basis of insulin resistance: The role of IRS and Foxo1 in the control of diabetes mellitus and its complications. Drug Discov Today Dis Mech. 2013;10:e27–e33. doi: 10.1016/j.ddmec.2013.06.003. [DOI] [PMC free article] [PubMed] [Google Scholar]
- Guo S. Insulin signaling, resistance, and the metabolic syndrome: insights from mouse models into disease mechanisms. J Endocrinol. 2014;220:T1–T23. doi: 10.1530/JOE-13-0327. [DOI] [PMC free article] [PubMed] [Google Scholar]
- Guo Y., Tang C.Y., Man X.F., Tang H.N., Tang J., Wang F., Zhou C.L., Tan S.W., Feng Y.Z., Zhou H.D. Insulin receptor substrate-1 time-dependently regulates bone formation by controlling collagen Ialpha2 expression via miR-342. FASEB J. 2016;30:4214–4226. doi: 10.1096/fj.201600445RR. [DOI] [PMC free article] [PubMed] [Google Scholar]
- Kaburagi Y., Satoh S., Tamemoto H., Yamamoto-Honda R., Tobe K., Veki K., Yamauchi T., Kono-Sugita E., Sekihara H., Aizawa S., et al. Role of insulin receptor substrate-1 and pp60 in the regulation of insulin-induced glucose transport and GLUT4 translocation in primary adipocytes. J Biol Chem. 1997;272:25839–25844. doi: 10.1074/jbc.272.41.25839. [DOI] [PubMed] [Google Scholar]
- Kadowaki T. Insights into insulin resistance and type 2 diabetes from knockout mouse models. J Clin Invest. 2000;106:459–465. doi: 10.1172/JCI10830. [DOI] [PMC free article] [PubMed] [Google Scholar]
- Kido Y., Burks D.J., Withers D., Bruning J.C., Kahn C.R., White M.F., Accili D. Tissue-specific insulin resistance in mice with mutations in the insulin receptor, IRS-1, and IRS-2. J Clin Invest. 2000;105:199–205. doi: 10.1172/JCI7917. [DOI] [PMC free article] [PubMed] [Google Scholar]
- Kong Y.W., Ferland-McCollough D., Jackson T.J., Bushell M. microRNAs in cancer management. Lancet Oncol. 2012;13:e249–258. doi: 10.1016/S1470-2045(12)70073-6. [DOI] [PubMed] [Google Scholar]
- Kubota N., Terauchi Y., Tobe K., Yano W., Suzuki R., Ueki K., Takamoto I., Satoh H., Maki T., Kubota T., et al. Insulin receptor substrate 2 plays a crucial role in beta cells and the hypothalamus. J Clin Invest. 2004;114:917–927. doi: 10.1172/JCI21484. [DOI] [PMC free article] [PubMed] [Google Scholar]
- Leibiger I.B., Leibiger B., Berggren P.O. Insulin signaling in the pancreatic beta-cell. Annu Rev Nutr. 2008;28:233–251. doi: 10.1146/annurev.nutr.28.061807.155530. [DOI] [PubMed] [Google Scholar]
- Li X., Song G. [Roles of matrix metalloproteinase in migration and differentiation of bone marrow-derived mesenchymal stem cells] Sheng Wu Yi Xue Gong Cheng Xue Za Zhi. 2012;29:387–391. [PubMed] [Google Scholar]
- Li Y., Wang J., Gu T., Yamahara J. Oleanolic acid supplement attenuates liquid fructose-induced adipose tissue insulin resistance through the insulin receptor substrate-1/phosphatidylinositol 3-kinase/Akt signaling pathway in rats. Toxicol Appl Pharmacol. 2014;277:155–163. doi: 10.1016/j.taap.2014.03.016. [DOI] [PubMed] [Google Scholar]
- Lu J., Zeng Y., Hou W., Zhang S., Li L., Luo X., Xi W., Chen Z., Xiang M. The soybean peptide aglycin regulates glucose homeostasis in type 2 diabetic mice via IR/IRS1 pathway. J Nutr Biochem. 2012;23:1449–1457. doi: 10.1016/j.jnutbio.2011.09.007. [DOI] [PubMed] [Google Scholar]
- Man X.F., Tan S.W., Tang H.N., Guo Y., Tang C.Y., Tang J., Zhou C.L., Zhou H.D. MiR-503 inhibits adipogenesis by targeting bone morphogenetic protein receptor 1a. Am J Transl Res. 2016;8:2727–2737. [PMC free article] [PubMed] [Google Scholar]
- Mao Y., Mohan R., Zhang S., Tang X. MicroRNAs as pharmacological targets in diabetes. Pharmacol Res. 2013;75:37–47. doi: 10.1016/j.phrs.2013.06.005. [DOI] [PMC free article] [PubMed] [Google Scholar]
- Newsholme E.A., Dimitriadis G. Integration of biochemical and physiologic effects of insulin on glucose metabolism. Exp Clin Endocrinol Diabetes. 2001;109:S122–134. doi: 10.1055/s-2001-18575. [DOI] [PubMed] [Google Scholar]
- Papaetis G.S., Papakyriakou P., Panagiotou T.N. Central obesity, type 2 diabetes and insulin: exploring a pathway full of thorns. Arch Med Sci. 2015;11:463–482. doi: 10.5114/aoms.2015.52350. [DOI] [PMC free article] [PubMed] [Google Scholar]
- Patti M.E., Sun X.J., Bruening J.C., Araki E., Lipes M.A., White M.F., Kahn C.R. 4PS/insulin receptor substrate (IRS)-2 is the alternative substrate of the insulin receptor in IRS-1-deficient mice. J Biol Chem. 1995;270:24670–24673. doi: 10.1074/jbc.270.42.24670. [DOI] [PubMed] [Google Scholar]
- Rebustini I.T., Vlahos M., Packer T., Kukuruzinska M.A., Maas R.L. An integrated miRNA functional screening and target validation method for organ morphogenesis. Sci Rep. 2016;6:23215. doi: 10.1038/srep23215. [DOI] [PMC free article] [PubMed] [Google Scholar]
- Richardson K., Nettleton J.A., Rotllan N., Tanaka T., Smith C.E., Lai C.Q., Parnell L.D., Lee Y.C., Lahti J., Lemaitre R.N., et al. Gain-of-function lipoprotein lipase variant rs13702 modulates lipid traits through disruption of a microRNA-410 seed site. Am J Hum Genet. 2013;92:5–14. doi: 10.1016/j.ajhg.2012.10.020. [DOI] [PMC free article] [PubMed] [Google Scholar]
- Rondinone C.M., Wang L.M., Lonnroth P., Wesslau C., Pierce J.H., Smith U. Insulin receptor substrate (IRS) 1 is reduced and IRS-2 is the main docking protein for phosphatidylinositol 3-kinase in adipocytes from subjects with non-insulin-dependent diabetes mellitus. Proc Natl Acad Sci USA. 1997;94:4171–4175. doi: 10.1073/pnas.94.8.4171. [DOI] [PMC free article] [PubMed] [Google Scholar]
- Rui L. Energy metabolism in the liver. Compr Physiol. 2014;4:177–197. doi: 10.1002/cphy.c130024. [DOI] [PMC free article] [PubMed] [Google Scholar]
- Sawka-Verhelle D., Tartare-Deckert S., White M.F., Van Obberghen E. Insulin receptor substrate-2 binds to the insulin receptor through its phosphotyrosine-binding domain and through a newly identified domain comprising amino acids 591–786. J Biol Chem. 1996;271:5980–5983. doi: 10.1074/jbc.271.11.5980. [DOI] [PubMed] [Google Scholar]
- Sesti G., Federici M., Hribal M.L., Lauro D., Sbraccia P., Lauro R. Defects of the insulin receptor substrate (IRS) system in human metabolic disorders. FASEB J. 2001;15:2099–2111. doi: 10.1096/fj.01-0009rev. [DOI] [PubMed] [Google Scholar]
- Simmons J.G., Ling Y., Wilkins H., Fuller C.R., D’Ercole A.J., Fagin J., Lund P.K. Cell-specific effects of insulin receptor substrate-1 deficiency on normal and IGF-I-mediated colon growth. Am J Physiol Gastrointest Liver Physiol. 2007;293:G995–1003. doi: 10.1152/ajpgi.00537.2006.. [DOI] [PMC free article] [PubMed] [Google Scholar]
- Sun X.J., Wang L.M., Zhang Y., Yenush L., Myers M.G., Jr, Glasheen E., Lane W.S., Pierce J.H., White M.F. Role of IRS-2 in insulin and cytokine signaling. Nature. 1995;377:173–177. doi: 10.1038/377173a0. [DOI] [PubMed] [Google Scholar]
- Valverde A.M., Lorenzo M., Pons S., White M.F., Benito M. Insulin receptor substrate (IRS) proteins IRS-1 and IRS-2 differential signaling in the insulin/insulin-like growth factor-I pathways in fetal brown adipocytes. Mol Endocrinol. 1998;12:688–697. doi: 10.1210/mend.12.5.0106. [DOI] [PubMed] [Google Scholar]
- White M.F. Insulin signaling in health and disease. Science. 2003;302:1710–1711. doi: 10.1126/science.1092952. [DOI] [PubMed] [Google Scholar]
- Withers D.J., Gutierrez J.S., Towery H., Burks D.J., Ren J.M., Previs S., Zhang Y., Bernal D., Pons S., Shulman G.I., et al. Disruption of IRS-2 causes type 2 diabetes in mice. Nature. 1998;391:900–904. doi: 10.1038/36116. [DOI] [PubMed] [Google Scholar]
- Zhang J., Liu F. Tissue-specific insulin signaling in the regulation of metabolism and aging. IUBMB Life. 2014;66:485–495. doi: 10.1002/iub.1293. [DOI] [PMC free article] [PubMed] [Google Scholar]
- Zhou L., Chen H., Xu P., Cong L.N., Sciacchitano S., Li Y., Graham D., Jacobs A.R., Taylor S.I., Quon M.J. Action of insulin receptor substrate-3 (IRS-3) and IRS-4 to stimulate translocation of GLUT4 in rat adipose cells. Mol Endocrinol. 1999;13:505–514. doi: 10.1210/mend.13.3.0242. [DOI] [PubMed] [Google Scholar]
Associated Data
This section collects any data citations, data availability statements, or supplementary materials included in this article.