

Abstract
The failure of pancreatic islet β-cells is a major contributor to the etiology of type 2 diabetes. β-Cell dysfunction and declining β-cell mass are two mechanisms that contribute to this failure, although it is unclear whether they are molecularly linked. Here, we show that the cell cycle regulator, cyclin-dependent kinase 2 (CDK2), couples primary β-cell dysfunction to the progressive deterioration of β-cell mass in diabetes. Mice with pancreas-specific deletion of Cdk2 are glucose-intolerant, primarily due to defects in glucose-stimulated insulin secretion. Accompanying this loss of secretion are defects in β-cell metabolism and perturbed mitochondrial structure. Persistent insulin secretion defects culminate in progressive deficits in β-cell proliferation, reduced β-cell mass, and diabetes. These outcomes may be mediated directly by the loss of CDK2, which binds to and phosphorylates the transcription factor FOXO1 in a glucose-dependent manner. Further, we identified a requirement for CDK2 in the compensatory increases in β-cell mass that occur in response to age- and diet-induced stress. Thus, CDK2 serves as an important nexus linking primary β-cell dysfunction to progressive β-cell mass deterioration in diabetes.
Keywords: beta cell (B-cell), cell cycle, cyclin-dependent kinase (CDK), diabetes, FOXO, beta cell function, beta cell mass, CDK2, foxo1
Introduction
Diabetes is strongly associated with a failure of pancreatic islet β-cells, although the mechanisms of β-cell failure remain unclear (1, 2). β-Cell dysfunction is considered a likely mechanism whereby β-cells are incapable of compensating for rising plasma sugar levels with a concomitant increase in insulin secretion (3). Further, ample evidence supports the notion that reduced β-cell mass is a contributor to insulin insufficiency (3, 4). Understanding the link between β-cell function and β-cell mass and the compensatory mechanisms that are elicited in response to rising blood sugar will aid in designing the next generation of therapeutic agents to restore β-cell function while preserving β-cell mass in diabetes.
Two common themes emerge from the many genome-wide association studies of type 2 diabetes: (i) there is an enriched set of loci that mainly affect β-cells, and (ii) there seem to be an overabundance of cell cycle genes involved (5–7). The cell cycle pathway integrates inputs from diverse signaling networks to regulate cell growth, proliferation, differentiation, and apoptosis (8, 9). Cyclin-dependent kinases (CDKs)2 are the gatekeepers of the cell cycle pathway, and their association with cognate regulatory proteins, the cyclins, promotes cell cycle progression in mammalian cells. CDKs phosphorylate downstream substrates, chiefly the retinoblastoma (RB) family proteins, on specific serine/threonine phosphorylation sites, resulting in the release of transcription factors that in turn modulate the expression of target gene promoters. Interestingly, the CDKN2A gene that codes for the CDK inhibitor p16Ink4a is identified in all genome-wide association studies of diabetes (5–7). p16Ink4a expression is increased in aged islets and correlates strongly with age-dependent reduction in β-cell proliferation and regeneration potential (10). p16Ink4a inhibits the activities of multiple CDKs, including CDK4, CDK6, and, indirectly, CDK2 (11–13), and as such, p16Ink4a is able to regulate cell proliferation, differentiation, and senescence via multiple signaling pathways.
We previously showed that CDK4 deficiency causes β-cell hypoplasia and insulin-deficient diabetes, whereas CDK4 activation enhances β-cell mass (14, 15), regeneration potential (16), early pancreas development, and commitment to the endocrine lineage by inducing Ngn3 transcription (17) and stabilizing the PDX1 transcription factor (18). Other studies have further validated the importance of cell cycle molecules in establishing β-cell mass and its regenerative capacity (4, 19), although a possible role in β-cell function has been understudied.
Here, we provide evidence that CDK2 provides a novel link between changes in β-cell mass and β-cell function. Most interestingly, the earliest consequences of conditional Cdk2 deletion involved impaired β-cell function rather than deficits in β-cell mass. With advancing age or under conditions of overnutrition, CDK2 loss decreased β-cell proliferation and reduced β-cell mass, resulting in diabetes. These data warrant a reevaluation of the role of CDKs in β-cell function and suggest an intricate relationship between changes in β-cell mass and function in diabetes progression.
Results
CDK2 Loss Results in Pancreatic Islet β-Cell Dysfunction
CDK2 is preferentially expressed in the endocrine pancreas with no detectable expression in the exocrine pancreas (Fig. 1). The majority of CDK2+ cells were insulin+ β-cells, and it was rare to observe glucagon+ α-cells expressing CDK2. Germ line whole-body Cdk2 knock-out (Cdk2−/−) mice are viable but infertile due to defects in germ cell development (20, 21). CDK2 is essential for the completion of prophase 1 during germ cell meiosis (21), and CDK2 loss affects the timing of S-phase, consistent with a role in mitosis (20). Although these studies elucidated the role of CDK2 in germ cell development, the importance of CDK2 in glucose homeostasis was not investigated. Here we show that whole-body germ line Cdk2−/− mice exhibit elevated fasting and fed-state hyperglycemia (Fig. 2, A and B). Further, Cdk2−/− mice exhibit severely impaired glucose tolerance (Fig. 2C), and glucose-stimulated insulin levels in plasma were reduced in Cdk2−/− mice (Fig. 2D). Cdk2−/− islets exhibited reduced glucose-stimulated insulin secretion ex vivo (Fig. 2, E and F), indicative of β-cell dysfunction. Similar observations were seen in both male and female Cdk2−/− mice, eliminating any gender-specific effects of CDK2 loss. Together, these results are supportive of an important role for CDK2 in β-cell function.
FIGURE 1.
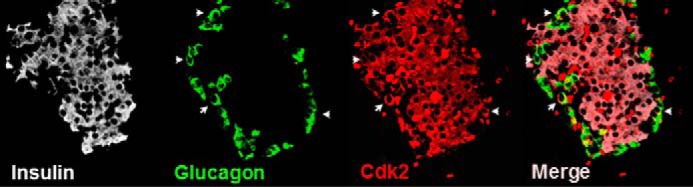
CDK2 expression in pancreatic islets. Immunofluorescence analyses indicates that the majority of CDK2-positive cells (red) are insulin+ β-cells (white). Rare glucagon+ α-cells (green) expressing CDK2 (indicated by arrows) are seen. The merged image shows the relative distribution of CDK2 in the islet.
FIGURE 2.

β-Cell dysfunction, glucose intolerance, and hyperglycemia in global Cdk2 knock-out mice. Overnight fasting (16 h) (A) and fed (B) morning glucose levels were measured in 6-month-old female Cdk2-WT (open bar) and Cdk2-KO (closed bar) mice (n = 4–5). Shown are plasma glucose levels (C) and serum insulin levels (D) at 0 and 30 min after glucose administration (2 g/kg of body weight) during the glucose tolerance test (GTT) in 6-month-old Cdk2-WT (open bars) and Cdk2-KO (closed bars) female mice (n = 4/group). Glucose-stimulated insulin secretion under low (2 mm) and high (16.7 mm) glucose concentration in islets from 6-month-old female (E) and male (F) Cdk2-WT (open bars) and KO (closed bars) mice. Islets were isolated and collected from 3 mice/group, and 15 islets/group were used for insulin secretion assays done in triplicate. Insulin secretion level was normalized by total cellular insulin content from 15 islets and shown on the y axis. All data represent the mean ± S.D. (error bars) of three independent experiments. #, comparison between 0 and 30 min or 2 and 16.7 mm, p < 0.05; *, comparison between Cdk2-WT and Cdk2-KO group, p < 0.05; Student's t test.
To specifically examine the role of CDK2 within the pancreas, we generated mice with pancreas-specific CDK2 deletion (Cdk2-pKO mice) by breeding Cdk2flox/flox (Cdk2fl/fl) mice with two different mouse strains expressing CRE recombinase under the control of the Pdx1 promoter, a transcription factor expressed in both the pancreas and the duodenum (22, 23). Similar findings were observed in mice derived from crosses using either of the Pdx1-Cre strains.
Examination of embryonic day 12.5 (E12.5) pancreas by immunofluorescence using antibodies to the key pancreas transcription factors Pdx1, Nkx2.2, and Nkx6.1 and the epithelial cell-specific marker E-cadherin revealed morphologically normal staining in the Cdk2-pKO embryos, compared with age-matched wild-type Cdk2-Con embryos (Fig. 3, A–F). Thus, CDK2 loss does not appear to affect early pancreas development. Cdk2-pKO mice were born at the predicted Mendelian frequency and appeared normal in size and weight compared with age- and sex-matched control littermates. To better understand the very early effects of CDK2 deletion in the pancreas, we examined control and Cdk2-pKO mice at post-natal days 2–10. Body weights, fed glucose levels, pancreas histology, α-cell and β-cell immunostaining patterns, α-cell and β-cell mass, indices of β-cell proliferation, and level of expression of α-cell- and β-cell-specific markers were all found to be similar in Cdk2-pKO mice compared with age- and sex-matched control mice (Fig. 4), indicating normal early pancreas development. Glucose tolerance and insulin secretion were also similar at 1 month in mice of both genotypes (data not shown).
FIGURE 3.
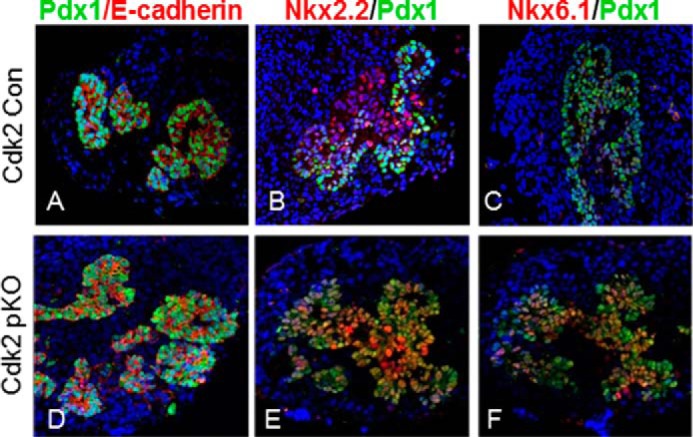
CDK2 loss does not affect embryonic pancreas development. A–F, co-immunofluorescence analysis of E-cadherin (A and D), NKX2.2 (B and E), and NKX6.1 (C and F) (red) along with PDX1 (green) in embryonic pancreases of Cdk2-Con and Cdk2-pKO mice at E12.5 (n = 3/genotype).
FIGURE 4.

Normal early development of Cdk2-pKO mice. Body weight (A) and fed morning glucose level (B) were measured during early neonatal stage after birth. The ratio of pancreatic weight to body weight (Cdk2-pKO (0.35%) versus Cdk2-Con (0.33%) at postnatal day 10) was similar in both groups. Shown is a representative islet image with insulin (green) and glucagon (red) staining from Cdk2 control (Con) (C) and Cdk2-pKO (pKO) (D) mice at postnatal day 10. E, β-cell and α-cell area were measured at post-natal day 10. The total areas of insulin-positive (Ins+) and glucagon-positive (Glcg+) cells were measured and then normalized by the total pancreatic area per section. Three sections were analyzed per mouse, and three mice for pKO and two mice for control group were used. F, β-cell proliferation was measured with insulin and BrdU staining at postnatal day 10. BrdU and insulin double-positive cells were counted and divided by the total number of insulin-positive cells per pancreatic section. Three sections were analyzed per mouse, and three mice for pKO and two mice for control group were used. G, quantitative RT-PCR analysis of the indicated pancreatic transcripts at post-natal day 2 in Cdk2 control and Cdk2-pKO mice (n = 3 in both genotypes, done in duplicates). Error bars, S.D.
We next monitored the effects of CDK2 loss on glycemia in adult Cdk2-pKO mice. Fed glucose levels were similar in mice from both genotypes, and no gender-specific differences were detected (Fig. 5, A and B). Fasting glucose levels in Cdk2-pKO mice trended toward high normal ranges after 6 months of age, with male fasting glucose levels being significantly elevated at 8 and 12 months of age (Fig. 5, C and D). Insulin and glucagon staining appeared normal in pancreases from 2-month-old Cdk2-pKO mice, despite the lack of CDK2 expression (Fig. 6A). Consistent with this, α- and β-cell mass (Fig. 6B) and pancreatic insulin content (Fig. 6C) were also similar in Cdk2-pKO and control pancreas at 2 months of age. However, despite maintaining normal β-cell mass and insulin content, 2-month-old Cdk2-pKO mice exhibited impaired glucose tolerance (Fig. 7A). Moreover, in vivo insulin secretion was defective during the glucose tolerance test (Fig. 7B). Western blotting analyses confirmed a lack of CDK2 expression in Cdk2-pKO islets (Fig. 7C) and glucose-stimulated insulin secretion was severely blunted in these Cdk2-pKO islets ex vivo (Fig. 7D). Analyses were performed in Cdk2-pKO mice of both genders, and similar observations were obtained with respect to β-cell secretory defects and glucose intolerance (data not shown). We confirmed these findings in Cdk2-pKO mice generated using a different strain of Pdx1-Cre transgenic mice (22) (data not shown). Furthermore, no changes in glucagon secretion were seen in 2-month-old Cdk2-pKO mice, compared with age- and sex-matched control mice (data not shown).
FIGURE 5.

Analyses of fed and fasting glycemia. Shown are levels of fed glucose in Cdk2-Con and Cdk2-pKO male (A) and female (B) mice (n = 6/group) and levels of fasting glucose in Cdk2-Con and Cdk2-pKO male (C) and female (D) mice (n = 6/group). *, p < 0.05, Student's t test. Error bars, S.D.
FIGURE 6.
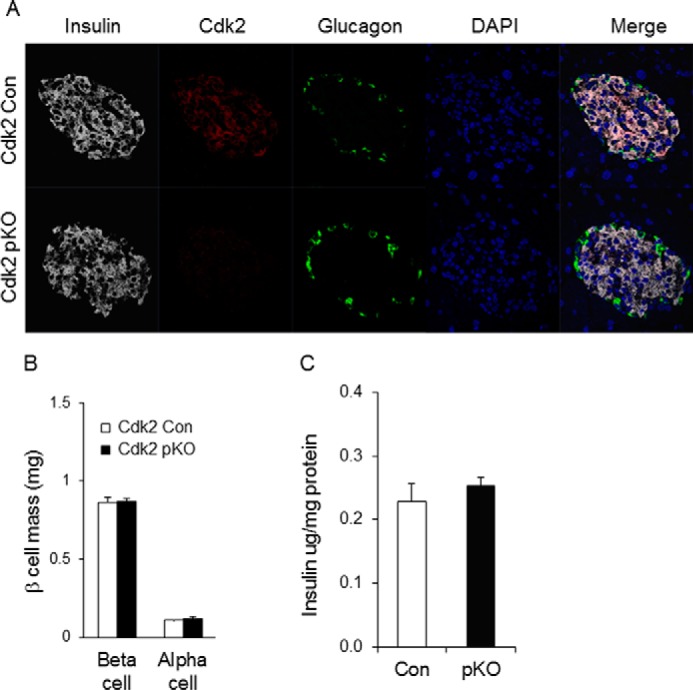
CDK2 loss does not affect young adult pancreas development. A, immunofluorescence of insulin (white), CDK2 (red), and glucagon (green) expression in the pancreas of 2-month-old Cdk2-Con and Cdk2-pKO mice. B, morphometry analysis of α- and β-cell mass in the pancreas of 2-month-old Cdk2-Con (open bars) and Cdk2-pKO (closed bars) male mice (n = 8 mice/genotype; 2 sections/mouse). C, pancreatic insulin content was measured by ELISA from 2-month-old male Cdk2-WT (Con, open bar, n = 3) and Cdk2-pKO (pKO, closed bar, n = 3) mice. Total pancreatic insulin content was normalized to total pancreatic protein. Error bars, S.D.
FIGURE 7.
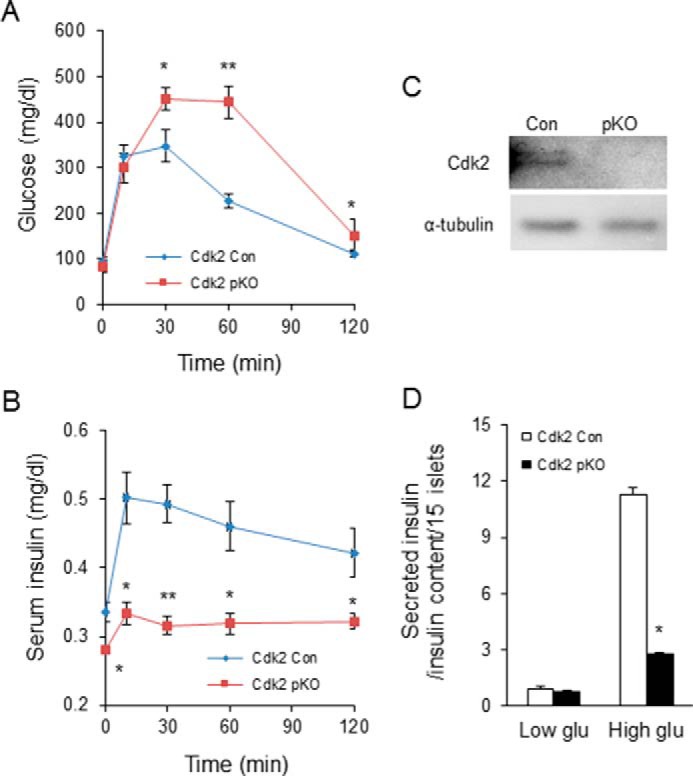
β-Cell dysfunction upon CDK2 deletion. Shown are GTT (A) and serum insulin levels (B) during the GTT in 2-month-old male Cdk2-Con (diamonds) and Cdk2-pKO (squares) mice (n = 7 in each genotype). C, Western blotting analyses to compare CDK2 protein expression in islets from Cdk2-WT (Con) and Cdk2-pKO mice. α-Tubulin protein levels are shown as loading control. D, glucose-stimulated insulin secretion under low (3.3 mm) and high (25 mm) glucose condition in Cdk2-Con (open bars) and Cdk2-pKO (closed bars) 2-month-old male mice islets (n = 15 islets/pancreas harvested from five mice of each genotype). Insulin secretion is normalized by total cellular insulin content of islets. The data comprises results derived from three independent experiments. Statistical analysis was performed with Student's t test; *, p < 0.05; **, p < 0.001. Error bars, S.D.
Consistent with these data, incubating primary cultures of wild-type mouse islets (Fig. 8A) or non-diabetic human islets (Fig. 8, B and C) and insulin-secreting MIN6 β-cells (Fig. 8, D and E) with a CDK2 inhibitor (CDK2i; SU9516) (24) or shRNA knocking down CDK2 expression (Fig. 8F) suppressed glucose-stimulated insulin secretion while preserving insulin content. Taken together, these results suggest that the loss of CDK2 significantly compromised β-cell insulin secretory function.
FIGURE 8.

Reduced glucose-stimulated insulin secretion upon CDK2 inhibition. A and B, insulin secretion in normal wild-type male mouse islets (A) and islets from non-diabetic human cadaver donors (B) (n = 2; done in triplicates) after either DMSO vehicle treatment (open bars) or CDK2i treatment (5 μm; closed bars) for 2 h (mouse islet; A) or 48 h (human islet; B) under low (3.3 mm) and high (25 mm) glucose conditions. C, 40 islets/group from an independent non-diabetic human cadaver donor were incubated with DMSO or CDK2i (5 μm) for 48 h. After 48 h of incubation, the islets were starved with KRBB for 1 h, and then the islets were challenged with 11 or 25 mm glucose for another 30 min. The buffers after 1-h starvation and 30-min glucose stimulation were collected for insulin secretion, and the islets were harvested for insulin content. The data represent the mean ± S.D. (error bars) from two independent experiments. Statistical analysis was performed with Student's t test. #, comparison between 0 and 11 or 25 mm, p < 0.05; *, comparison between DMSO-treated control group and CDK2i-treated group, p < 0.05; **, p < 0.001. D and E, insulin secretion in MIN6 cells challenged with either 25 mm glucose (D) or 11 mm glucose (E) for 30 min after CDK2i (5 μm) treatment for 2 and 6 h. The data represent the mean ± S.D. from four independent experiments. F, glucose-stimulated insulin secretion in MIN6 cells infected with shControl (CON) and shCdk2 (shCdk2) lentiviruses. Inset, detection of relative levels of CDK2 protein by Western blotting analyses. α-Tubulin protein levels are shown as loading control. Statistical analysis was performed with Student's t test compared with the DMSO-treated control group. *, p < 0.05.
Impaired Metabolism in β-Cells Lacking CDK2
Levels of insulin transcripts were unchanged in Cdk2-pKO mice at post-natal day 2 (Fig. 4G) or at 2 months of age (Fig. 9). To further study the effect of CDK2 deletion, we analyzed RNA transcripts of a set of genes known to participate in β-cell metabolism and insulin secretion and found that these were significantly reduced by CDK2 deletion. These included glucokinase (GCK), uncoupling protein 2, SNAP25, Kir6.2, and Rab27A (Fig. 9), suggesting that both proximal and distal steps in the β-cell secretory pathway are probably affected by CDK2 deletion. To examine the underpinnings of the insulin secretory defect caused by CDK2 deficiency, we acquired EM images of the pancreatic islets from control and Cdk2-pKO mice (Fig. 10A). Swollen mitochondria appeared clustered near the center of the β-cells from Cdk2-pKO islets, which we quantified as increased mitochondrial volume (proxied by mitochondrial surface area) in Cdk2-pKO β-cells relative to controls (Fig. 10B). There was no significant change in mitochondrial number (21.9 ± 0.7 versus 19.9 ± 0.8 mitochondria/10 μm2 in control and Cdk2-pKO β-cells, respectively; p = 0.085). To examine metabolic function, we monitored the ratio of endogenous NAD(P)H to flavin fluorescence in response to glucose (25). As can be seen in Fig. 10C, Cdk2-pKO islets exhibited a reduced baseline, a slower rise time, and a reduced maximal NAD(P)H/flavin ratio in response to a glucose challenge. Thus, defects in mitochondrial morphology and function contribute to the secretory defect in Cdk2-deficient islets, consistent with a central role of the mitochondria in the triggering and amplifying pathways of insulin secretion (26).
FIGURE 9.
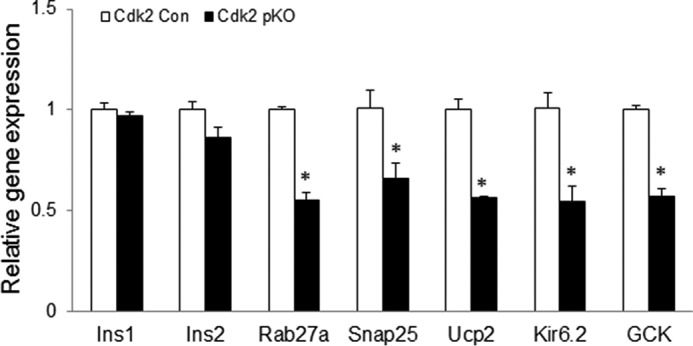
Abnormal expression of β-cell genes due to CDK2 loss. Transcript levels of β-cell genes in Cdk2-Con and Cdk2-pKO mice islets assayed by real-time RT-PCR. All data represent the mean ± S.E. (error bars) of three independent experiments. *, p < 0.05, Student's t test.
FIGURE 10.

Impaired bioenergetics in CDK2-deficient islets. A and B, EM images of islets from 12-week-old control (Cdk2-Con) and Cdk2-pKO (KO) animals (A) were used to determine mitochondrial surface area (B). Averages were determined from eight fields each, 200–500 mm2/field. C, measurement of islet metabolism using endogenous NAD(P)H and flavin autofluorescence (shown as the ratio of NAD(P)H/flavin) in response to 2 and 20 mm glucose, using the indicated number of islets from Cdk2-Con (black trace; n = 3) and Cdk2-pKO (gray trace; n = 3) animals each. Error bars, S.E. ****, p < 0.0001.
CDK2 Phosphorylates FOXO1 in β-Cells in a Glucose-dependent Manner
β-Cell function is regulated by insulin receptor signaling, resulting in the phosphorylation of several downstream transcription factors (27). Although no changes in phosphorylation of the transcription factor AKT were observed in Cdk2-pKO islets (Fig. 11, A and B), significantly reduced glucose-dependent phosphorylation of the transcription factor FOXO1 was observed in these islets at the serine 256 residue (Fig. 11, C and D). We also observed reduced phosphorylation of FOXO1Ser256 in MIN6 cells following incubation with the CDK2 inhibitor (Fig. 11E). Consistent with the hypothesis that FOXO1 inactivation was linked to β-cell failure, the expression levels of two FOXO1 target genes (28), MafA and NeuroD, were significantly down-regulated in the Cdk2-pKO islets (Fig. 11F).
FIGURE 11.

Glucose-dependent association and phosphorylation of FOXO1Ser256 residue by CDK2. A, Western blotting analyses of total and phosphorylated AKT in glucose-deprived (−) and high (25 mm) glucose-exposed islets from 3–4-month-old Cdk2-Con and Cdk2-pKO mice (n = 100 islets from 3 mice/genotype). B, ratio of phosphorylated to total AKT protein shown in A. C, Western blotting analyses of total and phosphorylated FOXO1 proteins in glucose-deprived (−) and high (25 mm) glucose-exposed islets from 3-month-old Cdk2-Con and -KO mice (n = 100 islets from 3 mice/genotype). D, ratio of phosphorylated FOXO1Ser256 to total FOXO1 proteins shown in C. All Western blotting data represent the mean ± S.E. (error bars) of three independent experiments. E, ratio, based on Western blotting analyses, of phosphorylated to total FOXO1 protein under high (25 mm) glucose conditions in MIN6 cells treated with DMSO vehicle (open bars) or CDK2 inhibitor (closed bars) for 2 and 6 h, respectively. All data represent the mean ± S.E. of four independent experiments. F, relative mRNA expression of FOXO1 target genes MafA and NeuroD measured by real-time quantitative RT-PCR analysis in islets from Cdk2-Con (open bars) and Cdk2-pKO (closed bars) mice (n = 100 islets from 3 mice/genotype). All data represent the mean ± S.E. of three independent experiments. G, association of CDK2 and pFOXO1Ser256 by immunoprecipitation (IP) in untreated or 25 mm glucose-treated MIN6 cells using anti-CDK2 antibody or control IgG antibody. H, in vitro CDK2-immunocomplex kinase assays in 25 mm glucose-treated MIN6 cells using an antibody against CDK2 or nonspecific IgG and 3 μg of substrate GST-FOXO1 fusion protein. I, Western blotting analysis of total and phosphorylated FOXO1 under no glucose and high (25 mm) glucose conditions in islets derived from non-diabetic human donors (n = 2; done in triplicates) in the absence or presence of 5 μm CDK2i for 48 h. The Western blotting patterns were similar in triplicate treatment experiments, and the most representative Western blot is shown. J, levels of pFOXO1Ser256, total FOXO1, and CDK2 in non-diabetic human (N1 and N2) and type II diabetic (D1 and D2) human islets under basal glucose conditions. The Western blotting patterns were similar in triplicate Western blots, and the most representative panel is shown. For all Western blotting data, tubulin levels are shown as control for protein loading. All data represent the mean ± S.E. of independent experiments (triplicates). *, p < 0.05; **, p < 0.001; Student's t test.
Co-immunoprecipitation experiments using glucose-stimulated MIN6 cells revealed a physical association between CDK2 and FOXO1Ser256 proteins (Fig. 11G). The CDK2-FOXO1Ser256 interaction was not observed in the absence of glucose, despite a high level of total FOXO1 protein being present, suggesting that the association of CDK2 with phosphorylated FOXO1Ser256 was glucose-dependent. To test whether CDK2 directly transfers a phosphate to FOXO1, we assayed kinase activity by immunoprecipitating endogenous CDK2 and exogenous HA-tagged CDK2. The data obtained suggested that efficient CDK2-mediated phosphorylation of FOXO1 (Fig. 11H) and histone H1 (a known CDK2 substrate) occurred (data not shown), supporting the hypothesis that FOXO1 is a substrate of CDK2 in β-cells. Moreover, a CDK2-dependent, glucose-stimulated phosphorylation of FOXO1Ser256 was also seen in normal human islets, and FOXO1Ser256 phosphorylation was reduced by the CDK2 inhibitor in this case (Fig. 11I). Importantly, compared with islets from non-diabetic human donors, reduced CDK2 protein was observed in human islets from type 2 diabetic donors under normal glucose conditions (Fig. 11J). Lower CDK2 levels were mostly associated with reduced levels of FOXO1Ser256 phosphorylation, despite there being abundant total FOXO1 protein present (Fig. 11J).
CDK2 Deficiency Promotes High Fat Diet-induced Diabetes Due to Defects in β-Cell Proliferation and Reduced β-Cell Mass
To test whether metabolic stress might unmask additional roles of CDK2 with respect to β-cell mass and function, control and Cdk2-pKO mice were challenged with a modest high fat diet (HFD) for 8 weeks, a relatively short time compared with the more usual protocol of 14–16 weeks of HFD feeding. We found that this HFD challenge resulted in elevated fasting glucose and significant glucose intolerance in Cdk2-pKO mice compared with littermate Cdk2-WT control mice (Fig. 12A). Furthermore, we observed mild insulin resistance in the Cdk2-pKO mice compared with controls, albeit this effect was only seen during the initial 30 min of insulin injection (Fig. 12B). In contrast, no defect in insulin sensitivity was observed in Cdk2-pKO mice fed a regular diet (data not shown). In addition, the HFD regimen significantly blunted insulin secretion in Cdk2-pKO mice under both low and high glucose conditions (Fig. 12C). Further, treating non-diabetic human islets with the CDK2 inhibitor, with or without the addition of free fatty acids to the culture medium, resulted in significantly reduced insulin secretion (Fig. 12D). These results, taken together, suggest that the loss of CDK2 increases the susceptibility to HFD-induced glucose intolerance, insulin resistance, and β-cell dysfunction.
FIGURE 12.

CDK2 loss promotes high fat diet-induced diabetes due to defective compensatory β-cell proliferation. A and B, glucose tolerance test (A) and insulin tolerance test (B) (percentage of baseline) in 5-month-old male Cdk2-Con (diamonds) and Cdk2-pKO (squares) mice fed an HFD for 8 weeks (n = 5/genotype). HFD feeding was initiated when mice were 3 months old. C, glucose-stimulated insulin secretion assayed in Cdk2-Con (open bars) and Cdk2-pKO (closed bars) HFD-fed islets cultured in low (3.3 mm) and high (25 mm) glucose. Islets derived from male mice (n = 2/genotype) were used in three independent experiments, all done in triplicates. D, insulin secretion in islets from non-diabetic human donors (n = 2; done in duplicates) challenged by 25 mm glucose after 48-h treatment with DMSO vehicle (open bars) or CDK2i (closed bars), without (−) or with (+) a 24-h incubation with free fatty acids (FFA). Data represent two independent experiments using islets harvested from two non-diabetic human cadaver donors. E, representative image of insulin immunofluorescence (red) in pancreatic islets from HFD-fed Cdk2-Con and Cdk2-pKO mice (n = 3/genotype). F, morphometry of β-cell mass in HFD fed Cdk2-Con (open bars) and Cdk2-pKO (closed bars) mice (n = 3/genotype). G and H, co-immunofluorescence analyses of insulin (red) and BrdU (green) (G) and β-cell proliferation percentage (H) showing the number of BrdU-incorporating β-cells expressing insulin+ in HFD-fed male Cdk2-Con (open bars) and Cdk2-pKO (closed bars) mice (n = 3 mice/genotype with an average of 125 islets examined per genotype and at least 3000 β-cells counted for determination of BrdU positivity). All data represent the mean ± S.E. (error bars) of independent experiments. *, p < 0.05; **, p < 0.001; Student's t test.
Interestingly, we also observed abnormal islet architecture in the HFD-fed Cdk2-pKO mouse pancreas, with many disorganized insulin-positive β-cells (Fig. 12E). Consistent with these changes, there was a significant reduction in β-cell mass under these conditions (Fig. 12F). BrdU-labeling studies revealed a significant reduction in β-cell proliferation occurred in the HFD-fed Cdk2-pKO islets (Fig. 12, G and H). These results suggest that CDK2 is important for maintaining β-cell proliferative capacity and preserving β-cell mass in the face of a HFD challenge. In addition, the results imply that deficits in compensatory β-cell proliferation and the resultant decrease in β-cell mass probably contribute to the severe deterioration in glucose tolerance of HFD-fed Cdk2-pKO mice.
Progressive Age-dependent Decline in β-Cell Proliferation and β-Cell Mass Due to CDK2 Deficiency
We hypothesized that the primary insulin secretory defect and glucose intolerance, despite normal β-cell mass, at 2 months of age might compromise β-cell compensatory mechanisms, resulting in reduced β-cell mass and diabetes in older Cdk2-pKO mice. Indeed, a progressive worsening of glucose tolerance was observed in 8-month-old Cdk2-pKO mice (Fig. 13A). Interestingly, whereas young Cdk2-pKO mice had normal fasting glucose (Fig. 7A), older adult Cdk2-pKO mice became hyperglycemic with elevated fasting glucose levels compared with age-matched Cdk2-Con mice (Fig. 13, B and C; also see Fig. 5, C and D). Moreover, compared with age- and sex-matched control mice, Cdk2-pKO mice displayed significantly reduced β-cell mass with advancing age (Fig. 13, D and E). Examination of Cdk2-pKO islets from 2-, 5-, 8-, and 14-month-old mice fed a normal chow diet revealed no difference in the levels of TUNEL+ and insulin+ co-positive cells (data not shown). These data are indicative of no difference in rates of β-cell death in the Cdk2-pKO islets compared with age- and sex-matched controls, thus ruling out apoptosis as a mechanism responsible for the β-cell mass reduction. In contrast, deficits in β-cell proliferation were seen in older Cdk2-pKO mice (Fig. 13, F and G). It is unclear at this time whether this finding reflects (i) the role of CDK2 in β-cell compensation in response to the prevailing insulin secretory defect or (ii) an independent role of CDK2 in β-cell proliferation in older adult islets. In either case, these findings are indicative of an age-associated and progressive worsening of the metabolic phenotype in older Cdk2-pKO mice, in conjunction with deterioration of β-cell proliferation and β-cell mass due to loss of CDK2 in the pancreas.
FIGURE 13.

Persistent β-cell dysfunction followed by secondary defects in β-cell proliferation and reduced β-cell mass in aged Cdk2-pKO mice. A, GTT assessed in regular diet-fed 8-month-old Cdk2-Con (diamonds) and Cdk2-pKO (squares) male mice (n = 4/genotype). Shown is fasting hyperglycemia in 8-month-old (B) and 14-month-old (C) male Cdk2-Con (open bars) and Cdk2-pKO (closed bars) mice (n = 3–4/genotype). Shown are reduced β-cell mass in 8-month-old (D) and 14-month-old (E) Cdk2-Con (open bars) and Cdk2-pKO (closed bars) male mice (n = 5–8/genotype). β-Cell mass was presented as percentage of β-cell area per total pancreatic area. F and G, β-cell proliferation in 8-month-old (F) and 14-month-old (G) Cdk2-Con (open bars) and Cdk2-pKO (closed bars) male mice (n = 3–4/genotype). All data represent the mean ± S.E. (error bars) of independent experiments. *, p < 0.05; Student's t test.
Discussion
Although a combination of β-cell dysfunction and reduced β-cell mass is believed to accelerate type 2 diabetes progression, it is unclear (i) whether the two processes are molecularly linked and (ii) whether a defect in one arm impacts the other in some sequence. Here, we show that the cell cycle kinase, CDK2, links β-cell function and β-cell mass regulation in healthy mice and during diabetes. Loss of CDK2 initially compromises adult β-cell function with defects in insulin secretion due, at least in part, to disturbances in the metabolic response of the β-cell to glucose. Interestingly, the primary β-cell dysfunction and persistent defects in glucose-stimulated insulin secretion unmask a secondary β-cell mass deficiency that is due to reduced β-cell proliferation in the face of overnutrition or with advancing age. CDK2 thus molecularly links a primary defect in β-cell function to a secondary and progressive loss of β-cell mass during diabetes. We propose that one molecular effector of this linkage is FOXO1, which associates with and is phosphorylated by CDK2 in a glucose-dependent manner. Importantly, our findings show that CDK2, like FOXO1, presides over both the regulation of β-cell mass and β-cell function in the context of diabetes.
It is striking that the CDK2-mediated effects on β-cell function that we observed appear to be independent of changes in β-cell mass, at least initially. Instead, CDK2 loss seems to reduce insulin secretion in addition to grossly impairing normal glucose metabolism. Because the redox measurements performed in our study largely reflect mitochondrial processes (25), we cannot state whether this defect reflects glycolytic or mitochondrial dysfunction; however, we did observe corresponding defects in mitochondrial structure. There is some evidence that the control of β-cell mass and β-cell function, specifically insulin secretion, are linked to key transcription factors, such as FOXO1, that can serve as signaling nodes (29). We find that CDK2 binds to and phosphorylates FOXO1 at the Ser256 residue in a glucose-dependent manner. This observation is intriguing, keeping in mind the established role of FOXO1 in metabolic homeostasis, specifically as it pertains to the β-cell (30). FOXO1 regulates β-cell proliferation and prevents β-cell failure by inducing the key β-cell transcription factors NeuroD and MafA (28), and we observe reduced expression of both factors in Cdk2-pKO islets. It is unclear at this time whether phosphorylation by CDK2 is associated with changes in the subcellular location of FOXO1. Glucose-induced phosphorylation of FOXO1-Ser256 is known to require PI3K signaling (31). However, we observed equivalent levels of phospho-AKT in Cdk2-pKO and control islets, suggesting that perhaps CDK2 plays a role downstream of PI3K. It has been shown that CDK2 targets FOXO1 at Ser249 as part of an apoptotic response to DNA damage (32), although we did not observe (i) FOXO1Ser249 phosphorylation or (ii) changes in TUNEL+ apoptosis rates in Cdk2-pKO islets or under conditions of CDK2 inhibition (data not shown).
CDK2 inhibition precluded glucose-dependent FOXO1Ser256phosphorylation in non-diabetic human islets, and reduced CDK2 levels in type 2 diabetic islets were associated with reduced FOXO1Ser256. These results are consistent with the findings of Kulkarni and co-workers (33) that human type 2 diabetic islets have severely reduced CDK2 transcript levels, and islets from mice lacking β-cell insulin receptors also lack CDK2 protein. Further, the analysis of gene expression in laser capture microdissected β-cell-enriched tissue samples from type 2 diabetic cadaver pancreas shows a reduction in CDK2 and FOXO1 transcripts (34). Ablation of FOXO1 in the β-cell promotes β-cell dedifferentiation and consequential β-cell failure, resulting in hyperglycemia and reduced β-cell mass (35). Thus, we propose that CDK2, like FOXO1, regulates both β-cell function and β-cell mass in the context of diabetes pathogenesis. Whether, as with FOXO1, the loss of CDK2 signaling contributes to the β-cell dedifferentiation phenotype in T2D remains to be determined.
Interestingly, we observed reduced β-cell mass in the Cdk2-pKO mice under two conditions: in response to a high fat diet challenge and at advancing age. Under both conditions, we observed further deterioration of glucose tolerance, leading to diabetes. Mice with normal CDK2 are able to evoke compensatory β-cell proliferation in response to metabolic stress and can preserve their β-cell mass, whereas Cdk2-pKO mice fail to do so, resulting in reduced β-cell mass. This is consistent with a study by Rahier et al. (36), who observed a significant reduction in β-cell mass in type 2 diabetes subjects that was correlated to the duration of diabetes. Moreover, it is striking that the decline in β-cell mass that we observed in the metabolically stressed or aged Cdk2-pKO mice happened despite there being normal levels of CDK4, a cell cycle kinase that has a prominent role in β-cell mass regulation (14). Based on this, we infer that β-cell mass compensation in the face of β-cell dysfunction, HFD-induced metabolic stress, and advancing age might be under the purview of CDK2.
We used Pdx1-Cre transgenic mice to target CDK2 in this study. The Pdx1 gene is expressed in prepancreatic endoderm starting at E8.5 in mice. Later in development and in adult pancreas, PDX1 expression becomes more abundant in β cells, with lower level expression detected in acinar cells and other endocrine cells. However, besides marking pancreatic cells, Pdx1 driver alleles cause recombination in the duodenum, stomach, bile duct, inner ear, and regions of the hypothalamus (37–40). We have not investigated whether Pdx1-Cre causes deletion of CDK2 in other cells and as such have not investigated effects of CDK2 loss in other organs. Specifically, we cannot rule out the effects of a possible loss of CDK2 in nutrient-sensing neurons of the hypothalamus contributing to the phenotype described in this study.
The effects of CDK2 loss that we observed in the Cdk2-pKO pancreas were first detectable around 2 months of age. It is possible that related CDKs or other kinases that can regulate insulin secretion successfully compensate for the loss of CDK2 in islets before about 2 months of age. We have previously demonstrated that CDK4 plays an important role in the development, proliferation, and regeneration potential of β-cells, for example (14, 16–18). Further experiments will reveal whether CDK4 or other kinases involved in glucose-stimulated insulin secretion indeed can compensate for the loss of CDK2 in young islets but become progressively unable to do so in older and metabolically challenged islets. It is plausible that the reduced β-cell mass and defective β-cell proliferation that we observed in the older Cdk2-pKO mice reflect the role of CDK2 as an age-dependent regulatory process, wherein the role of CDK2, like that of p16Ink4a, is more prominent in the expansion of the adult β-cell compartment. Expression of p16Ink4a increases in the β-cells of older animals and is associated with β-cell senescence (10) and improved β-cell function (41). Further, a loss of CDK2 in MEFs is similarly associated with cellular senescence (42). It is possible that an age-dependent decline in CDK2 expression and activity contributes to the diabetes pathophysiology typically seen in aging. In that regard, the loss of CDK2, similar to an increase in p16Ink4a expression, would help force β-cells out of the cell cycle and prevent compensatory increases in β-cell proliferation, thereby further exacerbating glucose intolerance and the subsequent development of frank diabetes. If so, CDK2 agonists may prove useful to restore β-cell function and reinitiate β-cell proliferation in the face of metabolic stresses to counter β-cell failure in diabetes.
Experimental Procedures
Mice
Global Cdk2-KO mice were described previously (20). Cdk2flox/flox mice (43) were crossed with two independent strains of Pdx1-Cre mice (22, 23) to generate two lines of pancreas-specific Cdk2-knock-out mice (Cdk2-pKO mice). The Pdx1-Cre line, B6.FVB-Tg(Ipf1-cre)1Tuv/Nci (23), was obtained from the NCI-Mouse Models repository. The Pdx1-Cre strain, STOCK Tg(Pdx1-cre)89.1Dam/Mmucd (22), was obtained from the Mutant Mouse Regional Resource Centers. CDK2 expression and CRE-mediated recombination were confirmed by Western blotting and immunohistochemistry. For the embryonic study, timed mating regimens were performed with E0.5 as the day of discovery of a vaginal plug.
For β-cell proliferation, experiments were performed on age-matched male mice. BrdU was injected (50 mg/kg body weight) intraperitoneally for 6 h in most experiments. Considering that turnover of β-cells is very slow in old mice (44), we used a modified protocol in older mice to study β-cell proliferation rates. Thus, 14-month-old mice were treated with BrdU (2 mg/ml)-containing drinking water for 4 weeks, after which the BrdU-labeled insulin+ cells were counted, and the data are presented as the percentage of BrdU+/insulin+ cells. For high fat feeding studies, Cdk2 wild type (Cdk2-Con) and Cdk2-pKO male mice were fed either regular diet or a high fat diet (fat content by calories 60%; Research Diets Inc., New Brunswick, NJ) for 8 weeks. Body weights were recorded weekly, and glucose and insulin tolerance tests were performed during the last week of the feeding period. Animal protocols were approved by the National Institutes of Health Animal Care and Use Committee.
Islet Isolation and Cell Culture
Islets were isolated after pancreases were digested by liberase RI (0.2 mg/ml; Roche Applied Science) and purified by Histopaque gradient, followed by culture in RPMI with 10% FBS before experiments. MIN6 cells were cultured in DMEM plus 10% FBS. Cells or islets were treated with either DMSO or CDK2 inhibitor (SU9516 (Calbiochem) at a final concentration of 5 μm) or with Cdk2-shRNA lentiviruses, followed by culture in medium without glucose or with 16.7 or 25 mm glucose for determination of insulin secretion. Information on the Cdk2-shRNA sequence was published elsewhere (45).
Human Islet Studies
Islets from previously non-diabetic or type 2 diabetic human cadaver donor pancreases were obtained via the NIDDK-sponsored Integrated Islet Distribution Program (Duarte, CA). Details regarding the human islet batches from donors used in this study are provided in Table 1. Within 24 h of isolation, islets were transferred to fresh islet culture medium. Islets were used for stimulation with CDK2 inhibitor with or without the addition of free fatty acid (FFA).
TABLE 1.
Human pancreatic islet donor information
Islets were provided by the Integrated Islet Distribution Program, City of Hope. NA, information not available from the Integrated Islet Distribution Program.
| Parameter | Non-diabetic subjects |
Type 2 diabetic subjects |
|||
|---|---|---|---|---|---|
| YKJ446 | YIY429 | 1064 | YLO444 | ZAX388 | |
| Source for islets | University of Pennsylvania | University of Miami | University of Illinois | University of Pennsylvania | University of Miami |
| Age (years) | 49 | 52 | 48 | 57 | 55 |
| Gender | Female | Male | Male | Female | NA |
| Height (cm) | 167.4 | 170.2 | 182.90 | 165.1 | NA |
| Weight (kg) | 87.7 | 97.5 | 104.4 | 60 | NA |
| Body mass index (kg/m2) | 31.3 | 33.7 | 31.2 | 22 | 28 |
| Ethnicity/race | White | White | White | White | NA |
| Cause of death | Cerebrovascular/stroke | Cerebrovascular/stroke | Cerebrovascular/stroke | NA | NA |
FFA Preparation, Cell Treatment
FFA/BSA solutions were prepared as described previously (46). For experiments, 0.5 mm FFA (P9767, Sigma) complexed with 1% BSA was used. Nondiabetic human islets were treated with DMSO or CDK2 inhibitor for 48 h, followed by incubation with FFA for an additional 24 h and assayed for glucose-stimulated insulin secretion by ELISA.
Immunostaining
Mouse tissues were harvested, paraffin-sectioned, and immunostained overnight at 4 °C with the following primary antibodies: rabbit anti-PDX1 (Millipore), mouse anti-NKX2.2 (Developmental Studies Hybridoma Bank, University of Iowa), mouse anti-NKX6.1 (Developmental Studies Hybridoma Bank), mouse anti-E-cadherin (BD Biosciences), rabbit anti-CDK2 (Santa Cruz Biotechnology, Inc.), guinea pig anti-insulin (Dako), rabbit anti-glucagon (Dako), and mouse anti-BrdU (Dako). For estimation of β-cell proliferation, mice were injected with BrdU (50 mg/kg of body weight; Sigma-Aldrich) 6 h before being euthanized, and pancreases were harvested and fixed in 4% paraformaldehyde. The relative β- and α-cell area were obtained by immunohistochemistry for insulin and glucagon. Slides were imaged on an LSM 510 confocal microscope (Zeiss) and scanned by ScanScope (Aperio, CA). To estimate the total β-cell mass, the weight of the pancreas was determined, and the percentage of β- or α-cell area with regard to total pancreas area was determined. The absolute mass of the pancreatic β- and α-cells was estimated from the equation, β- or α-cell area/total area = β- or α-cell mass/total pancreas weight (g). Otherwise, we presented the β-cell mass percentage as percentage of β-cell area/total pancreas area. For BrdU incorporation analyses, a minimum of n = 3 age- and sex-matched mice per genotype were used. Averages of 125 islets were examined per genotype with at least 3000 β-cells counted for BrdU positivity to derive the results presented (β-cell proliferation percentage).
Live Cell Imaging of Islet Metabolism
NAD(P)H and flavin fluorescence were excited at 365 and 430 nm, respectively (25), using a TILL Polychrome V monochrometer adjusted for a 15-nm bandwidth (full width at half-maximum) and 10% light output and a ×10 0.3 numeric aperture objective mounted in an Olympus IX-71 inverted microscope. The filter cube contained a 465HSP excitation filter (Omega), 458LP dichroic mirror (Semrock), and D500/100m emission filter (Chroma). Images were collected by a QuantEM512 EM-CCD camera every 5 s under the control of MetaFluor software (Molecular Devices).
Electron Microscopy
We used Cdk2-WT and Cdk2-pKO mice (2-month-old males, n = 3 for each genotype) to harvest pancreatic islets for electron microscopy (EM). Islets preincubated in 3.3 mm glucose were fixed in 2.5% glutaraldehyde, 0.1 m NaH2PO4/Na2HPO4 phosphate buffer (pH 7.2) and washed with PBS. These islets were post-fixed with 1% OsO4 and embedded in Epon812. Ultrathin sections were mounted and stained with uranyl acetate/lead citrate (JEM-1010, Jeol). Ten islet EM sections from each mouse were scanned, and multiple images covering the entire section were acquired for analyses. The sections were randomly scanned at 15–20 different spots per treated group at ×3000. Granule density and mitochondrial area were quantified from the EM images using the Integrated Morphometry Analysis toolkit in MetaMorph (Molecular Devices).
Glucose Tolerance Test and Insulin Tolerance Test
An intraperitoneal glucose tolerance test was carried out after overnight fasting by intraperitoneal injection of 2 g/kg glucose. Blood glucose levels were determined with a glucometer (Buyer) before (0 min) and 10, 15, 30, 60, and 120 min after glucose injection. Serum or plasma insulin and glucagon levels during the intraperitoneal glucose tolerance test were measured with mouse ultrainsulin and glucagon ELISA kits (Alpco). Insulin tolerance tests were performed on regular diet- and HFD-fed mice by intraperitoneal injection of insulin (0.75 units/kg) followed by measurement of blood glucose level at the indicated times.
Glucose-stimulated Insulin Secretion and Insulin Content Measurement
After isolation, 15 similar sized islets from each group were hand-picked under a stereoscope and used for glucose-stimulated insulin secretion. The islets were cultured in Krebs-Ringer bicarbonate buffer (KRBB) without glucose for 30 min and stimulated with KRBB containing 2 or 3.3 mm (low) or 16.7 or 25 mm (high) glucose for 30 min. After glucose stimulation, the buffer was collected to assay levels of glucose-stimulated insulin release by insulin ELISA. MIN6 cells and islets harvested at the end of each experiment were then sonicated in 70% acid-ethanol, and total cellular insulin content was measured by ELISA (Alpco). Insulin secretion values are presented after normalizing to the total cellular insulin content. The y axis represents secreted insulin divided by cellular insulin content in the indicated number of islets. Pancreatic insulin content was measured using total pancreas obtained from 2-month-old male mice (n = 3 of each genotype). The whole pancreas was isolated, homogenized in acid alcohol, and extracted overnight at 4 °C. The solution was centrifuged to remove unhomogenized tissue and neutralized. Insulin content was determined by ELISA. Total pancreatic insulin content was normalized by total pancreatic protein.
Western Blotting and Immunoprecipitation
Protein extracts were prepared from freshly isolated islets, MIN6 cells, and non-diabetic and type II human diabetic islets in lysis buffer. MIN6 cell lysates were subjected to immunoprecipitation with rabbit IgG or rabbit anti-CDK2, followed by immunoblotting with pFOXO1 (Ser256). Antibodies used were pAKT, AKT, pFOXO1 (Ser256), and FOXO1 (Cell Signaling); CDK2 (Santa Cruz Biotechnology); and α-tubulin (Sigma).
In Vitro Kinase Assay
Immunoprecipitations were performed using rabbit IgG-, rabbit anti-CDK2-, or monoclonal anti-HA-labeled cell lysates from MIN6 cells and CDK2-overexpressing MIN6 cells after high glucose challenge. Complexes were adsorbed onto protein G-agarose beads and washed three times in lysis buffer and once in kinase buffer. Beads were resuspended in 20 μl of kinase buffer containing 1 μCi of [γ-32P]ATP. Commercially purified histone H1 (Roche Applied Science) and FOXO1 (Millipore) were incubated with IgG and CDK2 immunoprecipitated from whole-cell extracts equivalent to total protein. Reactions were incubated at room temperature for 30 min, and the kinase reaction was stopped by the addition of 2× sample buffer. Samples were analyzed by SDS-PAGE, followed by autoradiography.
Real-time RT-PCR
Total RNA was prepared from embryonic (E12.5) or post-natal (P2–P10) pancreas or from islets harvested from Cdk2-Con and Cdk2-pKO mice using the RNAqueous®-Micro total RNA isolation kit (Ambion) or the RNeasy minikit (Qiagen). PCRs were performed and analyzed using the Applied Biosystems Fast 7500 real-time PCR system and SDS software. Relative changes were calculated by the comparative ΔΔCt method, in which 18S rRNA was used for normalization. Reactions were performed in triplicate, and relative amounts of cDNA were normalized to 18S rRNA.
Statistical Analysis
All values were expressed as means ± S.E. or mean ± S.D. Student's t test was employed for two-group and multiple comparisons, respectively. p values of <0.05 were considered to represent statistically significant differences.
Author Contributions
S. Y. K. conducted most of the experiments and analyzed the results. J.-H. L. conducted experiments on β-cell mass estimation and other functional studies, and M. J. M. and L. S. S. performed β-cell metabolism experiments and drafted their results. P. K. and X. B. provided the Cdk2KO and Cdk2Flox mice and helped with the shRNA studies. O. G. assisted on mouse phenotyping. S. G. R. conceived the idea for the project and wrote the paper.
Acknowledgments
Human pancreatic islets were provided by the NIDDK/National Institutes of Health-funded Integrated Islet Distribution Program at City of Hope (Duarte, CA). We appreciate the support of Rane laboratory members and thank Alice Franks, Janet Lee, William Jou, Tatyana Chanturiya, Patricia Zerfas, and Xiaojie Zhang for technical support and Arthur Sherman (NIDDK, National Institutes of Health) for advice.
This work was supported by National Institutes of Health (NIH) Grant R01-DK46409 (to L. S. S.); NIH Grants K01-DK101683 and R21-AG050135 and American Diabetes Association Grant 1-16-IBS-212 (to M. J. M.); the Biomedical Research Council of A*STAR (Agency for Science, Technology, and Research), Singapore (to P. K.); and the NIH Intramural Program (to S. G. R.). The authors declare that they have no conflicts with the contents of this article. The content is solely the responsibility of the authors and does not necessarily represent the official views of the National Institutes of Health.
- CDK
- cyclin-dependent kinase
- RB
- retinoblastoma
- E
- embryonic day
- FFA
- free fatty acid
- CDK2i
- Cdk2 inhibitor
- pKO
- pancreas-specific KO
- Con
- control
- HFD
- high fat diet.
References
- 1. Ashcroft F. M., and Rorsman P. (2012) Diabetes mellitus and the beta cell: the last ten years. Cell 148, 1160–1171 [DOI] [PMC free article] [PubMed] [Google Scholar]
- 2. Prentki M., and Nolan C. J. (2006) Islet beta cell failure in type 2 diabetes. J. Clin. Invest. 116, 1802–1812 [DOI] [PMC free article] [PubMed] [Google Scholar]
- 3. Weir G. C., and Bonner-Weir S. (2004) Five stages of evolving beta-cell dysfunction during progression to diabetes. Diabetes 53, S16–S21 [DOI] [PubMed] [Google Scholar]
- 4. Butler P. C., Meier J. J., Butler A. E., and Bhushan A. (2007) The replication of beta cells in normal physiology, in disease and for therapy. Nat. Clin. Pract. Endocrinol. Metab. 3, 758–768 [DOI] [PubMed] [Google Scholar]
- 5. McCarthy M. I. (2010) Genomics, type 2 diabetes, and obesity. N. Engl. J. Med. 363, 2339–2350 [DOI] [PubMed] [Google Scholar]
- 6. Morris A. P., Voight B. F., Teslovich T. M., Ferreira T., Segrè A. V., Steinthorsdottir V., Strawbridge R. J., Khan H., Grallert H., Mahajan A., Prokopenko I., Kang H. M., Dina C., Esko T., Fraser R. M., et al. (2012) Large-scale association analysis provides insights into the genetic architecture and pathophysiology of type 2 diabetes. Nat. Genet. 44, 981–990 [DOI] [PMC free article] [PubMed] [Google Scholar]
- 7. Voight B. F., Scott L. J., Steinthorsdottir V., Morris A. P., Dina C., Welch R. P., Zeggini E., Huth C., Aulchenko Y. S., Thorleifsson G., McCulloch L. J., Ferreira T., Grallert H., Amin N., Wu G., et al. (2010) Twelve type 2 diabetes susceptibility loci identified through large-scale association analysis. Nat. Genet. 42, 579–589 [DOI] [PMC free article] [PubMed] [Google Scholar]
- 8. Satyanarayana A., and Kaldis P. (2009) Mammalian cell-cycle regulation: several Cdks, numerous cyclins and diverse compensatory mechanisms. Oncogene 28, 2925–2939 [DOI] [PubMed] [Google Scholar]
- 9. Hydbring P., Malumbres M., and Sicinski P. (2016) Non-canonical functions of cell cycle cyclins and cyclin-dependent kinases. Nat. Rev. 17, 280–292 [DOI] [PMC free article] [PubMed] [Google Scholar]
- 10. Krishnamurthy J., Ramsey M. R., Ligon K. L., Torrice C., Koh A., Bonner-Weir S., and Sharpless N. E. (2006) p16INK4a induces an age-dependent decline in islet regenerative potential. Nature 443, 453–457 [DOI] [PubMed] [Google Scholar]
- 11. Calbó J., Serna C., Garriga J., Graña X., and Mazo A. (2004) The fate of pancreatic tumor cell lines following p16 overexpression depends on the modulation of CDK2 activity. Cell Death Differ. 11, 1055–1065 [DOI] [PubMed] [Google Scholar]
- 12. McConnell B. B., Gregory F. J., Stott F. J., Hara E., and Peters G. (1999) Induced expression of p16(INK4a) inhibits both CDK4- and CDK2-associated kinase activity by reassortment of cyclin-CDK-inhibitor complexes. Mol. Cell. Biol. 19, 1981–1989 [DOI] [PMC free article] [PubMed] [Google Scholar]
- 13. Jiang H., Chou H. S., and Zhu L. (1998) Requirement of cyclin E-Cdk2 inhibition in p16(INK4a)-mediated growth suppression. Mol. Cell. Biol. 18, 5284–5290 [DOI] [PMC free article] [PubMed] [Google Scholar]
- 14. Rane S. G., Dubus P., Mettus R. V., Galbreath E. J., Boden G., Reddy E. P., and Barbacid M. (1999) Loss of Cdk4 expression causes insulin-deficient diabetes and Cdk4 activation results in beta-islet cell hyperplasia. Nat. Genet. 22, 44–52 [DOI] [PubMed] [Google Scholar]
- 15. Rane S. G., and Reddy E. P. (2000) Cell cycle control of pancreatic beta cell proliferation. Front. Biosci. 5, D1–D19 [DOI] [PubMed] [Google Scholar]
- 16. Lee J. H., Jo J., Hardikar A. A., Periwal V., and Rane S. G. (2010) Cdk4 regulates recruitment of quiescent beta-cells and ductal epithelial progenitors to reconstitute beta-cell mass. PLoS One 5, e8653. [DOI] [PMC free article] [PubMed] [Google Scholar]
- 17. Kim S. Y., and Rane S. G. (2011) The Cdk4-E2f1 pathway regulates early pancreas development by targeting Pdx1+ progenitors and Ngn3+ endocrine precursors. Development 138, 1903–1912 [DOI] [PMC free article] [PubMed] [Google Scholar]
- 18. Kim Y. C., Kim S. Y., Mellado-Gil J. M., Yadav H., Neidermyer W., Kamaraju A. K., and Rane S. G. (2011) RB regulates pancreas development by stabilizing Pdx1. EMBO J. 30, 1563–1576 [DOI] [PMC free article] [PubMed] [Google Scholar]
- 19. Heit J. J., Karnik S. K., and Kim S. K. (2006) Intrinsic regulators of pancreatic beta-cell proliferation. Annu. Rev. Cell Dev. Biol. 22, 311–338 [DOI] [PubMed] [Google Scholar]
- 20. Berthet C., Aleem E., Coppola V., Tessarollo L., and Kaldis P. (2003) Cdk2 knockout mice are viable. Curr. Biol. 13, 1775–1785 [DOI] [PubMed] [Google Scholar]
- 21. Ortega S., Prieto I., Odajima J., Martín A., Dubus P., Sotillo R., Barbero J. L., Malumbres M., and Barbacid M. (2003) Cyclin-dependent kinase 2 is essential for meiosis but not for mitotic cell division in mice. Nat. Genet. 35, 25–31 [DOI] [PubMed] [Google Scholar]
- 22. Gu G., Dubauskaite J., and Melton D. A. (2002) Direct evidence for the pancreatic lineage: NGN3+ cells are islet progenitors and are distinct from duct progenitors. Development 129, 2447–2457 [DOI] [PubMed] [Google Scholar]
- 23. Hingorani S. R., Petricoin E. F., Maitra A., Rajapakse V., King C., Jacobetz M. A., Ross S., Conrads T. P., Veenstra T. D., Hitt B. A., Kawaguchi Y., Johann D., Liotta L. A., Crawford H. C., Putt M. E., et al. (2003) Preinvasive and invasive ductal pancreatic cancer and its early detection in the mouse. Cancer Cell 4, 437–450 [DOI] [PubMed] [Google Scholar]
- 24. Lane M. E., Yu B., Rice A., Lipson K. E., Liang C., Sun L., Tang C., McMahon G., Pestell R. G., and Wadler S. (2001) A novel cdk2-selective inhibitor, SU9516, induces apoptosis in colon carcinoma cells. Cancer Res. 61, 6170–6177 [PubMed] [Google Scholar]
- 25. Merrins M. J., Van Dyke A. R., Mapp A. K., Rizzo M. A., and Satin L. S. (2013) Direct measurements of oscillatory glycolysis in pancreatic islet beta-cells using novel fluorescence resonance energy transfer (FRET) biosensors for pyruvate kinase M2 activity. J. Biol. Chem. 288, 33312–33322 [DOI] [PMC free article] [PubMed] [Google Scholar]
- 26. Ishii H., Sato Y., Takei M., Nishio S., and Komatsu M. (2011) Glucose-incretin interaction revisited. Endocr. J. 58, 519–525 [DOI] [PubMed] [Google Scholar]
- 27. Goldfine A. B., and Kulkarni R. N. (2012) Modulation of beta-cell function: a translational journey from the bench to the bedside. Diabetes Obes. Metab. 14, 152–160 [DOI] [PubMed] [Google Scholar]
- 28. Kitamura Y. I., Kitamura T., Kruse J. P., Raum J. C., Stein R., Gu W., and Accili D. (2005) FoxO1 protects against pancreatic beta cell failure through NeuroD and MafA induction. Cell Metab. 2, 153–163 [DOI] [PubMed] [Google Scholar]
- 29. Talchai C., Lin H. V., Kitamura T., and Accili D. (2009) Genetic and biochemical pathways of beta-cell failure in type 2 diabetes. Diabetes Obes. Metab. 11, 38–45 [DOI] [PubMed] [Google Scholar]
- 30. Cheng Z., and White M. F. (2011) Targeting Forkhead box O1 from the concept to metabolic diseases: lessons from mouse models. Antioxid. Redox Signal. 14, 649–661 [DOI] [PMC free article] [PubMed] [Google Scholar]
- 31. Martinez S. C., Cras-Méneur C., Bernal-Mizrachi E., and Permutt M. A. (2006) Glucose regulates Foxo1 through insulin receptor signaling in the pancreatic islet beta-cell. Diabetes 55, 1581–1591 [DOI] [PubMed] [Google Scholar]
- 32. Huang H., Regan K. M., Lou Z., Chen J., and Tindall D. J. (2006) CDK2-dependent phosphorylation of FOXO1 as an apoptotic response to DNA damage. Science 314, 294–297 [DOI] [PubMed] [Google Scholar]
- 33. Folli F., Okada T., Perego C., Gunton J., Liew C. W., Akiyama M., D'Amico A., La Rosa S., Placidi C., Lupi R., Marchetti P., Sesti G., Hellerstein M., Perego L., and Kulkarni R. N. (2011) Altered insulin receptor signalling and beta-cell cycle dynamics in type 2 diabetes mellitus. PLoS One 6, e28050. [DOI] [PMC free article] [PubMed] [Google Scholar]
- 34. Marselli L., Thorne J., Dahiya S., Sgroi D. C., Sharma A., Bonner-Weir S., Marchetti P., and Weir G. C. (2010) Gene expression profiles of beta-cell enriched tissue obtained by laser capture microdissection from subjects with type 2 diabetes. PLoS One 5, e11499. [DOI] [PMC free article] [PubMed] [Google Scholar]
- 35. Talchai C., Xuan S., Lin H. V., Sussel L., and Accili D. (2012) Pancreatic beta cell dedifferentiation as a mechanism of diabetic beta cell failure. Cell 150, 1223–1234 [DOI] [PMC free article] [PubMed] [Google Scholar]
- 36. Rahier J., Guiot Y., Goebbels R. M., Sempoux C., and Henquin J. C. (2008) Pancreatic beta-cell mass in European subjects with type 2 diabetes. Diabetes Obes. Metab. 10, 32–42 [DOI] [PubMed] [Google Scholar]
- 37. Magnuson M. A., and Osipovich A. B. (2013) Pancreas-specific Cre driver lines and considerations for their prudent use. Cell Metab. 18, 9–20 [DOI] [PMC free article] [PubMed] [Google Scholar]
- 38. Honig G., Liou A., Berger M., German M. S., and Tecott L. H. (2010) Precise pattern of recombination in serotonergic and hypothalamic neurons in a Pdx1-cre transgenic mouse line. J. Biomed. Sci. 17, 82. [DOI] [PMC free article] [PubMed] [Google Scholar]
- 39. Song J., Xu Y., Hu X., Choi B., and Tong Q. (2010) Brain expression of Cre recombinase driven by pancreas-specific promoters. Genesis 48, 628–634 [DOI] [PMC free article] [PubMed] [Google Scholar]
- 40. Wicksteed B., Brissova M., Yan W., Opland D. M., Plank J. L., Reinert R. B., Dickson L. M., Tamarina N. A., Philipson L. H., Shostak A., Bernal-Mizrachi E., Elghazi L., Roe M. W., Labosky P. A., Myers M. G. Jr., et al. (2010) Conditional gene targeting in mouse pancreatic ss-cells: analysis of ectopic Cre transgene expression in the brain. Diabetes 59, 3090–3098 [DOI] [PMC free article] [PubMed] [Google Scholar]
- 41. Helman A., Klochendler A., Azazmeh N., Gabai Y., Horwitz E., Anzi S., Swisa A., Condiotti R., Granit R. Z., Nevo Y., Fixler Y., Shreibman D., Zamir A., Tornovsky-Babeay S., Dai C., et al. (2016) p16-induced senescence of pancreatic beta cells enhances insulin secretion. Nat. Med. 22, 412–420 [DOI] [PMC free article] [PubMed] [Google Scholar]
- 42. Campaner S., Doni M., Hydbring P., Verrecchia A., Bianchi L., Sardella D., Schleker T., Perna D., Tronnersjö S., Murga M., Fernandez-Capetillo O., Barbacid M., Larsson L. G., and Amati B. (2010) Cdk2 suppresses cellular senescence induced by the c-myc oncogene. Nat. Cell Biol. 12, 54–59 [DOI] [PubMed] [Google Scholar]
- 43. Jayapal S. R., Wang C. Q., Bisteau X., Caldez M. J., Lim S., Tergaonkar V., Osato M., and Kaldis P. (2015) Hematopoiesis specific loss of Cdk2 and Cdk4 results in increased erythrocyte size and delayed platelet recovery following stress. Haematologica 100, 431–438 [DOI] [PMC free article] [PubMed] [Google Scholar]
- 44. Teta M., Long S. Y., Wartschow L. M., Rankin M. M., and Kushner J. A. (2005) Very slow turnover of beta-cells in aged adult mice. Diabetes 54, 2557–2567 [DOI] [PubMed] [Google Scholar]
- 45. Kozar K., Ciemerych M. A., Rebel V. I., Shigematsu H., Zagozdzon A., Sicinska E., Geng Y., Yu Q., Bhattacharya S., Bronson R. T., Akashi K., and Sicinski P. (2004) Mouse development and cell proliferation in the absence of D-cyclins. Cell 118, 477–491 [DOI] [PubMed] [Google Scholar]
- 46. Cousin S. P., Hügl S. R., Wrede C. E., Kajio H., Myers M. G. Jr, and Rhodes C. J. (2001) Free fatty acid-induced inhibition of glucose and insulin-like growth factor I-induced deoxyribonucleic acid synthesis in the pancreatic beta-cell line INS-1. Endocrinology 142, 229–240 [DOI] [PubMed] [Google Scholar]