

Abstract
Purpose
To investigate the relationship between optical coherence tomography (OCT)-derived measurements of retinal morphology and visual acuity in patients with neovascular age-related macular degeneration (AMD).
Design
Retrospective cross-sectional study.
Participants
Two hundred sixteen consecutive patients (216 eyes) newly diagnosed with neovascular AMD, who underwent StratusOCT imaging at time of diagnosis.
Methods
Best-corrected Snellen visual acuity was recorded for each patient. Raw exported StratusOCT images for each patient were analyzed using publicly available custom software entitled “OCTOR”, which allows precise positioning of pre-specified boundaries on individual B-scans. Thickness/volume were calculated for morphologic parameters of interest: neurosensory retina, subretinal fluid (SRF), subretinal tissue (SRT), and pigment epithelial detachment (PED).
Main Outcome Measures
OCT-derived measurements of retinal morphology and visual acuity.
Results
An increased total volume of SRT was correlated with decreased visual acuity (r=0.370, P<0.0001). Decreased visual acuity was also modestly correlated with increased thickness of the neurosensory retina at the foveal center point (r=0.245, P=0.0004). No statistically significant association was detected between visual acuity and the total volume of SRF or PED. The association between visual acuity and both the neurosensory retina and the SRT, was stronger for lesions classified as minimally classic or occult on fluorescein angiography. For occult lesions, 20% of the variation in visual acuity could be predicted by a multiple regression model that incorporated age and SRT volume; while, for minimally classic lesions, 62% of the variation in visual acuity could be predicted by a multiple regression model that incorporated age, total neurosensory retinal volume, and total SRT volume.
Conclusions
The presence of increased SRT thickness/volume on OCT, and to a lesser extent increased neurosensory retinal thickness/volume, is associated with decreased visual acuity in neovascular AMD. However, due to the complex pathophysiology of neovascular AMD and, in part, the limitations of StratusOCT, these factors only account for a small degree of the variation in visual acuity which these patients exhibit. The detection of stronger correlations between retinal anatomy and visual acuity is likely to require the use of more advanced imaging modalities.
The advent of anti-angiogenic therapies, such as ranibizumab (Lucentis, Genentech, Inc., South San Francisco, CA) and bevacizumab (Avastin, Genentech), has revolutionized the management of neovascular age-related macular degeneration (AMD) in recent years.1, 2 In parallel with these advances, optical coherence tomography (OCT) has evolved into an important diagnostic tool in the management of patients with macular disease.3 As a result, the efficacy of these new treatments for neovascular AMD is often determined using OCT measurements as a secondary outcome parameter in clinical trials.4, 5 These trials have clearly demonstrated substantial changes in retinal thickness in response to anti-angiogenic therapies; however, the association between changes in retinal thickness and resultant changes in visual acuity remains unclear.5-7 In fact, relatively few studies, in AMD or other disorders, have attempted to examine the correlation between OCT-derived morphologic parameters and visual acuity in a systematic fashion.8, 9
The paucity of studies evaluating the relationship between visual acuity and OCT parameters may be explained, in part, by the inadequacy of the quantitative data provided by the widely used StratusOCT system (Carl Zeiss Meditec, Dublin, CA). StratusOCT provides automated detection of the inner and outer retinal boundaries and, as a result, is useful in providing measurements of retinal thickness in disorders such as diabetic macular edema.8, 10, 11 However, the more complex morphology of neovascular AMD represents a greater challenge to automated image interpretation software, and consequently StratusOCT is unable to provide quantitative information regarding intra-retinal cysts, subretinal fluid (SRF), pigment epithelial detachments (PEDs), and other morphologic characteristics. Furthermore, the limited quantitative information, that is available, is frequently flawed due to inaccurate detection of the inner and outer boundaries of the retina.12, 13 In the absence of accurate measurements of lesion components in neovascular AMD, it may be difficult to elucidate a correlation between OCT parameters and visual acuity.9
In an effort to obtain detailed quantitative information regarding the morphology of neovascular AMD, and to improve the accuracy of retinal thickness measurements, we developed a software tool (entitled “OCTOR”) that allows the user to draw the boundaries of all structures of interest manually. Grading rules and conventions for delineating OCT morphologic features in neovascular AMD, as well as the reproducibility of this approach, have been previously reported.14-16
In this study, we use manual grading of StratusOCT images with OCTOR software to determine the relationship between visual acuity and the morphology of lesions in neovascular AMD.
Materials and Methods
Data Collection
For this retrospective study, clinical and imaging data from all patients diagnosed with neovascular AMD at the Doheny Eye Institute, between January 2004 and December 2007, were collected and reviewed. Approval for data collection and analysis was obtained from the institutional review board of the University of Southern California. The research adhered to the tenets set forth in the Declaration of Helsinki.
For inclusion in the study, eyes were required to have newly diagnosed CNV secondary to AMD, and to have had StratusOCT imaging performed at the time of this initial diagnosis. Patients who had received any prior treatment for neovascular CNV in the study eye, either at the Doheny Eye Institute or at an outside institution, were excluded.
StratusOCT images, utilizing the Radial Lines protocol of 6 high-resolution B-scans (512 A-scans per 6 mm B-scan) on a single StratusOCT machine, were collected. The Fast Macular Scan protocol was used only when photographers were unable to obtain adequate high-resolution images, most commonly in patients with unstable fixation or poor cooperation. Data for each case were exported to disk using the export feature available in the StratusOCT version 4.0 analysis software.
Each patient's best-corrected visual acuity was recorded at the time of initial diagnosis using Snellen visual acuity charts. Other data collected included patient age, gender, and lens status, as well as the details of ocular comorbidity, if present. Color photos and fluorescein angiographic images were obtained for each patient.
Computer-Assisted Grading Software
The software used for OCT analysis (entitled “OCTOR”) was written by Doheny Image Reading Center software engineers to facilitate viewing and manual grading. OCTOR is publicly accessible at http://www.diesel.la (accessed June 18th, 2008) and has been described and validated in previous reports.14-16 This software, which effectively operates as a painting program and calculator, imports data exported from the StratusOCT machine and allows the grader to use a computer mouse to draw various boundaries in the retinal cross-sectional images (Figure 1).
Figure 1.
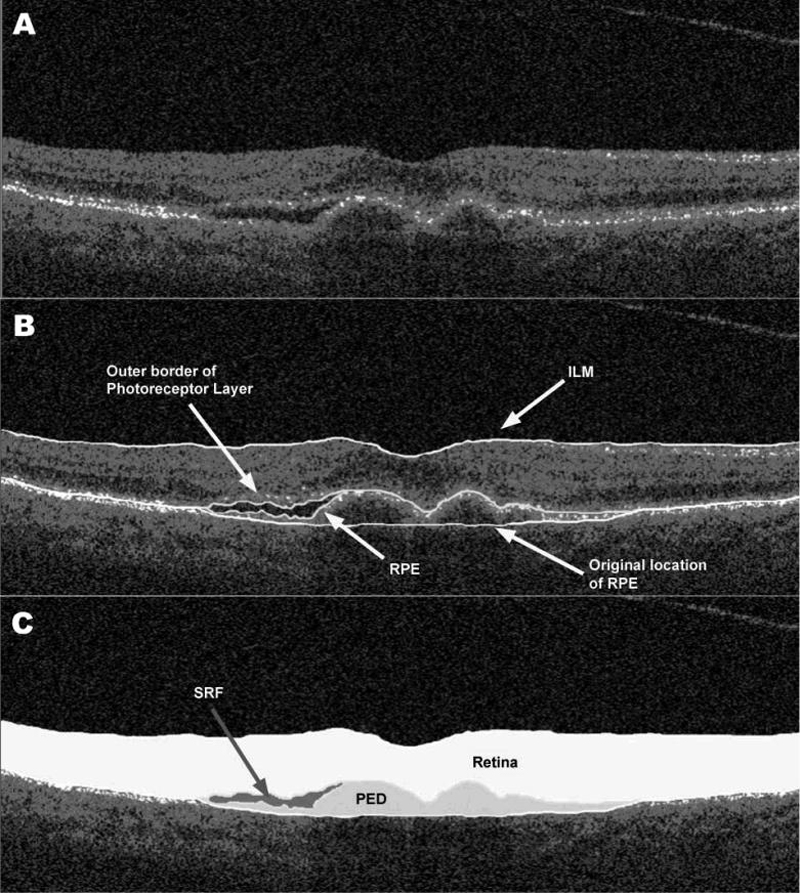
Optical coherence tomography B-scan [A] demonstrating subretinal fluid (SRF) accumulation and pigment epithelial detachment (PED). The clinically relevant boundaries (internal limiting membrane [ILM], outer photoreceptor border, retinal pigment epithelium [RPE], and the estimated normal location of the RPE layer [B]) are graded using OCTOR (computer-assisted manual grading) software, which then computes the volumes of the spaces (retina, SRF, and PED) defined by these boundaries [C].
After the grader draws the required layers in each of the 6 B-scans, the software calculates the distance in pixels between the manually drawn boundary lines for each of the various defined spaces. Using the dimensions of the B-scan image, the calculated pixels are converted into micrometers to yield a thickness measurement at each location. The thickness at all unsampled locations between the radial lines is then interpolated based on a polar approximation to yield a thickness map analogous to the StratusOCT output data. After interpolation, thickness values are converted into volumes (mm3) by multiplying the average thickness measurement by the sampled area. The interpolation algorithm, intergrader reliability, and intragrader reproducibility have previously been validated.14, 15
Analogous to the StratusOCT software, OCTOR provides a report showing the calculated thickness/volume values for the 9 Early Treatment of Diabetic Retinopathy Study macular subfields. The means and standard deviations of the foveal center point thickness are also calculated.
Grading Procedure
OCT scans were analyzed by certified OCT graders at the Doheny Image Reading Center (PAK, SL, KTC), who were masked to associated visual acuity information at the time of grading. Boundaries drawn in each of the 6 OCT B-scans included the internal limiting membrane, outer border of the photoreceptors, borders of SRF and subretinal tissue (SRT) (if present), inner surface of the retinal pigment epithelium (RPE) and estimated normal position of the RPE layer (in cases of RPE elevation). All boundaries were drawn in accordance with the standard OCT grading protocol of the Doheny Image Reading Center.15 All OCT scans included in the study met reading center criteria for sufficient image quality, including the absence of significant artifactitious variations in signal intensity or generalized reductions in signal strength.
After completion of grading, OCTOR was used to calculate output parameters for the various morphologic spaces: retina, SRF, SRT, and PED. In addition, the combined parameters, inner retinal surface height from the RPE (“Height from the RPE” - HRPE) and inner retinal surface height from the choroid (“Height from the choroid” - HC), were also calculated.
Fluorescein angiography images were graded independently by certified graders at the Doheny Image Reading Center (PAK, KTC) using the Treatment of Age-Related Macular Degeneration with Photodynamic Therapy (TAP) Study grading protocol.17 Disagreement regarding angiographic classification of CNV lesion type was resolved by open adjudication.
Statistical Methods
The mean and standard deviation of the foveal center point (FCP) thickness, as well as the total volume (subfields 1-9), were calculated for each space in each case. Volume was measured in cubic millimeters while thickness was measured in micrometers. Snellen visual acuity was converted to logarithm of minimal angle of resolution (logMAR) visual acuity for the purposes of statistical analysis.
Univariate and multivariate regression was used to test for associations between logMAR visual acuity and age, gender, and OCT parameters. SAS programming language (SAS Institute, Cary, NC) was used for all the analyses. Stepwise regression was used for selection of independent parameters where the improvement chi-square p-value was <0.15. Analyses were completed for the whole cohort, and stratified by CNV type.
Results
Patient Enrollment and Follow-Up
216 patients (216 eyes), presenting to the Doheny Eye Institute between January 2004 and December 2007, were newly diagnosed with CNV secondary to AMD, and had StratusOCT imaging performed at the time of initial diagnosis. 7 patients were excluded, as although StratusOCT had been performed at the time of diagnosis, the raw StratusOCT data was unable to be located or exported. 3 patients were excluded from the study as their OCT images were of insufficient quality to permit grading. Therefore, in total, raw exported StratusOCT images were obtained and graded for 206 (of 216) patients. 144 eyes (70%) were imaged on StratusOCT using the Radial Lines scan protocol, while 62 eyes (30%) were imaged on StratusOCT using the Fast Macular Thickness scan protocol.
Baseline Characteristics
Of the 206 patients included in our analysis, 122 (59%) were female, while 84 (41%) were male. The mean age of patients was 81 years (standard deviation [SD] = 7), while the median age was 81 years (range, 58 to 96 years). Mean visual acuity at time of initial diagnosis was 20/146. 95 (46%) patients were pseudophakic at diagnosis of neovascular AMD; 98 (48%) patients had visually insignificant lens opacification, while 13 (6%) patients had visually significant lens opacification. 31 cases had coexisting ocular disease: 16 (8%) glaucoma, 11 (5%) mild non-proliferative diabetic retinopathy, 3 (1%) previous rhegmatogenous retinal detachment surgery, and 1 previous penetrating keratoplasty for pseudophakic bullous keratopathy. The neovascular lesions were categorized by fluorescein angiography as predominantly classic (41 eyes, 20%), minimally classic (26 eyes, 13%), occult with no classic (119 eyes, 58%), and as occult with retinal angiomatous proliferation (RAP) (19 eyes, 9%). Angiographic classification at baseline was unavailable for 1 eye.
Morphologic Outcomes using OCTOR Analysis
The mean thickness of the neurosensory retina at the foveal center point was 301 ± 122 μm, for the total cohort. Neurosensory retinal thickness was greatest for occult with RAP lesions (333 ± 118 μm) and least for occult only lesions (290 ± 129 μm). The total volume of SRF was greatest for minimally classic lesions (0.50 ± 0.84 mm3) and least for occult with RAP lesions (0.23 ± 0.42 mm3). The total volume of SRT was also greatest for minimally classic lesions (0.61 ± 0.74 mm3) and least for occult with RAP lesions (0.12 ± 0.13 mm3). The total volume of PED was greatest for occult only lesions (0.97 ± 1.52 mm3) and least for predominantly classic lesions (0.19 ± 0.49 mm3). OCT morphologic outcomes are summarized in Table 1.
Table 1.
Morphologic Outcomes derived from “OCTOR" Analysis (Mean ± Standard Deviation)
| Total (n=206) | Predominantly Classic (n=41) | Minimally Classic (n=26) | Occult with no Classic (n=119) | Occult with RAP (n=19) | ||
|---|---|---|---|---|---|---|
| Retina | ||||||
| FCP (μm) | 301±122 | 304±100 | 323±126 | 290±129 | 333±118 | |
| Total Vol.(mm3) | 7.98±1.20 | 8.01±1.22 | 8.39±1.54 | 7.81±1.11 | 8.34±1.07 | |
| Subretinal Fluid | ||||||
| FCP (μm) | 32±60 | 26±49 | 57±72 | 31±62 | 4±11 | |
| Total Vol. (mm3) | 0.46±0.65 | 0.49±0.52 | 0.50±0.84 | 0.47±0.67 | 0.23±0.42 | |
| Subretinal Tissue | ||||||
| FCP (μm) | 59±92 | 70±69 | 87±91 | 46±101 | 35±50 | |
| Total Vol. (mm3) | 0.33±0.53 | 0.50±0.50 | 0.61±0.74 | 0.24±0.49 | 0.12±0.13 | |
| Pigment Epithelial Detachment | ||||||
| FCP (μm) | 91±137 | 41±105 | 49±68 | 111±148 | 127±64 | |
| Total Vol. (mm3) | 0.70±1.26 | 0.19±0.49 | 0.43±0.68 | 0.97±1.52 | 0.53±0.84 | |
| Height from the RPE | ||||||
| FCP (μm) | 388±168 | 401±130 | 466±169 | 368±181 | 371±120 | |
| Total Vol. (mm3) | 8.77±1.72 | 9.01±1.75 | 9.50±2.23 | 8.53±1.63 | 8.69±1.07 | |
| Height from the Choroid | ||||||
| FCP (μm) | 479±196 | 442±170 | 515±173 | 479±210 | 498±195 | |
| Total Vol. (mm3) | 9.48±2.30 | 9.20±2.09 | 9.93±2.54 | 9.51±2.42 | 9.23±1.63 | |
RAP = Retinal Angiomatous Proliferation; RPE = Retinal Pigment Epithelium; FCP = Foveal Center Point
Univariate Analysis
The association between visual acuity and each of the OCT parameters is summarized in Table 2. The association between visual acuity and OCT parameters, stratified by angiographic CNV classification, is summarized in Table 3.
Table 2.
Univariate Model of Visual Acuity and Optical Coherence Tomography Predictive Factors
| Factor | Correlation Coefficient, r | Model R2 | Parameter Estimate | P Value | |
|---|---|---|---|---|---|
| Age | 0.136 | 0.02 | 0.00921 | 0.05 | |
| Gender (Male) | 0.026 | 0.0007 | 0.02668 | 0.70 | |
| Foveal Center Point Thickness (μm) | |||||
| Neurosensory Retina | 0.245 | 0.06 | 0.00096 | 0.0004 | |
| Subretinal Fluid | 0.047 | 0.002 | -0.00378 | 0.50 | |
| Subretinal Tissue | 0.269 | 0.07 | 0.00140 | 0.0001 | |
| Pigment Epithelial Detachment | 0.140 | 0.02 | -0.00049 | 0.05 | |
| Height from the RPE | 0.307 | 0.09 | 0.00087 | <0.0001 | |
| Height from the Choroid | 0.166 | 0.03 | 0.00040 | 0.02 | |
| Total Volume (mm3) | |||||
| Neurosensory Retina | 0.196 | 0.04 | 0.07887 | 0.005 | |
| Subretinal Fluid | 0.033 | 0.001 | 0.02479 | 0.63 | |
| Subretinal Tissue | 0.370 | 0.14 | 0.33702 | <0.0001 | |
| Pigment Epithelial Detachment | 0.066 | 0.004 | -0.02495 | 0.35 | |
| Height from the RPE | 0.262 | 0.07 | 0.07342 | 0.0001 | |
| Height from the Choroid | 0.160 | 0.03 | 0.03359 | 0.02 | |
RPE = Retinal Pigment Epithelium
Table 3.
Correlation between Visual Acuity and “OCTOR" Morphologic Outcomes:
| Predominantly Classic (n=41) | Minimally Classic (n=26) | Occult with no Classic (n=119) | Occult with RAP (n=19) | ||
|---|---|---|---|---|---|
| Retina | |||||
| FCP (μm) | 0.192 | 0.431* | 0.239** | 0.230 | |
| Total Vol. (mm3) | 0.045 | 0.440* | 0.241** | 0.229 | |
| Subretinal Fluid | |||||
| FCP (μm) | 0.091 | 0.081 | 0.026 | 0.277 | |
| Total Vol. (mm3) | 0.055 | 0.231 | 0.026 | 0.163 | |
| Subretinal Tissue | |||||
| FCP (μm) | 0.035 | 0.292 | 0.409*** | 0.398 | |
| Total Vol. (mm3) | 0.077 | 0.567** | 0.431*** | 0.00 | |
| Pigment Epithelial Detachment | |||||
| FCP (μm) | 0.049 | 0.126 | 0.179* | 0.069 | |
| Total Vol. (mm3) | 0.071 | 0.388* | 0.036 | 0.143 | |
| Height from the RPE | |||||
| FCP (μm) | 0.094 | 0.445* | 0.388*** | 0.036 | |
| Total Vol. (mm3) | 0.026 | 0.579** | 0.304*** | 0.166 | |
| Height from the Choroid | |||||
| FCP (μm) | 0.102 | 0.486* | 0.208* | 0.081 | |
| Total Vol. (mm3) | 0.0 | 0.611*** | 0.182* | 0.182 | |
Correlation is significant at the 0.05 level
Correlation is significant at the 0.01 level
Correlation is significant at the 0.001 level
FCP = Foveal Center Point
Neurosensory Retina
The relationship between OCT-derived thickness of the neurosensory retina at the foveal center point and visual acuity is illustrated in Figure 2. On analysis of the entire cohort, visual acuity was modestly associated with both thickness of the neurosensory retina at the FCP (r=0.245, P=0.0004) and total neurosensory retinal volume (r=0.196, p=0.005). When the analysis was stratified by angiographic CNV type, visual acuity was significantly correlated with neurosensory retinal thickness at the FCP for both minimally classic and occult lesions (r=0.431, P=0.03; r=0.239, P=0.009 respectively) but not for predominantly classic or occult with RAP lesions.
Figure 2.
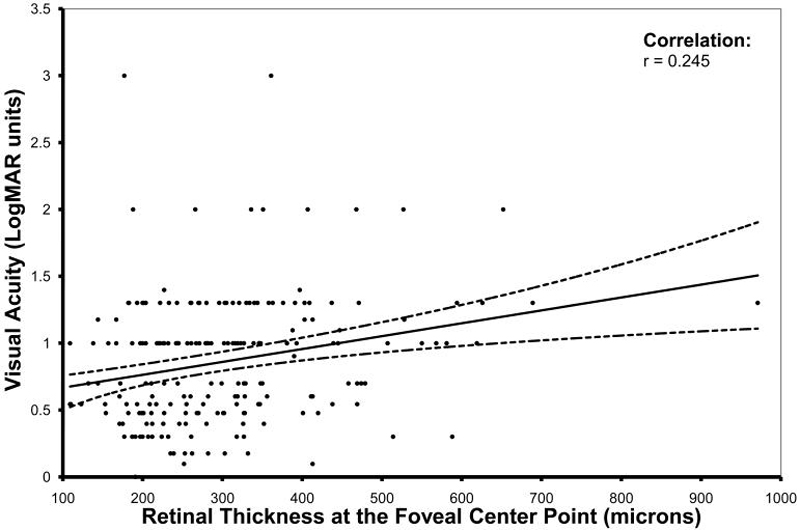
Scatter plot comparing OCT-derived thickness of the neurosensory retina at the foveal center point with visual acuity (logarithm of the minimal angle of resolution - logMAR), in patients newly diagnosed with neovascular age-related macular degeneration. The solid line represents the regression line and the dotted lines represent the 95% confidence interval for the mean.
Subretinal Fluid (SRF)
No statistically significant association was detected between SRF and visual acuity for the entire cohort, or when stratified by angiographic CNV type.
Subretinal Tissue (SRT)
Visual acuity demonstrated a statistically significant correlation with thickness of SRT at the FCP (r=0.269, P=0.0001) and with the total volume of SRT present (r=0.370, P<0.0001). When stratified by angiographic CNV subtype, visual acuity was significantly correlated with total volume of SRT for both minimally classic and occult lesions (r=0.567, P=0.003; r=0.431, P<0.0001 respectively) but not for predominantly classic or occult with RAP lesions.
Pigment Epithelium Detachment (PED)
The total volume of PED was not significantly correlated with visual acuity for the entire dataset. A weak negative correlation was detected between thickness of PED at the FCP and visual acuity (r=0.140, P=0.05), which was also observed for occult lesions (r=0.179, P=0.05). Stratification by angiographic CNV type revealed no association between visual acuity and the total PED volume except in the case of minimally classic lesions (r=0.388, P=0.05).
Height from the RPE
Visual acuity displayed a statistically significant correlation with the FCP thickness of the combined parameter “Height from the RPE” (r=0.307, P<0.0001), and with the total volume of the “Height from the RPE” (r=0.262, P=0.0001). A similar pattern of correlation was seen for minimally classic and occult subtypes, but not for predominantly classic or occult with RAP lesions.
Height from the Choroid
Visual acuity was weakly associated with FCP thickness of the combined parameter “Height from the Choroid” (r=0.166, P=0.02), and with the total volume of “Height from the Choroid” (r=0.160, P=0.02). A similar pattern of correlation was again seen for minimally classic and occult subtypes, but not for predominantly classic or occult with RAP lesions.
Multivariate OCT Models of Visual Acuity
Multiple regression analysis, with visual acuity as the dependent variable, yielded a number of models, summarized in Table 4. These models had a coefficient of determination (R2) of 0.13 or 0.14 with regard to the entire cohort. Multiple regression with stratification by CNV subtype is summarized for minimally classic and occult only lesions in Table 5. No multivariate models were selected for predominantly classic or occult with RAP subgroups.
Table 4.
Multivariate Models* of Visual Acuity and Optical Coherence Tomography Predictive Factors
| Factor | Partial R2 | Model R2 | Improvement Chi-Square P Value* | |
|---|---|---|---|---|
| Model 1: FCP Thickness (μm) | 0.126 | |||
| Subretinal Tissue | 0.0722 | 0.0001 | ||
| Neurosensory Retina | 0.0365 | 0.005 | ||
| Age | 0.0173 | 0.05 | ||
| Model 2: Total Volume (mm3) | 0.140 | |||
| Subretinal Tissue No other variables significant | 0.140 | <0.0001 |
Stepwise regression was used to select the variables that were independently associated with visual acuity
FCP = Foveal Center Point
Table 5.
Multivariate Models* of Visual Acuity and Optical Coherence Tomography Predictive Factors Stratified by Angiographic Classification
| Factor | Partial R2 | Model R2 | Improvement Chi-Square P Value* | |
|---|---|---|---|---|
| Model 1a - Minimally Classic FCP Thickness (μm) | 0.4288 | |||
| Age | 0.3031 | 0.0001 | ||
| Neurosensory Retina | 0.0669 | 0.005 | ||
| Subretinal Tissue | 0.0587 | 0.05 | ||
| Model 1b - Minimally Classic Total Volume (mm3) | 0.6215 | |||
| Subretinal Tissue | 0.3218 | 0.003 | ||
| Neurosensory Retina | 0.2150 | 0.003 | ||
| Age | 0.0847 | 0.04 | ||
| Model 2a - Occult FCP Thickness | 0.1906 | |||
| Subretinal Tissue | 0.1674 | <0.0001 | ||
| Age | 0.0232 | 0.07 | ||
| Model 2b - Occult Total Volume (mm3) | 0.2006 | |||
| Subretinal Tissue | 0.1857 | <0.0001 | ||
| Age | 0.0150 | 0.14 |
Stepwise regression was used to select the variables that were independently associated with visual acuity
FCP = Foveal Center Point
Discussion
In this retrospective cross-sectional study, we use manual grading with OCTOR software to demonstrate a modest, but statistically significant, correlation between visual acuity and OCT-derived measurements of retinal morphology, in patients newly diagnosed with neovascular AMD.
OCTOR analysis of the neurosensory retina revealed a limited correlation with visual acuity; namely that an increased retinal thickness at the foveal center, or an increased total retinal volume, were associated with a decreased visual acuity at the time of initial diagnosis. Retinal thickness/volume may increase when extension of a CNV lesion causes disruption of the photoreceptor-external limiting membrane complex in the outer retina, and consequently leads to accumulation of intraretinal fluid in the form of focal cystoid spaces or diffuse sponge-like retinal edema.18, 19 Previous studies have provided evidence of a link between the presence of cystoid macular edema and decreased visual acuity in neovascular AMD.20 Furthermore, clinical trials of anti-angiogenic agents for the treatment of this disorder, have reported an association between reduction in central retinal thickness of the macula and improvement in visual acuity.5, 21, 22 Despite these observations, the magnitude of correlation detected in this study was relatively underwhelming. One explanation for this finding may be the association between CNV and atrophy of the neurosensory retina and RPE.23 The presence of geographic atrophy (GA) or photoreceptor loss in an eye may sometimes predate the development of CNV in that eye.24 Conversely, on involution CNV may acquire an appearance similar to that of GA.25 Photoreceptor loss is certainly the final common mechanism of irreversible vision loss in patients with neovascular and non-neovascular AMD. Hence, patients with a thin neurosensory retina and a low total volume may have a significantly worse visual acuity than those with a thickened retina and greater total volume, thus confounding the identification of a straightforward linear correlation between thickness and visual acuity.
OCTOR analysis also showed that increases in SRT thickness at the foveal center, and in the total volume of SRT, were moderately correlated with decreases in visual acuity. SRT is positioned between the neurosensory retina and the RPE and may correspond to Type 2 CNV identified on histology. Since the positioning of this tissue may disrupt communication between the photoreceptors and the RPE, a deleterious effect on visual acuity is not surprising. Progressive organization and fibrosis of the CNV lesion in the subretinal space as part of a wound-healing response,26 can lead to disciform scar formation and a significant permanent reduction in visual acuity. The identification of a robust correlation between SRT and visual acuity is again confounded by the complex pathophysiology of neovascular AMD. We assigned the generic label “subretinal tissue” to any hyperreflective material in the subretinal space, and this may be largely synonymous with fibrovascular tissue. However, on StratusOCT it is sometimes difficult to distinguish fibrovascular tissue from other material in the subretinal space such as hemorrhage, lipid, or thick fibrin. These latter materials are clinically apparent markers of CNV leakage, which may be more commonly seen in acute phases of neovascular AMD,17 and which may not be associated with as profound or as permanent a reduction in visual acuity as that which occurs later in the disease course with disciform scar formation.
SRF is often combined with the neurosensory retina by the StratusOCT segmentation software when calculating thickness measurements, whereas OCTOR software allows separate quantification of this potentially clinically useful parameter.13, 14 On OCTOR analysis, neither the total volume of SRF, nor the thickness of SRF at the foveal center, was correlated with best-corrected visual acuity. It appears that, in neovascular AMD, the presence of substantial amounts of SRF is not in itself associated with a severe reduction in vision, a finding consistent with some other disorders resulting in serous detachment of the neurosensory retina such as central serous chorioretinopathy.18 Although no significant correlation between SRF and visual acuity was detected in this study, the detection of SRF may still serve as an index of CNV activity and thus prove useful in retreatment regimens for neovascular AMD.5, 7, 27
In this study, visual acuity was also not significantly correlated with the total volume of PED, although a weak negative correlation was found between thickness of PED at the foveal center point and visual acuity. Fluorescein and indocyanine green angiographic studies have shown that PED, whether it be serous, fibrovascular, hemorrhagic or drusenoid, is often associated initially with only minor reduction in visual acuity. Our study did not distinguish between these subtypes, but nevertheless it provides OCT evidence in support of these angiographic studies. The lack of association between PED volume and vision is not surprising as the presence of the PED may not disrupt the photoreceptor-RPE interactions. Although the total quantity of PED detected on OCT at initial diagnosis does not appear to correlate with visual acuity, Bolz et al. have provided preliminary quantitative evidence that PED regression after systemic bevacizumab treatment was correlated with improvement in visual acuity.28
Analysis stratified by CNV type was also performed to investigate the role of angiographic classification in determining the association between visual acuity and OCT parameters. Lesions classified as predominantly classic, or as occult with retinal angiomatous proliferation (RAP), were not found to have any statistically significant correlation between their OCT parameters and the associated visual acuity. However, lesions classified as minimally classic or occult only, were found to have a significant relationship between both neurosensory retinal parameters and SRT parameters, and visual acuity. In fact, on multivariate analysis, the total volume of SRT, combined with the total volume of neurosensory retina and patient age, accounted for 62% of the variability in visual acuity for minimally classic lesions. In the case of occult lesions, total volume of SRT and patient age accounted for 20% of the variability in visual acuity. Histologically CNV lesions classified as occult on the basis of their fluorescein angiographic leakage patterns are thought to correspond to Type 1 (sub-RPE) neovascularization.29 Occult CNV often follows an indolent course, although in many cases it may progress to a minimally classic or predominantly classic angiographic form, with a concomitant decline in visual acuity.30-32 This change in angiographic lesion classification and decrease in visual acuity may be caused by extension of the choroidal new vessel complex through the RPE into the subretinal space,26 resulting in the detection of SRT and increased retinal thickening on OCT. Therefore, our findings appear to be consistent with known clinicopathologic correlations and natural history for both of these lesion subtypes. Caution is required in drawing definitive conclusions about the correlation detected, or lack thereof, due to the smaller number of eyes in each subgroup of the stratified analysis.
A number of other studies have examined the relationship between OCT parameters and visual acuity.33-37 However, the majority of these studies, in neovascular AMD and in other macular disorders, have not examined the relationship in a systematic fashion and, in particular, have not provided statistical information regarding the strength of correlations detected, and thus the degree of variability in visual acuity accounted for by the parameters. The relationship between diabetic macular edema detected on OCT and visual acuity, in contrast, has been evaluated in a more comprehensive manner.8 More recently, Moutray et al, performed the first systematic correlation in neovascular AMD, but failed to find any statistically significant association between distance visual acuity and OCT parameters.9
Our study has a number of advantages over previous OCT studies in neovascular AMD: a larger sample size, the utilization of manual OCTOR grading to quantify the total volume of any morphologic space of interest accurately, and the utilization of a dedicated reading center to provide objective reproducible OCT grading. Our study also has a number of limitations. It is a retrospective cross-sectional study and therefore does not examine the way in which changes in visual acuity correspond to changes in OCT parameters over time. Furthermore, accurate data was not available regarding disease duration, a potentially key determinant of visual acuity in neovascular AMD. The major limitation of our study, however, is the manner in which the visual acuity data were collected - best corrected Snellen visual acuity in a clinical setting and not Early Treatment Diabetic Retinopathy Study (ETDRS) charts with protocol refraction. The majority of large clinical trials for AMD now report visual acuity results using the ETDRS protocols while Snellen results are more commonly seen in smaller retrospective studies. The limitations of visual acuity assessment using Snellen charts are well documented.38, 39 A recent study by Falkenstein et al. has reported that Snellen visual acuity was consistently lower (worse) than the ETDRS visual acuity in patients with AMD, and that this discrepancy was more marked in patients with visual acuity worse than 20/100.40 Therefore any conclusions drawn from Snellen visual acuity results are preliminary at best. The use of ETDRS visual acuities, in the context of a prospective study, would be necessary to validate our findings, and might also facilitate the detection of stronger correlations with OCT parameters.
Although StratusOCT provides excellent axial resolution for delineation of retinal morphology, it is limited by a low scanning speed, and is thus dependent on interpolating algorithms to reconstruct retinal structures. Consequently the Radial Lines and Fast Macular Thickness protocols, used in this study, require these algorithms to reconstruct the majority of the macular surface - a requirement which may further limit the strength of correlations we detected. Newly introduced, higher speed Fourier Domain OCT is less dependent on interpolation than StratusOCT and is likely to allow more accurate reconstruction of three-dimensional retinal pathology.41
In summary, the presence of increased SRT thickness/volume on OCT, and to a lesser extent increased neurosensory retinal thickness/volume, is associated with decreased visual acuity in neovascular AMD. However, due to the complex pathophysiology of neovascular AMD and, in part, the limitations of StratusOCT, these factors only account for a small degree of the variation in visual acuity which these patients exhibit. Even though neurosensory retinal thickening only showed a weak correlation with visual acuity in our dataset, and SRF accumulation showed no correlation, these parameters may still serve as indicators of disease activity. StratusOCT remains a useful clinical tool for the management of neovascular AMD, but the detection of stronger correlations, if present, between retinal anatomy and visual acuity, may require the use of more advanced imaging modalities.
Acknowledgments
Supported in part by NIH Grant EY03040 and NEI Grant R01 EY014375
References
- 1.Rosenfeld PJ, Brown DM, Heier JS, et al. Ranibizumab for neovascular age-related macular degeneration. N Engl J Med. 2006;355:1419–31. doi: 10.1056/NEJMoa054481. [DOI] [PubMed] [Google Scholar]
- 2.Avery RL, Pieramici DJ, Rabena MD, et al. Intravitreal bevacizumab (Avastin) for neovascular age-related macular degeneration. Ophthalmology. 2006;113:363–72. doi: 10.1016/j.ophtha.2005.11.019. [DOI] [PubMed] [Google Scholar]
- 3.Voo I, Mavrofrides EC, Puliafito CA. Clinical applications of optical coherence tomography for the diagnosis and management of macular diseases. Ophthalmol Clin North Am. 2004;17:21–31. doi: 10.1016/j.ohc.2003.12.002. [DOI] [PubMed] [Google Scholar]
- 4.Kaiser PK, Blodi BA, Shapiro H, et al. Angiographic and Optical Coherence Tomographic Results of the MARINA Study of Ranibizumab in Neovascular Age-Related Macular Degeneration. Ophthalmology. 2007;114:1868–75. doi: 10.1016/j.ophtha.2007.04.030. [DOI] [PubMed] [Google Scholar]
- 5.Fung AE, Lalwani GA, Rosenfeld PJ, et al. An optical coherence tomography-guided, variable dosing regimen with intravitreal ranibizumab (Lucentis) for neovascular age-related macular degeneration. Am J Ophthalmol. 2007;143:566–83. doi: 10.1016/j.ajo.2007.01.028. [DOI] [PubMed] [Google Scholar]
- 6.Spaide RF, Laud K, Fine HF, et al. Intravitreal bevacizumab treatment of choroidal neovascularization secondary to age-related macular degeneration. Retina. 2006;26:383–90. doi: 10.1097/01.iae.0000238561.99283.0e. [DOI] [PubMed] [Google Scholar]
- 7.Brown DM, Regillo CD. Anti-VEGF agents in the treatment of neovascular age-related macular degeneration: applying clinical trial results to the treatment of everyday patients. Am J Ophthalmol. 2007;144:627–37. doi: 10.1016/j.ajo.2007.06.039. [DOI] [PubMed] [Google Scholar]
- 8.Browning DJ, Glassman AR, Aiello LP, et al. Relationship between optical coherence tomography-measured central retinal thickness and visual acuity in diabetic macular edema. Ophthalmology. 2007;114:525–36. doi: 10.1016/j.ophtha.2006.06.052. [DOI] [PMC free article] [PubMed] [Google Scholar]
- 9.Moutray T, Alarbi M, Mahon G, et al. Relationships between clinical measures of visual function, fluorescein angiographic and optical coherence tomography features in patients with subfoveal choroidal neovascularisation. Br J Ophthalmol. 2008;92:361–4. doi: 10.1136/bjo.2007.123976. [DOI] [PubMed] [Google Scholar]
- 10.Browning DJ, Fraser CM. The predictive value of patient and eye characteristics on the course of subclinical diabetic macular edema. Am J Ophthalmol. 2008;145:149–54. doi: 10.1016/j.ajo.2007.08.038. [DOI] [PubMed] [Google Scholar]
- 11.Sandhu SS, Birch MK, Griffiths PG, Talks SJ. Short-term effects of focal argon laser treatment in diabetic maculopathy as demonstrated by optical coherence tomography. Retina. 2007;27:13–20. doi: 10.1097/01.iae.0000256657.64240.a1. [DOI] [PubMed] [Google Scholar]
- 12.Ray R, Stinnett SS, Jaffe GJ. Evaluation of image artifact produced by optical coherence tomography of retinal pathology. Am J Ophthalmol. 2005;139:18–29. doi: 10.1016/j.ajo.2004.07.050. [DOI] [PubMed] [Google Scholar]
- 13.Sadda SR, Wu Z, Walsh AC, et al. Errors in retinal thickness measurements obtained by optical coherence tomography. Ophthalmology. 2006;113:285–93. doi: 10.1016/j.ophtha.2005.10.005. [DOI] [PubMed] [Google Scholar]
- 14.Sadda SR, Joeres S, Wu Z, et al. Error correction and quantitative subanalysis of optical coherence tomography data using computer-assisted grading. Invest Ophthalmol Vis Sci. 2007;48:839–48. doi: 10.1167/iovs.06-0554. [DOI] [PubMed] [Google Scholar]
- 15.Joeres S, Tsong JW, Updike PG, et al. Reproducibility of quantitative optical coherence tomography subanalysis in neovascular age-related macular degeneration. Invest Ophthalmol Vis Sci. 2007;48:4300–7. doi: 10.1167/iovs.07-0179. [DOI] [PubMed] [Google Scholar]
- 16.Keane PA, Liakopoulos S, Ongchin SC, et al. Quantitative Subanalysis of Optical Coherence Tomography after treatment with Ranibizumab for Neovascular Age-Related Macular Degeneration. Invest Ophthalmol Vis Sci. 2008 Apr 11; doi: 10.1167/iovs.08-1689. Epub ahead of print. [DOI] [PMC free article] [PubMed] [Google Scholar]
- 17.Barbazetto I, Burdan A, Bressler NM, et al. Photodynamic therapy of subfoveal choroidal neovascularization with verteporfin: fluorescein angiographic guidelines for evaluation and treatment--TAP and VIP report No. 2. Arch Ophthalmol. 2003;121:1253–68. doi: 10.1001/archopht.121.9.1253. [DOI] [PubMed] [Google Scholar]
- 18.Gass JDM. Stereoscopic Atlas of Macular Diseases: Diagnosis and Treatment. 4th ed. Vol. 1. St Louis; Mosby: 1997. pp. 49–70. [Google Scholar]
- 19.Bringmann A, Reichenbach A, Wiedemann P. Pathomechanisms of cystoid macular edema. Ophthalmic Res. 2004;36:241–9. doi: 10.1159/000081203. [DOI] [PubMed] [Google Scholar]
- 20.Ting TD, Oh M, Cox TA, et al. Decreased visual acuity associated with cystoid macular edema in neovascular age-related macular degeneration. Arch Ophthalmol. 2002;120:731–7. doi: 10.1001/archopht.120.6.731. [DOI] [PubMed] [Google Scholar]
- 21.Augustin AJ, Puls S, Offermann I. Triple therapy for choroidal neovascularization due to age-related macular degeneration: verteporfin PDT, bevacizumab, and dexamethasone. Retina. 2007;27:133–40. doi: 10.1097/IAE.0b013e3180323de7. [DOI] [PubMed] [Google Scholar]
- 22.Chen CY, Wong TY, Heriot WJ. Intravitreal bevacizumab (Avastin) for neovascular age-related macular degeneration: a short-term study. Am J Ophthalmol. 2007;143:510–2. doi: 10.1016/j.ajo.2006.10.004. [DOI] [PubMed] [Google Scholar]
- 23.Sunness JS. Choroidal neovascularisation and atrophy. Br J Ophthalmol. 2006;90:398–9. doi: 10.1136/bjo.2005.084830. [DOI] [PMC free article] [PubMed] [Google Scholar]
- 24.Sunness JS, Gonzalez-Baron J, Bressler NM, et al. The development of choroidal neovascularization in eyes with the geographic atrophy form of age-related macular degeneration. Ophthalmology. 1999;106:910–9. doi: 10.1016/S0161-6420(99)00509-6. [DOI] [PubMed] [Google Scholar]
- 25.Sarks J, Tang K, Killingsworth M, et al. Development of atrophy of the retinal pigment epithelium around disciform scars. Br J Ophthalmol. 2006;90:442–6. doi: 10.1136/bjo.2005.083022. [DOI] [PMC free article] [PubMed] [Google Scholar]
- 26.Grossniklaus HE, Green WR. Choroidal neovascularization. Am J Ophthalmol. 2004;137:496–503. doi: 10.1016/j.ajo.2003.09.042. [DOI] [PubMed] [Google Scholar]
- 27.Spaide R. Ranibizumab according to need: a treatment for age-related macular degeneration. Am J Ophthalmol. 2007;143:679–80. doi: 10.1016/j.ajo.2007.02.024. [DOI] [PubMed] [Google Scholar]
- 28.Bolz M, Michels S, Geitzenauer W, et al. Effect of systemic bevacizumab therapy on retinal pigment epithelial detachment. Br J Ophthalmol. 2007;91:785–9. doi: 10.1136/bjo.2006.102467. [DOI] [PMC free article] [PubMed] [Google Scholar]
- 29.Lafaut BA, Bartz-Schmidt KU, Vanden Broecke C, et al. Clinicopathological correlation in exudative age related macular degeneration: histological differentiation between classic and occult choroidal neovascularisation. Br J Ophthalmol. 2000;84:239–43. doi: 10.1136/bjo.84.3.239. [DOI] [PMC free article] [PubMed] [Google Scholar]
- 30.Stevens TS, Bressler NM, Maguire MG, et al. Occult choroidal neovascularization in age-related macular degeneration. A natural history study. Arch Ophthalmol. 1997;115:345–50. doi: 10.1001/archopht.1997.01100150347006. [DOI] [PubMed] [Google Scholar]
- 31.Soubrane G, Coscas G, Français C, Koenig F. Occult subretinal new vessels in age-related macular degeneration. Natural History and early laser treatment. Ophthalmology. 1990;97:649–57. doi: 10.1016/s0161-6420(90)32530-7. [DOI] [PubMed] [Google Scholar]
- 32.Bressler NM, Frost LA, Bressler SB, et al. Natural course of poorly defined choroidal neovascularization associated with macular degeneration. Arch Ophthalmol. 1988;106:1537–42. doi: 10.1001/archopht.1988.01060140705039. [DOI] [PubMed] [Google Scholar]
- 33.Salinas-Alamán A, García-Layana A, Maldonado MJ, et al. Using optical coherence tomography to monitor photodynamic therapy in age related macular degeneration. Am J Ophthalmol. 2005;140:23–8. doi: 10.1016/j.ajo.2005.01.044. [DOI] [PubMed] [Google Scholar]
- 34.Krebs I, Binder S, Stolba U, et al. Optical coherence tomography guided retreatment of photodynamic therapy. Br J Ophthalmol. 2005;89:1184–7. doi: 10.1136/bjo.2005.067389. [DOI] [PMC free article] [PubMed] [Google Scholar]
- 35.Sahni J, Stanga P, Wong D, Harding S. Optical coherence tomography in photodynamic therapy for subfoveal choroidal neovascularisation secondary to age related macular degeneration: a cross sectional study. Br J Ophthalmol. 2005;89:316–20. doi: 10.1136/bjo.2004.043364. [DOI] [PMC free article] [PubMed] [Google Scholar]
- 36.Shah SP, Patel M, Thomas D, et al. Factors predicting outcome of vitrectomy for diabetic macular oedema: results of a prospective study. Br J Ophthalmol. 2006;90:33–6. doi: 10.1136/bjo.2005.072934. [DOI] [PMC free article] [PubMed] [Google Scholar]
- 37.Kim BY, Smith SD, Kaiser PK. Optical coherence tomographic patterns of diabetic macular edema. Am J Ophthalmol. 2006;142:405–12. doi: 10.1016/j.ajo.2006.04.023. [DOI] [PubMed] [Google Scholar]
- 38.Hussain B, Saleh GM, Sivaprasad S, Hammond CJ. Changing from Snellen to LogMAR: debate or delay? Clin Experiment Ophthalmol. 2006;34:6–8. doi: 10.1111/j.1442-9071.2006.01135.x. [DOI] [PubMed] [Google Scholar]
- 39.Kniestedt C, Stamper RL. Visual acuity and its measurement. Ophthalmol Clin North Am. 2003;16:155–70. v. doi: 10.1016/s0896-1549(03)00013-0. [DOI] [PubMed] [Google Scholar]
- 40.Falkenstein IA, Cochran DE, Azen SP, et al. Comparison of Visual Acuity in Macular Degeneration Patients Measured with Snellen and Early Treatment Diabetic Retinopathy Study Charts. Ophthalmology. 2008;115:319–23. doi: 10.1016/j.ophtha.2007.05.028. [DOI] [PMC free article] [PubMed] [Google Scholar]
- 41.Ahlers C, Simader C, Geitzenauer W, et al. Automatic segmentation in three-dimensional analysis of fibrovascular pigment epithelial detachment using high-definition optical coherence tomography. Br J Ophthalmol. 2008;92:197–203. doi: 10.1136/bjo.2007.120956. [DOI] [PubMed] [Google Scholar]