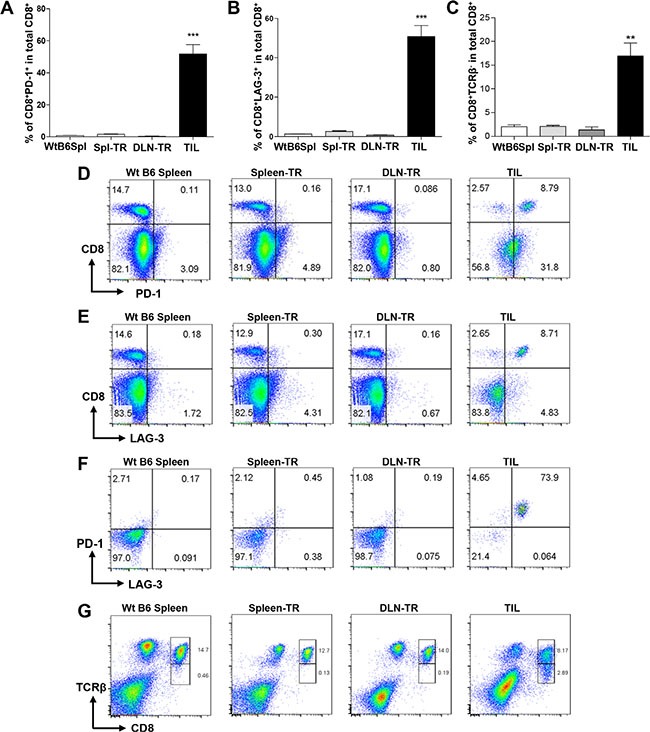
Figure 3. Co-expression of PD-1 and LAG-3 and downregulation of TCRβ in CD8+ TILs.

(A and B) Percentage of CD8+PD-1+ (A) or CD8−LAG-3+ (B) among total CD8+ T cells in different groups. WtB6-spl (n = 3), Spl-TR (n = 6), DLN-TR (n = 6) and TIL (n = 12). Data are presented as mean ± s.e.m. Representative data of 7 independent experiments are shown. (C) Percentage of CD8+TCRβ− among total CD8+ T cells in different groups. WtB6-spl (n = 3), Spl-TR (n = 6), DLN-TR (n = 6) and TIL (n = 6). Data are presented as mean ± s.e.m. Representative data of 2 independent experiments are shown. (D–G) Representative FACS plots are shown for CD8 vs PD-1 (D), CD8 vs LAG-3 (E) PD-1 vs LAG-3 gated on CD8+ (F), CD8 vs TCRβ (G) staining in different groups. Statistical significance was calculated with One-way ANOVA, Tukey's multiple comparison test, ***P ≤ 0.001, **P ≤ 0.01.
