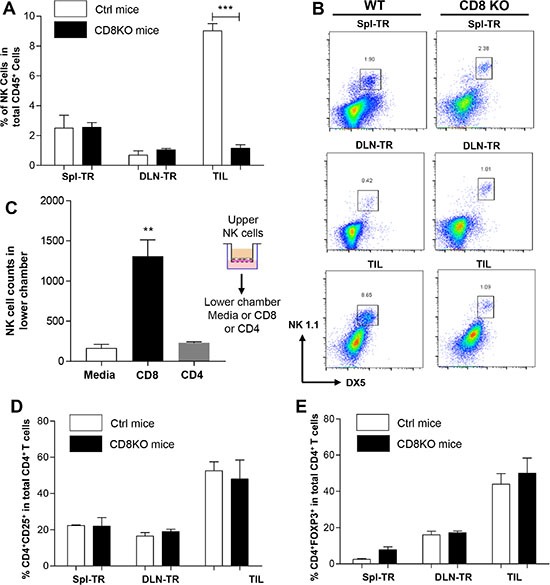
Figure 6. The impact of CD8+ T cells on other populations of TILs.

(A) Percentage of NK cells in CD45+ population in different groups of wt (white bar) or CD8−/− (black bar) recipients. Spl-TR (n = 6), DLN-TR (n = 6) and TIL (n = 6). (B) Representative FACS plots are shown for NK1.1 vs DX5 staining in different groups of wt or CD8−/− recipients. (C) Matrigel invasion assay. NK cells were seeded in upper chambers while lower chambers contained media only (n = 4), CD8+ T cells (n = 4) or CD4+ T cells (n = 4). The total number of NK cells invaded to lower chamber was calculated using flow cytometer. (D and E) Percentage of CD4+CD25+ (D) or CD4+FoxP3+ (E) among total CD4+ T cells in different groups of wt (white bar) or CD8−/− (black bar) recipients. Spl-TR (n = 6), DLN-TR (n = 6) and TIL (n = 6). Representative data are shown from three independent experiments for panel A–E. Statistical significance was calculated with Student's t-test (Graphpad Version 5.01) between two groups as indicated, ***P ≤ 0.001, **P ≤ 0.01.
