Abstract
Two subsets of dendritic cell (DCs), plasmacytoid (p) and myeloid (m) DCs, have been described in humans and mice. These subsets are known to have divergent roles during an immune response, but their developmental course is unclear. Here we report that virus infection induces bone marrow pDCs to differentiate into mDCs, thereby undergoing profound phenotypic and functional changes including the acquisition of enhanced antigen-presenting capacity and the ability to recognize different microbial structures through Toll-like receptor 4. The conversion of pDCs into mDCs is also induced by the injection of double-stranded RNA and requires type I interferons. Our results establish a precursor-product developmental relationship between these two DC subsets and highlight unexpected plasticity of bone marrow pDCs.
Dendritic cells are a crucial element of the immune system that bridges innate and adaptive immunity1,2. Given the important role of DCs in mounting a successful immune response, many immunotherapeutic and vaccination protocols have attempted to take advantage of the unique properties of these cells3–6. As many as six subsets of DCs have been described in mice including mDCs and pDCs, which are also found in humans7. We use the term ‘myeloid’ here to indicate the DC subset that expresses the myeloid marker CD11b; at present, however, it is not clear that these cells are derived from a myeloid origin8–10. By contrast, pDCs do not express CD11b, but instead express the CD45 isoform (B220) that is normally expressed by B cells.
Notably, mDCs and pDCs differ not only in phenotypic markers but also in functional properties4,11. mDCs are potent antigen-presenting cells and are typically associated with T cell activation and the initiation of an adaptive immune response. By contrast, pDCs possess only a modest capacity to activate naive T cells and constitute an essential component of innate immunity by secreting various cytokines and chemokines as well as by participating in the activation of natural killer cells2,11,12. Indeed, pDCs are considered to be a subset of immature DCs that specialize in the secretion of prodigious amounts of type I interferon (IFN) on stimulation by several viruses13–16. In accordance with their discrete roles in shaping an ensuing immune response, mDCs and pDCs express a complementary yet distinct set of TLRs, indicating that they respond differentially to pathogen signatures2,17,18.
Understanding DC development has been more difficult than originally surmised. Both common lymphoid and common myeloid progenitors seem to have the capacity to differentiate into pDCs and mDCs8–10, suggesting that the DC lineage has a developmental flexibility that is much broader than that of other bone marrow–derived leukocytes. At the heart of DC biology, however, is the issue of whether DC subsets are developmentally autonomous or alternatively share a common ancestry and then differentiate in response to environmental stimuli. Resolution of this issue will enable us to harness the maximum potential of DCs for immuno-intervention.
To investigate how virus infection influences DC generation, we have used infection by lymphocytic choriomeningitis virus clone 13 (hereafter referred as LCMV)19–21 in its natural host, the mouse, as a viral model system. We show that virus infection triggers the conversion of pDCs into mDCs. This cell transformation is accompanied by the acquisition of a potent antigen-presenting capacity and the ability to secrete interleukin-12 (IL-12) on stimulation of Toll-like receptor 4 (TLR4). Similarly, injection with double-stranded RNA (dsRNA), a product of viral replication22, induces pDCs to differentiate into mDCs through a mechanism dependent on type I IFNs. Differentiation of pDCs into mDCs occurs in the absence of cell proliferation; in addition, diversity-joining (D-J) rearrangements of the immunoglobulin heavy (IgH) chain genes (and indelible marker of differentiated pDCs23,24) are observed in the resultant pDC-derived mDCs. Collectively, our results show that there is a lineage connection between these functionally distinct subsets of DCs.
RESULTS
Virus infection induces the conversion of pDCs into mDCs
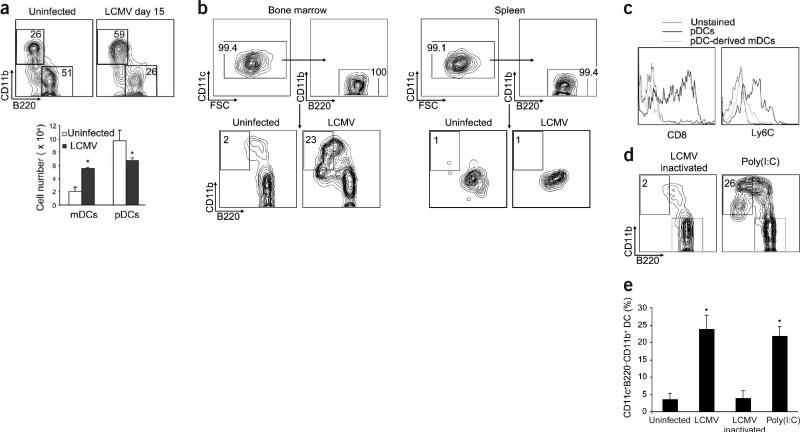
To investigate how virus infection influences DC generation, we first analyzed the frequency of pDCs and mDCs in the bone marrow of virus-infected mice both ex vivo (Fig. 1a) and after expansion in culture with Flt3 ligand (Flt3L; data not shown). Notably, 15 d after infection the bone marrow DC subsets underwent a redistribution, both in absolute numbers and frequencies. Specifically, an increase in the number of mDCs (CD11c+B220− CD11b+) was accompanied by a concomitant decrease in the number of pDCs (CD11c+B220+CD11b−; Fig. 1a). A similar redistribution was observed after bone marrow cells from infected mice were expanded by culturing them in the presence of Flt3L for 4 d (data not shown).
Figure 1.
Virus infection induces bone marrow pDCs to differentiate into mDCs. (a) Total bone marrow cells from uninfected mice or mice infected with LCMV were analyzed by flow cytometry (15 d after inoculation). Shown are representative plots of CD11b versus B220 gated on CD11c+ cells. Percentages in each region indicate the frequency of pDCs (B220+CD11b−) and mDCs (B220−CD11b+). Bar graphs show the absolute numbers of pDCs and mDCs (mean ± s.d.; n = 3 mice per group); significant differences between uninfected and LCMV-infected DC numbers are indicated (*P < 0.05). Similar results were obtained in four independent experiments. (b) FACS-purified bone marrow or spleen pDCs from uninfected or LCMV-infected mice were cultured with Flt3L for 4 d, and differentiation into mDCs was assessed by FACS. Top, purity of the isolated pDCs. Bottom, representative plots of CD11b versus B220 gated on CD11c+ cells from bone marrow and spleen on day 4 after culture. Percentages in each region indicate the frequency of the cells with an mDC surface phenotype. (c) Representative histograms of CD8 and Ly6C expression on pDCs and mDCs obtained from cultures of FACS-purified bone marrow pDCs from LCMV-infected mice. (d) FACS-purified bone marrow pDCs from mice injected with inactivated LCMV or poly(I:C) were treated as in b. (e) Mean frequency (± s.d.) of mDCs obtained with n = 3–10 samples per group (*P < 0.001) in repeated experiments.
A possible explanation for this redistribution in bone marrow DC subsets is that pDCs become programmed to differentiate into mDCs after viral infection. To address this possibility, we isolated purified pDCs (>99% purity) from the bone marrow of both uninfected mice and mice that had been infected with LCMV for 3 d. The expression of the Ly6C and Gr-1 pDC markers15,16 on bone marrow pDCs from infected mice is shown in Supplementary Figure 1 online. Generation of mDCs from these pDCs was then assessed 4 d after incubation with Flt3L.
In cultures of purified bone marrow pDCs obtained from uninfected mice, a low background number of cells showed upregulation of CD11b and downregulation of B220 (Fig. 1b). This number may represent the basal conversion of pDCs into mDCs that occurs under steady-state conditions. Transformation of pDCs was apparent in the same cultures obtained from mice infected with LCMV, as assessed by the substantial proportion of cells that downregulated the defining pDC markers B220, Ly6C and CD8 (Fig. 1b,c) and showed a phenotype resembling mDCs—namely, increased cell size (forward scatter; FSC), granularity (side scatter; SSC), and expression of CD11c (data not shown) and CD11b (Fig. 1b), Notably, we also detected considerable transformation of pDCs into mDCs in cells obtained from the bone marrow of mice infected with the Armstrong (ARM) strain of LCMV (data not shown).
The differentiation of pDCs into mDCs was dependent on virus replication because injection of ultraviolet-inactivated LCMV failed to trigger a marked degree of pDC transformation (Fig. 1d,e). In addition, injection of polyriboinosinic polyribocytidylic acid, poly(I:C), a dsRNA product from the replicative cycle of most viruses22, also induced the differentiation of bone marrow pDCs into mDCs to an extent equivalent to that observed after viral infection (Fig. 1d,e). In agreement with previous studies25, however, splenic pDCs were not converted into mDCs in cells isolated from LCMV-infected (Fig. 1b) or poly(I:C)-injected (Supplementary Fig. 2 online) mice, indicating that the differentiation potential of pDCs is restricted to the bone marrow compartment.
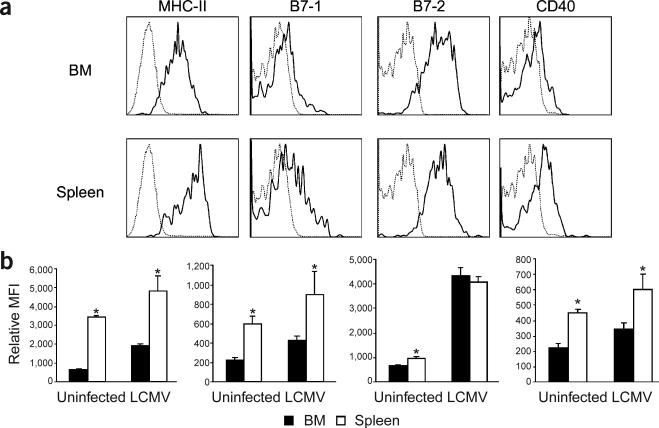
The latter observation might be related to the increased survival and more immature phenotype that has been ascribed to bone marrow pDCs as compared with splenic pDCs15. In support of this possibility, the expression of B7-1, CD40 and major histocompatibility complex (MHC) class II molecules was lower on bone marrow pDCs from uninfected and LCMV-infected mice than on their splenic counterparts (Fig. 2), suggesting that splenic pDCs are more differentiated. Similar results were obtained in comparisons of splenic and bone marrow pDCs from mice injected with poly(I:C) (data not shown). Thus, these data indicate that virus infection induces bone marrow pDCs to differentiate into mDCs.
Figure 2.
Splenic pDCs show a more differentiated phenotype than do bone marrow pDCs. Spleens and bone marrow cells of uninfected mice or mice infected with LCMV were analyzed by flow cytometry. (a) Representative histograms of MHC class II, B7-1, B7-2 and CD40 expression on gated CD11c+B220+CD11b− pDCs from the bone marrow and spleen of LCMV-infected mice. (b) Mean fluorescence intensity (MFI) obtained with n = 4 mice per group (mean ± s.d.; *P ≤ 0.002).
Validation of pDC conversion into mDCs
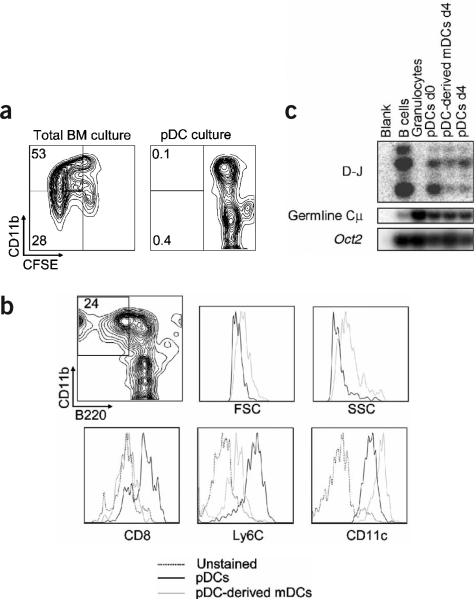
To characterize further the conversion of pDCs into mDCs and to rule out the possibility that the mDCs originated from a contaminating progenitor population, we investigated cell proliferation by staining purified pDCs or total bone marrow cells from poly(I:C)-injected mice with carboxyfluorescein succidimyl ester (CFSE) and monitoring CFSE dilution after 4 d of culture. In contrast to mDCs generated from hematopoietic progenitors present in the total bone marrow compartment (Fig. 3a), mDCs derived from purified pDCs showed no dilution of CFSE, indicating that they were unlikely to be contaminated with a subpopulation of proliferating precursors.
Figure 3.
Cell proliferation and validation of pDCs as precursors of mDCs. (a) Total bone marrow cells or FACS-purified bone marrow CD11c+B220+CD11b− pDCs from mice injected with poly(I:C) were stained with CFSE and cultured with Flt3L for 4 d. Dilution of CFSE on CD11b+ and CD11b− cells was assessed by FACS. (b) FACS-purified bone marrow CD11c+120G8+CD11b− B220+Ly6C+ pDCs were obtained from poly(I:C)-injected mice. Cells were cultured with Flt3L for 4 d, and differentiation into mDCs was assessed by FACS. Left, representative plot from three independent experiments of CD11b versus B220 gated on CD11c+ cells. Right, comparative histograms of FSC, SSC, and CD8, Ly6C and CD11c expression on mDCs and pDCs after 4 d of culture. Percentage in boxed region indicates the frequency of the cells with an mDC surface phenotype. (c) FACS-purified bone marrow CD11c+B220+CD11b− pDCs from poly(I:C)-injected mice were cultured with Flt3L for 4 d, and resorted into pDCs and pDC-derived mDCs. PCR was done on DNA from pDCs on day 0, and from pDCs and pDC-derived mDCs on day 4 after culture using primers for germline Cμ and DH to JH rearrangements. Oct2 genes were amplified as a control for template concentration, B cells were used as a positive control for D-J rearrangements, and granulocytes were used as a negative control.
In addition, the contaminating cells in our pDC preparations (<1%) showed heterogeneous expression of CD11c, B220 and CD11b, suggesting that they constituted a heterogeneous cell population (data not shown). We also calculated that it was mathematically impossible for this small contaminating subpopulation (8 × 10² out of 1 × 10⁵ cells per well) to generate the total number of mDCs found in the pDC cultures after 4 d (1.5 × 10⁴ ± 4.5 × 10³ mDCs after culturing pDCs from poly(I:C)-injected mice) without cell division. Collectively, these data strongly oppose the possibility that the mDCs observed in Figure 1 are derived from a contaminating non-pDC population.
To provide further support for this conclusion, we verified the purity of the isolated pDCs by including two additional pDC markers, Ly6C (ref. 15) and 120G8 (ref. 26; Supplementary Fig. 3 online). In agreement with the results in Figure 1, roughly 25% of highly purified CD11c+B220+CD11b−Ly6C+120G8+ bone marrow pDCs acquired a mDC phenotype after 4 d of culture, as indicated by the increase in FSC and SSC, the upregulation of CD11b and CD11c, and the downregulation of CD8, B220 and Ly6C (Fig. 3b). Analysis of cell proliferation and the recovery of mDCs also ruled out the possibility that the mDCs obtained in these cultures originated from contaminating cells (data not shown).
To establish a molecular link between the pDCs and pDC-derived mDCs, we investigated their lineage origin by evaluating D-J rearrangements of the IgH genes (a signature of differentiated pDCs23,24) on both DC subsets (Fig. 3c). As expected, the controls showed D-J rearrangement for purified bone marrow B cells but no visible band for purified bone marrow granulocytes. In agreement with previous studies, we found D-J rearrangements on bone marrow pDCs on days 0 and 4 after culture. We also detected D-J rearrangements in the mDCs that originated from highly purified pDCs, supporting the idea that these mDCs were derived from pDCs. Taken together, these data show that bone marrow pDCs have the potential to generate mDCs after virus infection and suggest that there is a close developmental relationship between these two DC subsets.
Kinetics of pDC differentiation into mDCs
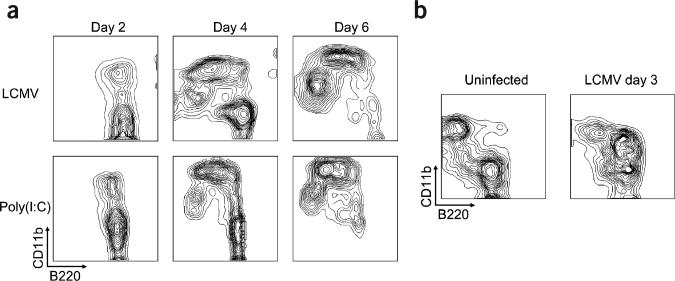
We next determined the kinetics of pDC transformation into mDCs by monitoring the expression of CD11b and B220 on CD11c+ cells on days 2, 4 and 6 after culturing purified pDCs from LCMV-infected or poly(I:C)-injected mice. We found that differentiation of pDCs into mDCs was a two-step process (Fig. 4a), in which CD11b was first upregulated (day 2), and the B220 pDC marker was then down-regulated (days 4 and 6). Notably, the intermediate population (CD11c+CD11b+B220+) observed in the pDC cultures on day 2 was markedly increased ex vivo in the bone marrow of mice injected 3 d earlier with LCMV (Fig. 4b) or poly(I:C) (data not shown). These data delineate the transformation of pDCs into mDCs and show that CD11c+CD11b+B220+ cells represent an intermediate between these two DC subsets.
Figure 4.
Transformation of pDCs into mDCs is a two-step process. (a) FACS-purified bone marrow pDCs from mice injected with poly(I:C) or mice infected with LCMV were cultured with Flt3L, and differentiation into mDCs was assessed by FACS after 2, 4 and 6 d. Data are representative of three independent experiments. (b) Total bone marrow cells from uninfected or LCMV-infected mice were analyzed by flow cytometry for FACS staining. Shown are representative plots from two independent experiments (n = mice per group) of CD11b versus B220 gated on CD11c+ cells.
Functional changes during pDC conversion into mDCs
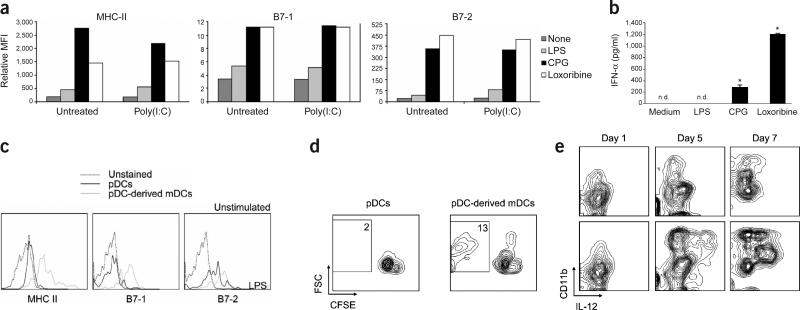
Given that bone marrow pDCs from mice injected with LCMV and poly(I:C) had the capacity to differentiate into mDCs, we examined whether these pDCs possessed the functional properties that characterize pDCs27; namely, a strong response to TLR7 and TLR9 stimulation and a poor response to TLR4 signaling. To evaluate functional responsiveness, we stimulated freshly explanted bone marrow pDCs from untreated or poly(I:C)-injected mice with ligands for TLR4 (lipopolysaccharide, LPS), TLR7 (loxoribine) or TLR9 (CpG-ODN) and determined the expression of MHC class II, B7-1 and B7-2. pDCs from untreated and poly(I:C)-injected mice responded poorly to the TLR4 ligand but strongly to the TLR7 and TLR9 ligands (Fig. 5a).
Figure 5.
Bone marrow pDCs undergo phenotypic and functional changes after differentiation. (a,b) FACS-purified bone marrow pDCs from uninfected mice or mice injected with poly(I:C) 4 d earlier were cultured overnight with medium alone, LPS, CpG-ODN or loxoribine. (a) Mean fluorescence intensity (MFI) of MHC class II, B7-1 and B7-2 molecules determined by FACS. Results are representative of three independent experiments. (b) Concentrations of IFN-α assessed by ELISA in culture supernatants of pDCs from poly(I:C)-injected mice. Results are the mean ± s.d. of duplicate samples (*P < 0.01; nd, not detectable), and are representative of two independent experiments. (c) FACS-purified bone marrow pDCs from poly(I:C)-injected mice were cultured with Flt3L for 4 d. Shown are representative histograms from three independent experiments of MHC class II, B7-1 and B7-2 expression on pDCs and pDC-derived mDCs. (d) Cells treated as in c were resorted into pDCs and pDC-derived mDCs, and then cultured in a mixed lymphocyte reaction with allogeneic CFSE-labeled T cells. Percentages in each region indicate the frequency of proliferating CD3+ T cells. (e) FACS-purified bone marrow pDCs from LCMV-infected mice were cultured for the indicated durations. LPS was added to the cultures 20 h before cell collection, and the amounts of IL-12 produced by CD11b+ cells were determined by flow cytometry. Shown are representative plots from three independent experiments.
Some mDCs share with pDCs the ability to sense stimulation of TLR7 and TLR9; however, a hallmark of pDCs is their capacity to produce high concentrations of type I IFN after TLR signaling15,17,28. Accordingly, pDCs from the bone marrow of poly(I:C)-injected mice secreted substantial amounts of IFN-α on stimulation of TLR7 and TLR9 but not TLR4 (Fig. 5b). Thus, these results support two important conclusions. First, isolated bone marrow CD11c+B220+CD11b− cells correspond to pDCs on the basis of surface phenotype and function. Second, the ability of bone marrow pDCs to differentiate into mDCs does not compromise their capacity to respond to particular pathogen-derived ligands by upregulating the antigen-presenting machinery and producing type I IFN.
The biological significance of the differentiation of pDCs into mDCs lies in the functional specialization that these two DC subsets show in the context of an immune response4. To address whether pDC-derived mDCs acquire an enhanced capacity to present antigens, we first investigated whether this differentiation pathway involved the upregulation of antigen-presenting and costimulatory molecules on the newly generated mDCs. pDC-derived mDCs from poly(I:C)-injected mice expressed considerably more MHC class II, B7-1 and B7-2 than did cells that retained the pDC phenotype (Fig. 5c). Comparable results were obtained from mice infected with LCMV (data not shown). The mDCs also acquired enhanced ability to stimulate both naive T cells in a mixed lymphocyte reaction (Fig. 5d) and naive CD8+ T cells transgenic for the LCMV glycoprotein 33–41 (GP33–41)-specific T cell receptor (TCR) in an in vitro priming assay (data not shown). These data are accord with the heightened antigen-presenting capacity that has been ascribed to the mDC subset14,15,27,29.
One of the most important functional differences between pDCs and mDCs is that the latter can respond robustly to stimulation of TLR4 by secreting IL-12 (ref. 27). To evaluate whether the transformation of pDCs into mDCs involved the acquisition of responsiveness to TLR4 ligand, we cultured pDCs from LCMV-infected mice in the presence of Flt3L for 1, 5 or 7 d (Fig. 5e). The TLR4 ligand, LPS, was added to the cultures for 20 h preceding these collection time points, and IL-12 production was used as a measure of successful stimulation. We found that after 1 d, when no mDCs were present (Fig. 4a), pDCs did not produce IL-12 in response to stimulation with LPS. After 5 and 7 d of incubation, however, when mDCs became a principal component of the cultures, CD11b+ cells strongly responded to LPS stimulation by secreting IL-12. Equivalent results were obtained when cells derived from bone marrow pDCs of poly(I:C)-injected mice were stimulated with LPS (Supplementary Fig. 4 online). Thus, pDC transformation results in the generation of fully functional mDCs that can stimulate naive T cells and produce IL-12 in response to a TLR4 ligand.
pDC conversion results in bona fide mDCs
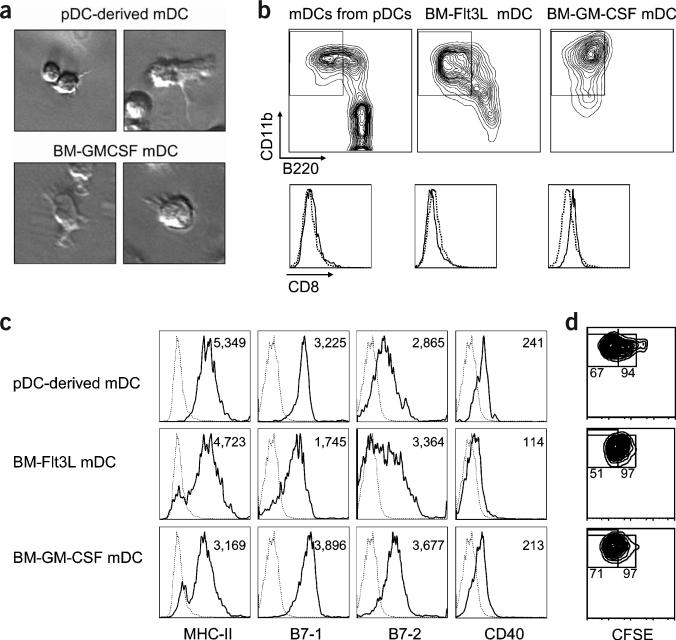
We next examined whether the mDCs originating from pDCs showed a morphology, maturation status and antigen-presenting capacity similar to those of mDCs from different sources—namely, mDCs from total bone marrow cultures supplemented with Flt3L or granulocyte-macrophage colony-stimulating factor (GM-CSF). The mDCs derived from pDCs were similar in morphology to those derived from total bone marrow cultures, as assessed by their irregular cytoplasm and dendritic prolongation (Fig. 6a). In addition, simultaneous comparison of the mDCs from different sources showed that all sets of cells had similar expression of lineage markers, including CD11b, B220, CD8 (Fig. 6b), CD4 and 120G8 (data not shown), and functionally important molecules, such as MHC class II, B7-1, B7-2 and CD40 (Fig. 6c), indicating that they had a comparable phenotype and differentiation stage. Finally, T cell proliferation assay showed that all mDCs, irrespective of their origin, induced a similar proliferation of CD8+ T cells transgenic for the LCMV (GP33–41)-specific TCR (Fig. 6d). Thus, these results clearly support the idea that pDC conversion results in the generation of bona fide mDCs.
Figure 6.
pDC conversion generates bona fide mDCs. FACS-purified bone marrow pDCs from mice injected with poly(I:C) were cultured with Flt3L. In parallel, total bone marrow cells from the same mice were cultured with either Flt3L or GM-CSF. After 4 d, mDCs (CD11c+CD11b+B220−) were purified by FACS. (a) mDCs from different sources show characteristic dendrites. (b) Representative plots of CD11b versus B220 gated on CD11c+ cells and representative histograms of CD8 expression on gated mDCs. (c) Representative histograms from three separate experiments of MHC class II, B7-1, B7-2 and CD40 expression on mDCs. Numbers in each panel represent the mean fluorescence intensity (MFI). In b and c, broken histograms indicate unstained controls. (d) mDCs were cultured with CFSE-labeled LCMV (GP33–41)-specific T cells in the presence of 1 μM GP33–41 peptide. Percentages in the right and left regions indicate the frequency of proliferating T cells and T cells that have undergone more than three divisions, respectively.
Type I IFN induces pDC conversion into mDCs
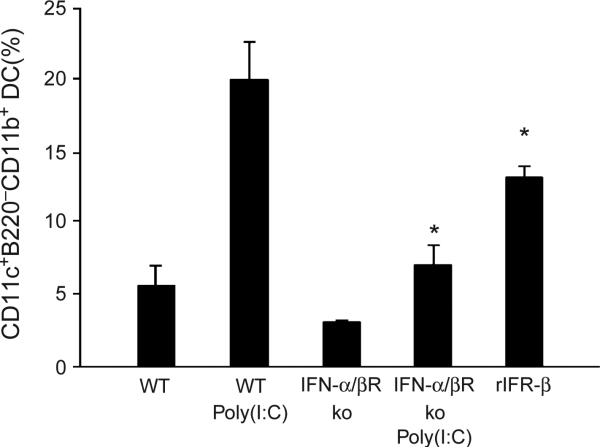
Given that pDCs and mDCs are preferentially associated with innate and adaptive immunity, respectively2,11,12, and that type I IFN is among the best known links between these two arms of the immune system30,31, we considered that this cytokine might participate in the conversion of pDCs into mDCs. To test this hypothesis, pDCs were obtained from untreated or poly(I:C)-injected wild-type mice or mice deficient in the IFN-α and IFN-β receptor (IFN-α/βR) and cultured with Flt3L for 4 d. The percentages of mDCs were then calculated. pDCs from IFN-α/βR–deficient mice showed a significant reduction in the generation of mDCs (P < 0.001; Fig. 7). In support of this observation, the injection of recombinant IFN-β alone into wild-type mice significantly enhanced the ability of bone marrow pDCs to generate mDCs (P < 0.01; Fig. 7). Thus, these data indicate that IFN-α/β signaling has a pivotal role in the differentiation of pDCs into mDCs.
Figure 7.
Differentiation of pDCs into mDCs is dependent on type I IFN. FACS-purified bone marrow pDCs from untreated or poly(I:C)-injected wild-type (WT) or IFN-α/βR–deficient (ko) mice, and from mice treated with recombinant IFN-β (rIFN-β), were cultured with Flt3L, and differentiation into mDCs was assessed by FACS. The frequency of mDCs is shown (mean ± s.d., n = 3; *P < 0.001).
DISCUSSION
The developmental link between pDCs and mDCs is unknown. It is thought that pDCs are developmentally committed and unable to generate conventional non-pDCs either under steady-state conditions or after virus encounter25. This conclusion is derived from studies restricted to splenic pDCs, however, leaving open the possibility that pDCs in the bone marrow, where they represent the main DC subset15, could convert into mDCs. We have shown here that bone marrow pDCs have the capacity to generate fully functional mDCs as a consequence of virus infection. It is likely that the more immature phenotype of bone marrow pDCs15 as compared with splenic pDCs enables them to switch their original developmental commitment and to contribute to generation of the mDC subset. Similarly, it has been reported that B cells and T cells at early stages of their development can redirect their lineage instruction and generate myeloid cells32–34; however, they lose this capacity after they mature and migrate to the periphery.
Our side-by-side comparison of the pDC-derived mDCs and mDCs obtained from traditional sources showed that all sets of mDCs have similar morphologies, antigen-presenting capacities and expression of functionally important molecules, supporting the conclusion that the cells derived from pDCs are bona fide mDCs. Similarities among mDCs originating from different precursors also support the idea that DC subsets can be generated from several sources35, whose contribution may depend on diverse circumstances such as immune compartment, the phase of the immune response, or the type of microbial infection.
The conversion of pDCs into mDCs is in line with several studies conducted in humans. On the basis of the expression of myeloid and lymphoid human markers on pDCs in the blood of normal and Flt3L-treated individuals, it has been proposed that these cells represent a population of lymphoid cells that are undergoing an in vivo conversion into a myeloid cell type36. In addition, individuals diagnosed with pDC-related tumors develop acute chronic myelomonocytic leukemia, suggesting that oncogenic pDC-like cells have the capacity to generate myeloid cells37. A leukemic counterpart of pDCs has been also found to differentiate into cells expressing typical myeloid markers38.
Because mDCs have an enhanced capacity to present antigens and respond to a varied selection of TLR ligands17,18, the generation of this DC subset from pDCs may be beneficial to the host in terms of priming an adaptive immune response. This cell transformation may also represent an important step in the transition from innate into adaptive immunity. An increased understanding of the molecules involved in this pDC conversion may provide tools with which to improve or to attenuate antigen-specific immune responses when treating infections or immunological disorders.
We found that both the clone 13 and ARM (data not shown) strains of LCMV induced the transformation of pDCs into mDCs. Infection of mice with the ARM and clone 13 strains of LCMV results in an acute or persistent infection, respectively19–21. The fact that both isolates of LCMV induce pDC conversion indicates that this cell transformation is probably not related to virus persistence. Coupled with the findings from poly(I:C) treatment, this observation suggests that the conversion of pDCs into mDCs may be a common event during virus infections.
Type I IFN exerts a positive effect on the conversion of pDCs into mDC. We (data not shown) and others11 have found that neither LCMV infection nor poly(I:C) injection triggers the production of type I IFNs by pDCs, indicating that paracrine signaling is probably responsible for pDC transformation. Because mDCs have been reported to secrete IFN-α/β during LCMV infection39, it is conceivable that mDCs participate in an IFN-dependent positive feedback loop aimed at converting pDCs into a subset with sufficient antigen-presenting capacity to trigger adaptive immunity. Studies of the role of IFN regulatory factor-2 and IFN-α/β in the differentiation of mDCs from total bone marrow cells or in vivo40–42 indicate that type I IFN negatively influences the generation of mDCs. Coupled with our observations, these findings suggest that the impact that type I IFN has on mDC generation (either positive or negative) may depend on the cellular context.
Our results contribute to an understanding of the origination of DCs after virus infection and highlight developmental flexibility at the level of the immediate precursors of DCs by establishing a precursor-product relationship between pDCs and mDCs. In addition, they indicate that bone marrow pDCs have a broader functional potential than was previously appreciated. These cells produce large amounts of type I IFN and can generate functionally distinct mDCs. This remarkable developmental plasticity of bone marrow pDCs makes them highly attractive candidates for immunotherapy and vaccination.
METHODS
Viruses
The parental ARM 53b strain of LCMV and the clone 13 variant have been described19,43. Virus stocks were grown, identified and quantified as described elsewhere40.
Mice
We maintained C57BL/6 mice and IFN-α/βR knockout mice on a B6 background in the closed breeding colony of The Scripps Research Institute (TSRI). At 6–8 weeks of age, mice were infected by intravenous inoculation of LCMV (2 × 10⁶ phage-forming units) or were injected with 100 μg of synthetic dsRNA (poly(I:C); InvivoGen) in 200 μl of sterile PBS. For IFN-β treatment, mice were intraperitoneally injected with 10 × 103 units of recombinant IFN-β (Research Diagnostics) every day for 3 d. Unless otherwise stated, mice were killed 3 d after injection. Mouse handling conformed to the requirements of the National Institutes of Health and the TSRI Animal Research Committee.
Cell isolation and purification
Bone marrow cells were isolated by flushing the femurs and tibias of test mice with RPMI medium. The spleens were removed and incubated with collagenase D (1 mg/ml; Roche) for 20 min at 37 °C, and splenocytes were collected by homogenization through a 100-μm tissue strainer. Cells were resuspended in a Tris-NH4Cl buffer for 3 min to lyse red blood cells. For pDC purification, cells were incubated for 30 min with rat monoclonal antibodies (mAbs) specific for murine CD3, CD19, CD11b and Ter-119 (all from E-bioscience) and then sorted by using magnetic beads coated with anti–rat immunoglobulin (Dynal) in accordance with the manufacturer's instructions. In some experiments, we replaced anti-CD11b by anti-Ly6G (1A8) and obtained similar results (data not shown). The pDCs (defined as CD11c+CD11b−B220+ cells) were then separated by a FACS Vantage DiVa II sorter (Becton Dickinson) to obtain a typical purity of more than 99% (Fig. 1b). In some experiments, pDCs were sorted as CD3−CD19−NK1.1−CD11c+CD11b−B220+ cells and similar results were obtained (data not shown). Where indicated (Fig. 3b), pDCs were sorted as CD11c+CD11b−B220+Ly6C+120G8+ cells. We sorted B cells and granulocytes as B220+ and Gr-1+ cells, respectively.
Bone marrow and pDC cultures
For total bone marrow culture, bone marrow cells were plated at 2 × 10⁶ or 2 × 10⁵ cells per ml in RPMI complete medium (10% fetal bovine serum, 2 mM l-glutamine, 100 U/ml of penicillin, 100 μg/ml of streptomycin and 50 μM β-mercaptoethanol) containing 100 ng/ml of Flt3L (Amgen) or 200 IU of GM-CSF, respectively. The GM-CSF–supplemented culture was renewed on day 3, and cultures were collected on day 4. For pDC cultures, 2–3 × 10⁴ (or 100 × 103 where indicated) pDCs were cultured for 4 d (unless otherwise stated) in 200 μl of RPMI complete medium containing 100 ng/ml of Flt3L. To determine the yield of mDCs derived from pDCs, we multiplied the percentage of mDCs determined by flow cytometry on day 4 after culture by the total number of viable cells per well determined by trypan blue staining and counting with a hemocytometer. For pDC stimulation, 1 × 10⁵ cells were cultured overnight in 200 μl of RPMI complete medium in the presence of 20 μg/ml of LPS from Escherichia coli 0127:B8 (Sigma Aldrich), 1 μM CpG-ODN 1668 (TCCATGACGTTCCGATGCT; Integrated DNA Technologies), 1 μM CpG-ODN 1826 (InvivoGen), or 100 μM loxoribine (InvivoGen). For quantification of IFN-α production, we collected and analyzed cell-free supernatants with an enzELISA kit (PBL-Biomedical).
Flow cytometric analysis
Cells were incubated for 15 min with a rat mAb to CD16/32 to block Fc receptors and then with the primary antibodies for 20 min on ice. We used the following mAbs against murine molecules: allophycocyanin (APC)- or phycoerythrin (PE)-conjugated anti-CD11c, fluorescein isothiocyanate (FITC)- or PE-conjugated anti-B220, PECy7- or peridin chlorophyll protein (PerCP)-conjugated anti-CD11b, PE-conjugated anti-Ly6C, APC-conjugated anti-CD8α, PE-conjugated anti-CD86, PE-conjugated anti-CD80, FITC-conjugated anti–MHC class II (I–A), PerCP-conjugated anti-CD3, FITC-conjugated anti–Gr-1, PE-conjugated anti-CD19, PE-conjugated anti-CD3, PE-conjugated anti-NK1.1 and PE-conjugated anti–IL-12 (all from PharMingen or E-bioscience).
Streptavidin-FITC was purchased from PharMingen. Biotinylated anti-120G8 mAb was obtained from A. O'Garra (Division of Immunoregulation, National Institute for Medical Research, London, UK) and G. Trinchieri (Laboratory for Immunological Research, Schering-Plough Research Institute, Dardilly, France). Fluorescent cells were acquired with a FacsSort flow cytometer (Becton Dickinson) and analyzed with FlowJo (Tree Star) software. All FACS data shown are representative of at least three independent experiments and a minimum of 700 events are shown on each plot and histogram.
PCR assay for Ig gene rearrangements
Sorted cells were washed and processed as described24,44. Primers for germline Cμ and for DH to JH rearrangements, and the PCR conditions have been described44. As a control to estimate template concentrations, Oct2 genes were amplified by using described primers and PCR conditions24. Ten microliters of each reaction was run on an agarose gel, transferred to a nylon membrane, and hybridized with specific probes by using standard procedures. We quantified PCR products by using a Molecular Dynamics PhosphoImager.
Proliferation assay
Bone marrow cells collected from uninfected mice or highly purified pDCs (>99% pure) from poly(I:C)- or LCMV-injected mice were labeled with CFSE (Molecular Probes) and then cultured for 4 d in the presence of Flt3L. The CFSE fluorescence from CD11c+CD11b+ and CD11c+CD11b− cells was traced by FACS on FacsSort flow cytometer (Becton Dickinson) and analyzed with FlowJo (Tree Star) software.
Measurement of T cell stimulation
The ability of DC subsets to act as accessory cells for T cell stimulation was assessed in a one-way mixed lymphocyte reaction. The pDCs were cultured in the presence of Flt3L (100 ng/ml) for 4 d. Cells were collected and resorted into CD11c+CD11b−B220+ and CD11c+CD11b+B220− subsets. In parallel, splenic CD8+ T cells were obtained from BALB/c ByJ (H-2d) mice by positive selection using magnetic beads coated with anti-CD8 (Miltenyi Biotec). CD8+ T cells were then labeled with CFSE (Molecular Probes) at 1 μM for 10 min at 37 °C. The level of CFSE fluorescence was evaluated by flow cytometric analysis on day 5 of culture. Alternatively, CD8+ T cells were purified from LCMV (GP33–41)-specific TCR transgenic mice, labeled with CFSE and cultured with DCs in the presence of 1 μM LCMV GP33–41 peptide. T cell proliferation was determined on days 3–4 after culture.
Statistical analysis
Statistical differences were determined by a one-way analysis of variance and a Turkey-Kramer multiple comparison test (P < 0.05).
Supplementary Material
ACKNOWLEDGMENTS
This is publication no. 16635-NP from the Division of Virology, Department of Neuropharmacology, TSRI. We thank A. O'Garra and A. Boonstra for suggestions; Amgen for human recombinant Flt3L; and personnel of the TSRI Flow Cytometry Facility, especially C. Silao, for technical assistance with cell sorting. This work was supported by grants from the US Public Health Service (AI45927 and AI09484). E.I.Z. was supported by Pew Foundation Latin American Fellowship and Fundacion Antorchas.
Footnotes
Supplementary information is available on the Nature Immunology website.
COMPETING INTERESTS STATEMENT
The authors declare that they have no competing financial interests.
References
- 1.Reis e Sousa C. Activation of dendritic cells: translating innate into adaptive immunity. Curr. Opin. Immunol. 2004;16:21–25. doi: 10.1016/j.coi.2003.11.007. [DOI] [PubMed] [Google Scholar]
- 2.Reis e Sousa C. Toll-like receptors and dendritic cells: for whom the bug tolls. Semin. Immunol. 2004;16:27–34. doi: 10.1016/j.smim.2003.10.004. [DOI] [PubMed] [Google Scholar]
- 3.Ardavin C, Amigorena S, Reis e Sousa C. Dendritic cells: immunobiology and cancer immunotherapy. Immunity. 2004;20:17–23. doi: 10.1016/s1074-7613(03)00352-2. [DOI] [PubMed] [Google Scholar]
- 4.Banchereau J, et al. Dendritic cells: controllers of the immune system and a new promise for immunotherapy. Ann. NY Acad. Sci. 2003;987:180–187. doi: 10.1111/j.1749-6632.2003.tb06047.x. [DOI] [PubMed] [Google Scholar]
- 5.Cerundolo V, Hermans IF, Salio M. Dendritic cells: a journey from laboratory to clinic. Nat. Immunol. 2004;5:7–10. doi: 10.1038/ni0104-7. [DOI] [PubMed] [Google Scholar]
- 6.Lu W, Wu X, Lu Y, Guo W, Andrieu JM. Therapeutic dendritic-cell vaccine for simian AIDS. Nat. Med. 2003;9:27–32. doi: 10.1038/nm806. [DOI] [PubMed] [Google Scholar]
- 7.Shortman K, Liu YJ. Mouse and human dendritic cell subtypes. Nat. Rev. Immunol. 2002;2:151–161. doi: 10.1038/nri746. [DOI] [PubMed] [Google Scholar]
- 8.D'Amico A, Wu L. The early progenitors of mouse dendritic cells and plasmacytoid predendritic cells are within the bone marrow hemopoietic precursors expressing Flt3. J. Exp. Med. 2003;198:293–303. doi: 10.1084/jem.20030107. [DOI] [PMC free article] [PubMed] [Google Scholar]
- 9.Karsunky H, Merad M, Cozzio A, Weissman IL, Manz MG. Flt3 ligand regulates dendritic cell development from Flt3+ lymphoid and myeloid-committed progenitors to Flt3+ dendritic cells in vivo. J. Exp. Med. 2003;198:305–313. doi: 10.1084/jem.20030323. [DOI] [PMC free article] [PubMed] [Google Scholar]
- 10.Traver D, et al. Development of CD8a-positive dendritic cells from a common myeloid progenitor. Science. 2000;290:2152–2154. doi: 10.1126/science.290.5499.2152. [DOI] [PubMed] [Google Scholar]
- 11.Dalod M, et al. Dendritic cell responses to early murine cytomegalovirus infection: subset functional specialization and differential regulation by interferon a/b. J. Exp. Med. 2003;197:885–898. doi: 10.1084/jem.20021522. [DOI] [PMC free article] [PubMed] [Google Scholar]
- 12.Kadowaki N, Liu YJ. Natural type I interferon-producing cells as a link between innate and adaptive immunity. Hum. Immunol. 2002;63:1126–1132. doi: 10.1016/s0198-8859(02)00751-6. [DOI] [PubMed] [Google Scholar]
- 13.Martin P, et al. Characterization of a new subpopulation of mouse CD8a+B220+ dendritic cells endowed with type 1 interferon production capacity and tolerogenic potential. Blood. 2002;100:383–390. doi: 10.1182/blood.v100.2.383. [DOI] [PubMed] [Google Scholar]
- 14.Nakano H, Yanagita M, Gunn MD. CD11c+B220+Gr-1+ cells in mouse lymph nodes and spleen display characteristics of plasmacytoid dendritic cells. J. Exp. Med. 2001;194:1171–1178. doi: 10.1084/jem.194.8.1171. [DOI] [PMC free article] [PubMed] [Google Scholar]
- 15.Asselin-Paturel C, et al. Mouse type I IFN-producing cells are immature APCs with plasmacytoid morphology. Nat. Immunol. 2001;2:1144–1150. doi: 10.1038/ni736. [DOI] [PubMed] [Google Scholar]
- 16.Gilliet M, et al. The development of murine plasmacytoid dendritic cell precursors is differentially regulated by FLT3-ligand and granulocyte/macrophage colony-stimulating factor. J. Exp. Med. 2002;195:953–958. doi: 10.1084/jem.20020045. [DOI] [PMC free article] [PubMed] [Google Scholar]
- 17.Ito T, et al. Interferon-a and interleukin-12 are induced differentially by Toll-like receptor 7 ligands in human blood dendritic cell subsets. J. Exp. Med. 2002;195:1507–1512. doi: 10.1084/jem.20020207. [DOI] [PMC free article] [PubMed] [Google Scholar]
- 18.Mazzoni A, Segal DM. Controlling the Toll road to dendritic cell polarization. J. Leukoc. Biol. 2004;75:721–730. doi: 10.1189/jlb.1003482. [DOI] [PubMed] [Google Scholar]
- 19.Ahmed R, Oldstone MB. Organ-specific selection of viral variants during chronic infection. J. Exp. Med. 1988;167:1719–1724. doi: 10.1084/jem.167.5.1719. [DOI] [PMC free article] [PubMed] [Google Scholar]
- 20.Oldstone MB, Salvato M, Tishon A, Lewicki H. Virus-lymphocyte interactions. III. Biologic parameters of a virus variant that fails to generate CTL and establishes persistent infection in immunocompetent hosts. Virology. 1988;164:507–516. doi: 10.1016/0042-6822(88)90565-x. [DOI] [PubMed] [Google Scholar]
- 21.Salvato M, Shimomaye E, Southern P, Oldstone MB. Virus-lymphocyte interactions. IV. Molecular characterization of LCMV Armstrong (CTL+) small genomic segment and that of its variant, clone 13 (CTL ). Virology. 1988;164:517–522. doi: 10.1016/0042-6822(88)90566-1. [DOI] [PubMed] [Google Scholar]
- 22.Jacobs BL, Langland JO. When two strands are better than one: the mediators and modulators of the cellular responses to double-stranded RNA. Virology. 1996;219:339–349. doi: 10.1006/viro.1996.0259. [DOI] [PubMed] [Google Scholar]
- 23.Shigematsu H, et al. Plasmacytoid dendritic cells activate lymphoid-specific genetic programs irrespective of their cellular origin. Immunity. 2004;21:43–53. doi: 10.1016/j.immuni.2004.06.011. [DOI] [PubMed] [Google Scholar]
- 24.Corcoran L, et al. The lymphoid past of mouse plasmacytoid cells and thymic dendritic cells. J. Immunol. 2003;170:4926–4932. doi: 10.4049/jimmunol.170.10.4926. [DOI] [PubMed] [Google Scholar]
- 25.O'Keeffe M, et al. Mouse plasmacytoid cells: long-lived cells, heterogeneous in surface phenotype and function, that differentiate into CD8+ dendritic cells only after microbial stimulus. J. Exp. Med. 2002;196:1307–1319. doi: 10.1084/jem.20021031. [DOI] [PMC free article] [PubMed] [Google Scholar]
- 26.Asselin-Paturel C, Brizard G, Pin JJ, Briere F, Trinchieri G. Mouse strain differences in plasmacytoid dendritic cell frequency and function revealed by a novel monoclonal antibody. J. Immunol. 2003;171:6466–6477. doi: 10.4049/jimmunol.171.12.6466. [DOI] [PubMed] [Google Scholar]
- 27.Boonstra A, et al. Flexibility of mouse classical and plasmacytoid-derived dendritic cells in directing T helper type 1 and 2 cell development: dependency on antigen dose and differential toll-like receptor ligation. J. Exp. Med. 2003;197:101–109. doi: 10.1084/jem.20021908. [DOI] [PMC free article] [PubMed] [Google Scholar]
- 28.Diebold SS, Kaisho T, Hemmi H, Akira S, Reis e Sousa C. Innate antiviral responses by means of TLR7-mediated recognition of single-stranded RNA. Science. 2004;303:1529–1531. doi: 10.1126/science.1093616. [DOI] [PubMed] [Google Scholar]
- 29.Bjorck P. Isolation and characterization of plasmacytoid dendritic cells from Flt3 ligand and granulocyte-macrophage colony-stimulating factor–treated mice. Blood. 2001;98:3520–3526. doi: 10.1182/blood.v98.13.3520. [DOI] [PubMed] [Google Scholar]
- 30.Beignon AS, Skoberne M, Bhardwaj N. Type I interferons promote cross-priming: more functions for old cytokines. Nat. Immunol. 2003;4:939–941. doi: 10.1038/ni1003-939. [DOI] [PubMed] [Google Scholar]
- 31.Le Bon A, Tough DF. Links between innate and adaptive immunity via type I interferon. Curr. Opin. Immunol. 2002;14:432–436. doi: 10.1016/s0952-7915(02)00354-0. [DOI] [PubMed] [Google Scholar]
- 32.Lee CK, et al. Generation of macrophages from early T progenitors in vitro. J. Immunol. 2001;166:5964–5969. doi: 10.4049/jimmunol.166.10.5964. [DOI] [PubMed] [Google Scholar]
- 33.Izon D, et al. A common pathway for dendritic cell and early B cell development. J. Immunol. 2001;167:1387–1392. doi: 10.4049/jimmunol.167.3.1387. [DOI] [PubMed] [Google Scholar]
- 34.Bjorck P, Kincade PW. CD19+ pro-B cells can give rise to dendritic cells in vitro. J. Immunol. 1998;161:5795–5799. [PubMed] [Google Scholar]
- 35.Ardavin C. Origin, precursors and differentiation of mouse dendritic cells. Nat. Rev. Immunol. 2003;3:582–590. doi: 10.1038/nri1127. [DOI] [PubMed] [Google Scholar]
- 36.Comeau MR, Van der Vuurst de Vries AR, Maliszewski CR, Galibert L. CD123bright plasmacytoid predendritic cells: progenitors undergoing cell fate conversion? J. Immunol. 2002;169:75–83. doi: 10.4049/jimmunol.169.1.75. [DOI] [PubMed] [Google Scholar]
- 37.Koo CH, et al. Additional evidence that ‘plasmacytoid T-cell lymphoma’ associated with chronic myeloproliferative disorders is of macrophage/monocyte origin. Am. J. Clin. Pathol. 1990;93:822–827. doi: 10.1093/ajcp/93.6.822. [DOI] [PubMed] [Google Scholar]
- 38.Chaperot L, et al. Identification of a leukemic counterpart of the plasmacytoid dendritic cells. Blood. 2001;97:3210–3217. doi: 10.1182/blood.v97.10.3210. [DOI] [PubMed] [Google Scholar]
- 39.Diebold SS, et al. Viral infection switches non-plasmacytoid dendritic cells into high interferon producers. Nature. 2003;424:324–328. doi: 10.1038/nature01783. [DOI] [PubMed] [Google Scholar]
- 40.Sevilla N, McGavern DB, Teng C, Kunz S, Oldstone MB. Viral targeting of hematopoietic progenitors and inhibition of DC maturation as a dual strategy for immune subversion. J. Clin. Invest. 2004;113:737–745. doi: 10.1172/JCI20243. [DOI] [PMC free article] [PubMed] [Google Scholar]
- 41.Ichikawa E, et al. Defective development of splenic and epidermal CD4+ dendritic cells in mice deficient for IFN regulatory factor-2. Proc. Natl. Acad. Sci. USA. 2004;101:3909–3914. doi: 10.1073/pnas.0400610101. [DOI] [PMC free article] [PubMed] [Google Scholar]
- 42.Honda K, Mizutani T, Taniguchi T. Negative regulation of IFN-a/b signaling by IFN regulatory factor 2 for homeostatic development of dendritic cells. Proc. Natl. Acad. Sci. USA. 2004;101:2416–2421. doi: 10.1073/pnas.0307336101. [DOI] [PMC free article] [PubMed] [Google Scholar]
- 43.Dutko FJ, Oldstone MB. Genomic and biological variation among commonly used lymphocytic choriomeningitis virus strains. J. Gen. Virol. 1983;64:1689–1698. doi: 10.1099/0022-1317-64-8-1689. [DOI] [PubMed] [Google Scholar]
- 44.Schlissel MS, Corcoran LM, Baltimore D. Virus-transformed pre-B cells show ordered activation but not inactivation of immunoglobulin gene rearrangement and transcription. J. Exp. Med. 1991;173:711–720. doi: 10.1084/jem.173.3.711. [DOI] [PMC free article] [PubMed] [Google Scholar]
Associated Data
This section collects any data citations, data availability statements, or supplementary materials included in this article.


