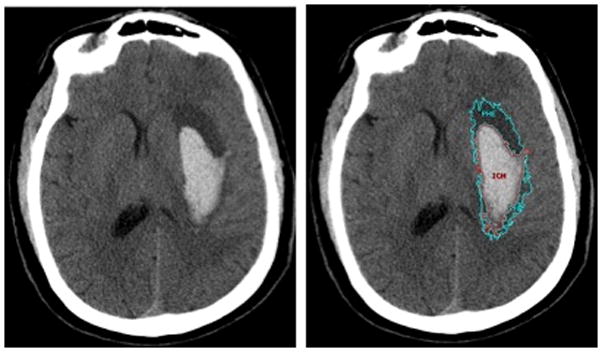
Figure 1.

Example of Region of Interest object maps used to measure intracerebral hemorrhage (ICH) and peri-hematomal edema (PHE) volumes. Left panel, left putaminal hemorrhage. Right panel, ICH (red) and PHE (cyan) delineated with an edge-detection algorithm.
