

Abstract
To investigate structural and functional brain changes in patients with primary open-angle glaucoma (POAG) by using voxel-based morphometry based on diffeomorphic anatomical registration through exponentiated Lie algebra (VBM-DARTEL) and blood oxygenation level dependent functional magnetic resonance imaging (BOLD-fMRI), respectively.
Thirteen patients diagnosed with POAG and 13 age- and sex-matched healthy controls were enrolled in the study. For each participant, high-resolution structural brain imaging and blood flow imaging were acquired on a 3.0-Tesla magnetic resonance imaging (MRI) scanner. Structural and functional changes between the POAG and control groups were analyzed. An analysis was carried out to identify correlations between structural and functional changes acquired in the previous analysis and the retinal nerve fiber layer (RNFL).
Patients in the POAG group showed a significant (P < 0.001) volume increase in the midbrain, left brainstem, frontal gyrus, cerebellar vermis, left inferior parietal lobule, caudate nucleus, thalamus, precuneus, and Brodmann areas 7, 18, and 46. Moreover, significant (P < 0.001) BOLD signal changes were observed in the right supramarginal gyrus, frontal gyrus, superior frontal gyrus, left inferior parietal lobule, left cuneus, and left midcingulate area; many of these regions had high correlations with the RNFL.
Patients with POAG undergo widespread and complex changes in cortical brain structure and blood flow. (ClinicalTrials.gov number: NCT02570867).
Keywords: BOLD-fMRI, gray, POAG, VBM-DARTEL
1. Introduction
Glaucoma is a progressive optic neuropathy disease characterized by the irreversible loss of retinal ganglion cells and the visual field.[1] It has become the 2nd leading cause of blindness globally. Recently, an increasing number of studies[2–4] suggested that primary open-angle glaucoma (POAG) could cause changes in the whole visual pathway, including the optic nerve, lateral geniculate body, optic radiation, and visual cortex. Moreover, the earliest morphologic changes were detected in the central nervous system (CNS) in monkeys,[3] though there is no definite evidence or research supporting this conclusion in humans. However, current clinical examination methods for POAG mainly include vision, optical coherence tomography (OCT), and visual electrophysiology. Few effective methods have been used to estimate the CNS changes in POAG.
Voxel-based morphometry (VBM) is an objective image analysis technique for characterizing regional cerebral volume and tissue concentration differences on whole-brain structural magnetic resonance imaging (MRI). It has advantages in analyzing differences between the density and volume of brain tissue and quantifying morphological brain tissue abnormalities. Recently, it has been extensively used in CNS diseases, such as in Alzheimer disease and Parkinson disease. The diffeomorphic anatomical registration through exponentiated Lie algebra model (DARTEL), based on flow field theory, was proposed by Ashburner in 2007;[5] it makes VBM segmentation and registration easier and more precise and provides a new method to study CNS-related diseases.
Blood oxygenation level dependent functional MRI (BOLD-fMRI)[6] could observe human brain neural activity noninvasively and accurately by using changes in the blood flow of local brain regions to detect changes in hemoglobin and unoxygenated hemoglobin in the blood. POAG with typical visual field defects can present as lower activation in the visual cortex.[7] However, no report has been published recently on early- or mid-stage POAG.
The purpose of this study was to investigate structural and functional CNS changes in patients with POAG.
2. Methods
This study was registered at ClinicalTrials.gov (number: NCT02570867) and adhered to all tenets of the Declaration of Helsinki. Written consent was obtained from each participant after an explanation of the nature and possible consequences of the study.
2.1. Study population
Thirteen patients with POAG were recruited from the First Affiliated Hospital of Jinan University (mean age, 32.38 years; range, 22–39 years, 10 men and 3 women). Thirteen controls matched by age and sex were recruited (mean age, 30.38 years; range, 23–39 years, 10 men and 3 women). The inclusion criteria for POAG were as follows[8]: intraocular pressure (IOP) ≥21 mm Hg; characteristic glaucomatous damage: optic nerve damage and/or retinal nerve fiber layer (RNFL) defects and/or visual field defects; and an open anterior chamber angle in each quadrant. The exclusion criteria were: age ≥40 years or age ≤18 years; stage 4 or 5 on the Glaucoma Staging System 2[9]; high myopia (spherical equivalent ≥−6.00 D); ocular disease: keratopathy, cataract, diabetic retinopathy, or optic nerve disease; CNS disorders: stroke, dementia, traumatic brain injury, psychiatric disorder, etc.; and MRI contraindications: claustrophobia, ferromagnetic implants or pacemakers, or an inability to lie still for the duration of the MRI acquisition.
2.2. Ophthalmic examination
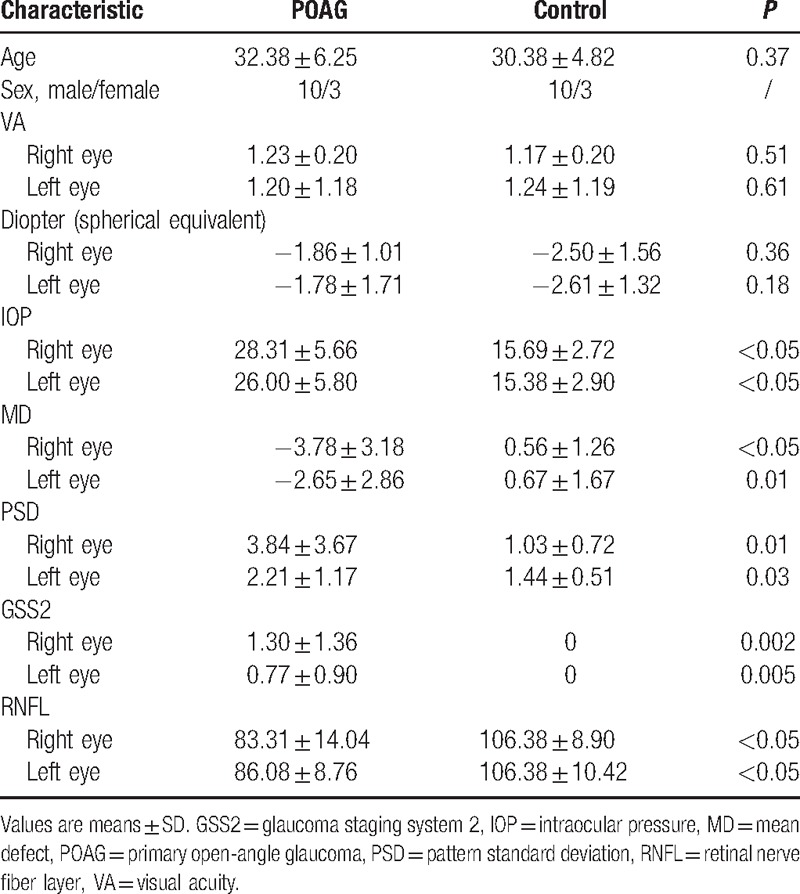
All participants underwent a complete ophthalmic examination including visual acuity, medical optometry, IOP (Non-Contact Tonometer, Topcon, Japan), visual field assessment with a 30-2 Swedish interactive thresholding algorithm standard automated perimeter (Humphrey Field Analyzer, Carl Zeiss Meditec, Inc., Dublin, CA), and OCT (RNFL thickness analysis, Carl Zeiss Meditec, Inc.). The relative RNFL (RRNFL) was calculated as follows: (superior RNFL + inferior RNFL)/mean RNFL[10] (Table 1).
Table 1.
Baseline clinical characteristics.
2.3. MRI data acquisition
The visual and auditory systems (Samrtec, SA-9900; Signora, Shenzhen, China) were assessed by BOLD-fMRI scanning. Visual stimuli consisted of black-and-white checkerboards with contrasting components that reversed at 8 Hz. Each experimental run lasted 180 seconds and was divided into 6 epochs of 30-second durations. Each epoch contained a 15-second checkerboard stimulus and a 15-second unpatterned background with the same mean luminance as in the stimulus period.
All brain MRI was obtained using a 3.0-T MRI scanner (GE, United States Of America) with 8-channel phased-array head coils within 1 week after the eye examination; routine MRI scans and BOLD-fMRI scans were acquired. The routine MRI parameters were as follows: no interval scan covering; whole-brain imaging; TR, 8.2 ms; TE, 3.2 ms; flip angle, 12°; in-plane matrix, 256 × 256 mm; and slice thickness, 1.2 mm. The BOLD-fMRI scan parameters were as follows: TR, 2000 ms; TE, 35 ms; flip angle, 90°; in-plane matrix, 64 × 64 mm; and slice thickness, 3 mm.
2.4. Data analysis
2.4.1. VBM analysis
The VBM analysis was performed with an external toolbox (VBM-DARTEL) for a statistical software package (SPM; http://www.fil.ion.ucl.ac.uk/spm). First, all image analysis processes were conducted as described in the VBM tutorial (http://www.fil.ion.ucl.ac.uk/∼john/misc/VBMclass10.pdf). Preprocessing for the T1-weighted images involved using the following DARTEL algorithm: new segment – generate roughly aligned gray matter (GM) and white matter (WM) images of the subjects; create template – determine nonlinear deformations for warping all the GM and WM images so that they match each other; and normalize to Montreal Neurological Institute (MNI) space – images were normalized to the MNI template and were smoothed with an 8-mm full-width at half-maximum Gaussian filter. Then, the GM, WM, and cerebrospinal fluid (CSF) structures of each patient were obtained after processing. The total intracranial volume (TIV) was calculated using MATLABR2010b (The Mathworks, Natick, MA) (TIV = GM + WM + CSF). Second, voxel-wise comparisons of GM volumes were performed between the POAG and control groups with SPM. Age and TIV were included as nuisance covariates. Furthermore, 2-sample t tests were computed between the groups by using the GM volumes acquired above (P < 0.001, false discovery rate corrected). A whole-brain gray mask was used in the analysis. Finally, a resting-state reviewer (REST; http://www.restfmri.net/) was used to determine the coordinates of the local T maxima. All detected regions were then looked up in the normalized human brain by referring to the automated anatomical labeling (AAL) system (http://www.cyceron.fr/index.php/en/plateforme-en/freeware [in the public domain]).
2.4.2. BOLD-fMRI analysis
Analysis of the fMRI data were performed using statistical software (SPM). Individual participants’ data were analyzed using a general linear model for BOLD signal changes. First, all functional images were corrected for slice timing as well as head movement. Data from participants with excessive head movement >1.5 mm of displacement or >1.5 mm of rotation in any direction were discarded. Second, a high-pass filter with a cut-off of 128 seconds was applied to remove low-frequency temporal drifts, normalized to the MNI template, and spatially smoothed with a 4-mm isotropic full-width at half-maximum Gaussian kernel. Third, individual statistical parametric maps were calculated to elucidate the task response. Then, 1-sample t tests were calculated for the above-mentioned individual contrast images between the patients and controls (Fig. 1). Two-sample t tests were computed for the contrast to evaluate differences between the patients and matched controls (P < 0.001, AlphaSim corrected). Age and TIV were included as nuisance covariates in the statistical analyses. Finally, a resting-state reviewer was used to determine the coordinates of local T maxima.
Figure 1.

A 1-sample t test of the primary open-angle glaucoma (POAG) and control groups (P < 0.05, cluster >10). Red region: high blood signal area; blue region: low blood signal area.
2.4.3. Correlation analysis
The correlation statistical analyses tool in REST was used to evaluate the pertinence between the RRNFL and GM volume and between the RRNFL and BOLD signal in the region detected in the above analysis (P < 0.05).
3. Results
3.1. Intergroup analysis
The regions of the brain with increased volumes compared with the control group were primarily the midbrain, left brainstem, frontal gyrus, cerebellar vermis, left inferior parietal lobule, caudate nucleus, thalamus, precuneus, and Brodmann areas 7, 18, and 46. Differences in brain activation were primarily located in the right supramarginal gyrus, frontal gyrus, superior frontal gyrus, left inferior parietal lobule, left cuneus, left midcingulate area, etc.; all these regions expressed high blood signals. Increased volume and blood flow changes were found simultaneously in the frontal lobe (Table 2; Fig. 2).
Table 2.
VBM-DARTEL and BOLD-fMRI changes differing significantly between POAG and control groups.
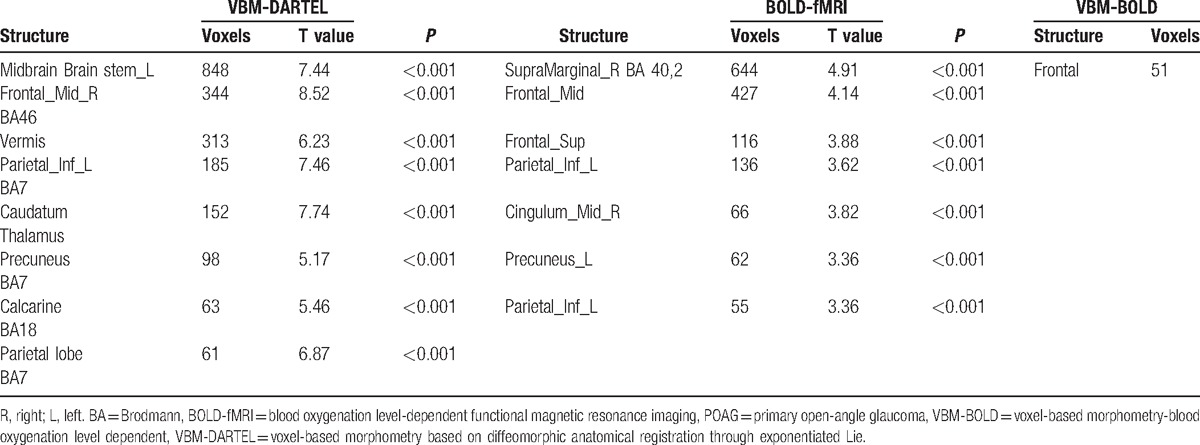
Figure 2.
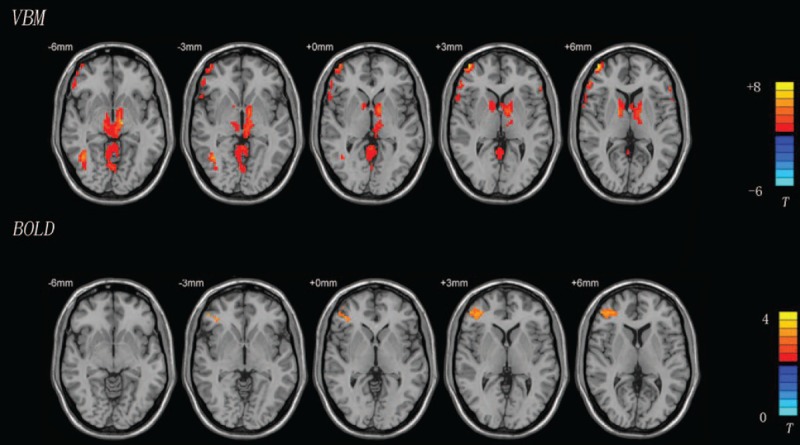
Areas with different structures and blood signals between the POAG and control groups shown using VBM-DARTEL and BOLD-fMRI (P < 0.001, AlphaSim corrected). The red region in the VBM image represents a larger area in the POAG group than in the control group. The red region in the BOLD image shows an area of higher signal in the POAG group than in the control group. BOLD-fMRI = blood oxygenation level-dependent functional magnetic resonance imaging, POAG = primary open-angle glaucoma, VBM-DARTEL = voxel-based morphometry based on diffeomorphic anatomical registration through exponentiated Lie.
3.2. Correlation analysis
Structures in the whole-brain GM that had negative correlations with the RRNFL were primarily the left temporal middle gyrus, right superior occipital gyrus, right middle temporal gyrus, and Brodmann areas 18 and 19. The right supramarginal gyrus, angular gyrus, lingual gyrus, postcentral gyrus, left cuneus, and Brodmann area 19 expressed positive correlations. Only the left cuneus was found to exhibit a negative correlation in the analysis between the RRNFL and whole-brain BOLD signal. Four structures, including the right inferior parietal lobule, middle frontal gyrus, middle occipital gyrus, and inferior temporal gyrus showed positive correlations in the analysis of the BOLD signal and the RRNFL (Table 3; Fig. 3).
Table 3.
Correlation coefficient (r) analysis between RRNFL and VBM-BOLD.
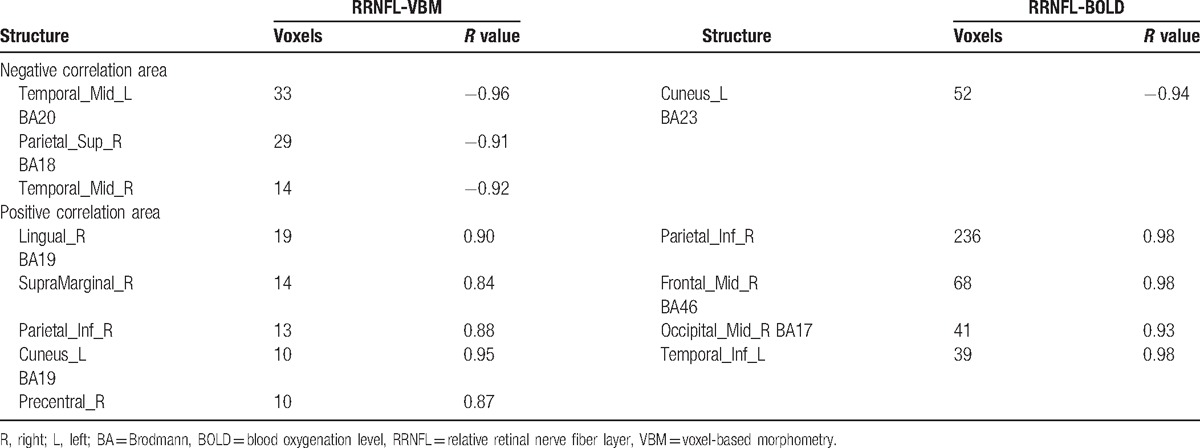
Figure 3.
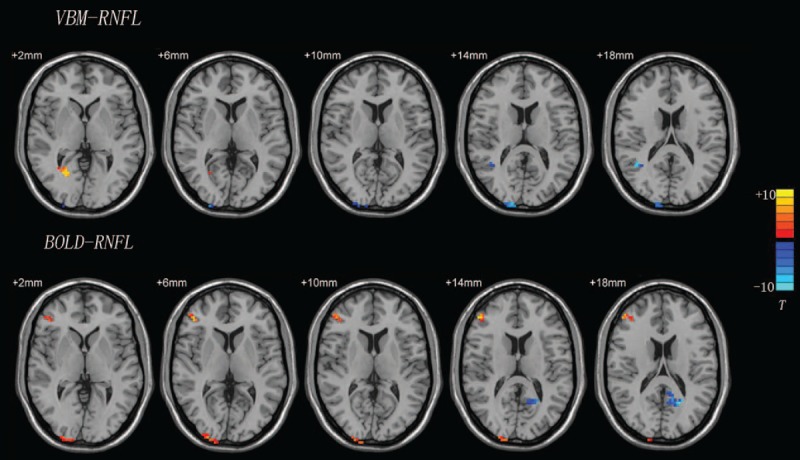
Correlation analysis results from VBM-RNFL and BOLD-RNFL analyses. T-score bars are shown on the right. Red region: positively correlated area; blue region: negatively correlated area. BOLD = blood oxygenation level, RNFL = retinal nerve fiber layer, VBM = voxel-based morphometry.
4. Discussion
The visual system can be divided into 2 pathways[11]: the magnocellular pathways and parvocellular pathways. The magnocellular pathways, which are based on Pα cells in the retina, transmit information to the M layer in the lateral geniculate body, and then deliver it to the C layer in the primary visual cortex, and are sensitive to information with low spatial frequencies and high temporal frequencies. The parvocellular pathways, which are based on Pβ cells in the retina, transmit information to the P layer in the lateral geniculate body and then deliver it to the IVC layer in the primary visual cortex, and are sensitive to information with high spatial frequencies and low temporal frequencies. After integration and processing in the primary visual cortex (V1), the visual signal is transmitted to the secondary visual cortex (extrastriate cortex) by dorsal and ventral pathways. The dorsal pathways, which receive signals from the magnocellular pathways, are responsible for spatial information and motional orientation of an object and are mainly located in the parietal lobe, occipital lobe, and frontal lobe.[12] The ventral pathways are located mainly in the temporal cortex and hippocampus, which are closely related to detecting the shapes and colors of objects.
Previous research on glaucoma models[3,13] and autopsy[4,14] suggested that high IOP may cause damage to the magnocellular and parvocellular pathways, and especially the magnocellular pathways. The frequency doubling perimetry[15] and motion perimetry[16] visual fields showed good sensitivity and specificity in the early detection of glaucoma. We also found increased blood flow signal changes in the extrastriate cortex, such as in the frontal (AAL Frontal_Mid voxel 427 T value, 4.14, P < 0.001; AAL Frontal_Sup voxel 116 T value, 3.88, P < 0.001) and parietal (AAL Parietal_Inf_L voxel 136 T value, 3.63 P < 0.001) lobes belonging to the dorsal pathway compared with those in the control group by using high-frequency flipped black-and-white checkerboards. Similar findings from DARTEL showed that the volume increased in the frontal (AAL Frontal_Mid_R voxel 344 T value, 8.52, P < 0.001) and parietal (Parietal_Inf_L voxel 185 T value, 7.64, P < 0.001) lobes indicate that early- and mid-stage POAG could cause changes in the magnocellular pathways. However, the volume changes were not fully consistent with the regional blood flow changes; only some areas overlapped, such as the frontal and parietal lobes. Volume increases may be related to local tissue cell edema or microsomal activation.[17,18] This may be a sign of nerve damage. The BOLD signal is based on changes in blood flow in local tissue and will exhibit high signal only when the tissue has increased blood flow. However, changes in cell edema and microsomal activation may not lead to changes in local blood flow, and thus may not cause a change in the BOLD signal. Our research found that the areas of change in DARTEL and BOLD were not completely coincident, but neighboring regions of DARTEL volumes also showed BOLD signal changes. Therefore, we speculate that when pathological changes appear in local tissue, related peripheral structures appear as compensatory enhancements. This causes increased local blood flow as a response to visual stimuli.
Crish et al[19] reported that the axonal transport disorder in early glaucoma started in the brain, and the lesions gradually developed from the distal to the proximal end (eye). Increased volume in the midbrain in POAG compared with the control group was also found in our DARTEL research. Part of the RNFL, about 10%, projects to the superior colliculus and then delivers information about motion and spatial position through the thalamus to the higher visual cortex (dorsal pathway). A comprehensive fiber connection could be found between spatial position and the secondary visual cortex. Moreover, the substantia nigra, the largest cerebral nucleus that can compound dopamine, plays an important role in the pathogenesis of Parkinson disease. In Parkinson disease, the prevalence of glaucoma is much higher than in the normal population.[20] Further study will be needed on whether it relates to volume changes in POAG.
However, we could not find significant BOLD signal changes in the midbrain and consider that it may be related to the stimulation style we selected. Although about 10% of the RNFL projects to the superior colliculus, 90% of it delivers visual information to the primary visual cortex through the lateral geniculate nucleus. The lateral geniculate nucleus pathway still may be the most primary mode of visual transduction. Our research may have neglected small-amplitude signal changes when analyzing the whole-brain GM by using high-frequency flipped black-and-white checkerboards.
A previous study suggests that the cuneus is related to attentional modulation.[21] Zhang et al[22] found that the volume of the cuneus was decreased in early-stage POAG, which was similar to the findings in our research. Moreover, we also found large signal changes in the cuneus without structural changes. We speculated that it may be associated with local atrophy, secondary hyperfunction, and increased blood flow after visual deprivation.
In POAG, the visual field is important for diagnosis and as a follow-up index. However, 50% of the RNFL has been damaged when obvious visual field changes have occurred.[23] Kim et al[10] believed that OCT appeared to have high sensitivity in the diagnosis of POAG, especially for the superior temporal and inferior temporal thicknesses of the RNFL.[24] Since there are individual differences in the average RNFL thickness, our correlation analysis selected the RRNFL index (RRNFL = [superior RNFL + inferior RNFL]/mean RNFL) to decrease the effect of individual differences, such as those due to race, axial length, and age.[25] In our results, the parietal lobe, temporal lobe, and occipital lobe had high correlations with the RRNFL. The more serious the RRNFL damage, the more obvious the volume change in the middle temporal gyrus and the more activity in the right inferior temporal gyrus. Damage to the RNFL appeared as atrophy in Brodmann area 19, increased volume in Brodmann area 18, and large BOLD signal changes in Brodmann area 17. Various changes could be found in different areas of the primary visual cortex. This may be a compensatory change after tissue damage; the mechanisms are not clear.
In our study, we found that early- and mid-stage POAG could cause wide-reaching volume and blood flow changes. The GM often showed increased volume, which corroborated Williams report.[26] Both high and low BOLD signals could be found in the GM. Parts of those areas are related to the RNFL. All these findings indicate that POAG could cause wide-reaching changes in the GM in structure and function.
However, Williams et al[26] also found that POAG often showed increased GM volume in the early stage, and showed atrophic changes as the disease progressed.[27] GM volume increased similarly in our study. Unfortunately, a within-group analysis was not performed because of the small sample size. This is a limitation of our research and the main aspect we will perfect in the next study.
The VBM-DARTEL and BOLD techniques provide us with a new way to evaluate structural and functional changes in POAG. However, because of the small number of subjects included in this study, large-sample, multicenter analysis verification is still needed in a future study.
Footnotes
Abbreviation: AAL = automated anatomical labeling, BOLD-fMRI = blood oxygenation level-dependent functional magnetic resonance imaging, CNS = central nervous system, GM = gray matter, LGN = lateral geniculate nucleus, MNI = Montreal Neurological Institute, POAG = primary open-angle glaucoma, RNFL = retinal nerve fiber layer, RRNFL = relative RNFL, TIV = total intracranial volume, VBM-DARTEL = voxel-based morphometry based on diffeomorphic anatomical registration through exponentiated Lie, WM = white matter.
The authors have no funding and conflicts of interest to disclose.
References
- [1].Quigley HA. Glaucoma. Lancet 2011;377:1367–77. [DOI] [PubMed] [Google Scholar]
- [2].Yu L, Yin X, Dai C, et al. Morphologic changes in the anterior and posterior subregions of V1 and V2 and the V5/MT+ in patients with primary open-angle glaucoma. Brain Res 2014;1588:135–43. [DOI] [PubMed] [Google Scholar]
- [3].Ito Y, Shimazawa M, Chen YN, et al. Morphological changes in the visual pathway induced by experimental glaucoma in Japanese monkeys. Exp Eye Res 2009;89:246–55. [DOI] [PubMed] [Google Scholar]
- [4].Gupta N, Ang LC, Noël de Tilly L, et al. Human glaucoma and neural degeneration in intracranial optic nerve, lateral geniculate nucleus and visual cortex. Br J Ophthalmol 2006;90:674–8. [DOI] [PMC free article] [PubMed] [Google Scholar]
- [5].Ashburner J. A fast diffeomorphic image registration algorithm. Neuroimage 2007;38:95–113. [DOI] [PubMed] [Google Scholar]
- [6].Birn RM, Saad ZS, Bandettini PA. Spatial heterogeneity of the nonlinear dynamics in the FMRI BOLD response. Neuroimage 2001;14:817–26. [DOI] [PubMed] [Google Scholar]
- [7].Qing G, Zhang S, Wang B, et al. Functional MRI signal changes in primary visual cortex corresponding to the central normal visual field of patients with primary open-angle glaucoma. Invest Ophthalmol Vis Sci 2010;51:4627–34. [DOI] [PubMed] [Google Scholar]
- [8].Li MY. Glaucoma. 1st ed. 2004;Beijing: People's Medical Publishing House, 335. [Google Scholar]
- [9].Brusini P, Filacorda S. Enhanced Glaucoma Staging System (GSS 2) for classifying functional damage in glaucoma. J Glaucoma 2006;15:40–6. [DOI] [PubMed] [Google Scholar]
- [10].Kim TW, Park UC, Park KH, et al. Ability of Stratus OCT to identify localized retinal nerve fiber layer defects in patients with normal standard automated perimetry results. Invest Ophthalmol Vis Sci 2007;48:1635–41. [DOI] [PubMed] [Google Scholar]
- [11].Lennie P. Parallel visual pathways: a review. Vision Res 1980;20:561–94. [DOI] [PubMed] [Google Scholar]
- [12].Maunsell JH, Nealey TA, DePriest DD. Magnocellular and parvocellular contributions to responses in the middle temporal visual area (MT) of the macaque monkey. J Neurosci 1990;10:3323–34. [DOI] [PMC free article] [PubMed] [Google Scholar]
- [13].Weber AJ, Chen H, Hubbard WC, et al. Experimental glaucoma and cell size, density, and number in the primate lateral geniculate nucleus. Invest Ophthalmol Vis Sci 2000;41:1370–9. [PubMed] [Google Scholar]
- [14].Chaturvedi N, Hedley-Whyte ET, Dreyer EB. Lateral geniculate nucleus in glaucoma. Am J Ophthalmol 1993;116:182–8. [DOI] [PubMed] [Google Scholar]
- [15].Medeiros FA, Sample PA, Weinreb RN. Frequency doubling technology perimetry abnormalities as predictors of glaucomatous visual fields loss. Am J Ophthalmol 2004;137:863–71. [DOI] [PubMed] [Google Scholar]
- [16].Shabana N, Cornilleau Pérès V, Carkeet A, et al. Motion perception in glaucoma patients: a review. Surv Ophthalmol 2003;48:92–106. [DOI] [PubMed] [Google Scholar]
- [17].Rodríguez JJ, Verkhratsky A. Neuroglial roots of neurodegenerative diseases? Mol Neurobiol 2011;43:87–96. [DOI] [PubMed] [Google Scholar]
- [18].Xu H, Chen M, Forrester JV. Para-inflammation in the aging retina. Prog Retin Eye Res 2009;28:348–68. [DOI] [PubMed] [Google Scholar]
- [19].Crish SD, Sappington RM, Inman DM, et al. Distal axonopathy with structural persistence in glaucomatous neurodegeneration. Proc Natl Acad Sci U S A 2010;107:5196–201. [DOI] [PMC free article] [PubMed] [Google Scholar]
- [20].Bayer AU, Keller ON, Ferrari F, et al. Association of glaucoma with neurodegenerative diseases with apoptotic cell death Alzheimer's disease and Parkinson's disease. Am J Ophthalmol 2002;133:135–7. [DOI] [PubMed] [Google Scholar]
- [21].Hahn B, Ross TJ, Stein EA. Neuroanatomical dissociation between bottom-up and top-down processes of visuospatial selective attention. Neuroimage 2006;32:842–53. [DOI] [PMC free article] [PubMed] [Google Scholar]
- [22].Zhang S, Wang B, Xie Y, et al. Retinotopic changes in the gray matter volume and cerebral blood flow in the primary visual cortex of patients with primary open-angle glaucoma. Invest Ophthalmol Vis Sci 2015;56:6171–8. [DOI] [PubMed] [Google Scholar]
- [23].Harwerth RS, Carter-Dawson L, Shen F, et al. Ganglion cell losses underlying visual field defects from experimental glaucoma. Invest Ophthalmol Vis Sci 1999;40:2242–50. [PubMed] [Google Scholar]
- [24].González-García AO, Vizzeri G, Bowd C, et al. Reproducibility of RTVue retinal nerve fiber layer thickness and optic disc measurements and agreement with Stratus optical coherence tomography measurements. Am J Ophthalmol 2009;147:1067–74. [DOI] [PMC free article] [PubMed] [Google Scholar]
- [25].Knight OJ, Girkin CA, Budenz DL, et al. Cirrus OCT Normative Database Study Group. Effect of race, age, and axial length on optic nerve head parameters and retinal nerve fiber layer thickness measured by Cirrus HD-OCT. Arch Ophthalmol 2012;130:312–8. [DOI] [PMC free article] [PubMed] [Google Scholar]
- [26].Williams AL, Lackey J, Wizov SS, et al. Evidence for widespread structural brain changes in glaucoma: a preliminary voxel-based MRI study. Invest Ophthalmol Vis Sci 2013;54:5880–7. [DOI] [PubMed] [Google Scholar]
- [27].Chen WW, Wang N, Cai SP, et al. Structural brain abnormalities in patients with primary open-angle glaucoma: a study with 3T MR imaging. Invest Ophthalmol Vis Sci 2013;54:545–54. [DOI] [PubMed] [Google Scholar]