

Abstract
A high-throughput single cell profiling method has been developed for matrix-enhanced secondary ion mass spectrometry (ME-SIMS) to investigate the lipid profiles of neuronal cells. Populations of cells are dispersed onto the substrate, their locations determined using optical microscopy, and the cell locations used to guide the acquisition of SIMS spectra from the cells. Up to 2,000 cells can be assayed in one experiment at a rate of 6 s per cell. Multiple saturated and unsaturated phosphatidylcholines (PCs) and their fragments are detected and verified with tandem mass spectrometry from individual cells when ionic liquids are employed as a matrix. Optically guided single cell profiling with ME-SIMS is suitable for a range of cell sizes, from Aplysia californica neurons larger than 75 μm to 7-μm rat cerebellar neurons. ME-SIMS analysis followed by t-distributed stochastic neighbor embedding of peaks in the lipid molecular mass range (m/z 700–850) distinguishes several cell types from the rat central nervous system, largely based on the relative proportions of the four dominant lipids, PC(32:0), PC(34:1), PC(36:1), and PC(38:5). Furthermore, subpopulations within each cell type are tentatively classified consistent with their endogenous lipid ratios. The results illustrate the efficacy of a new approach to classify single cell populations and subpopulations using SIMS profiling of lipid and metabolite contents. These methods are broadly applicable for high throughput single cell chemical analyses.
Introduction
Single cell heterogeneity appears in seemingly homogeneous cell populations, even when derived from identical genetic blueprints. Adjacent cells within tissues have distinct identities and chemical contents; probing these differences aids in our understanding of the interplay between chemistry, cell activity, and function in complex tissues. As a single cell divides and differentiates into distinct subpopulations or into a malignant tumor, fluctuations in chemical composition and changes in cellular state manifest as diverging cell lineages, confounded with decisions related to cell fate from environmental cues.1 Cell populations appear only as homogenous as our ability to detect differences in their chemical composition. Newly developed techniques measure heterogeneity in genetic materials, proteins, peptides, lipids, and metabolites.2-11 Recent successes in single cell studies help address confounding questions in cell biology and shape the next generation of drug discovery and development efforts.1,12 Even so, there remains a need for single cell techniques that are capable of simultaneously detecting many classes of biological molecules in populations of cells.13 The search for rare cells, which for decades was akin to finding a needle in a haystack, has become tractable with the emergence of high-throughput and sensitive measurement techniques.
Typical mammalian cells contain a few picoliters of volume, with analyte concentrations ranging from picomolar to millimolar. Thus, a successful single cell analytical technique should provide a low absolute detection limit, a high dynamic range, and multiplexed coverage of analyte classes.5 Mass spectrometry (MS) has become a versatile and robust method for performing volume-limited biological measurements. Mass spectrometry imaging (MSI) is at the forefront of MS-based, label-free platforms for analyzing single cells,6,14-18 demonstrating cellular and subcellular spatial resolution19-21 and untargeted detection of biological molecules.5,8 If cellular analytes are efficiently desorbed and ionized, the gas phase ions can be further interrogated with hybrid MS instrumentation for structural fragmentation,22,23 ion sizes and shapes,23-26 secondary structures,27,28 and thermodynamic properties.29,30
Secondary ion mass spectrometry (SIMS) and matrix-assisted laser desorption/ionization (MALDI) are two common MS ionization microprobes that are suitable for spatially-resolved surface analysis of single cells.31-34 MALDI uses focused laser light to desorb and ionize sample analytes incorporated into a suitable matrix. In contrast, SIMS utilizes a beam of accelerated primary ions or larger clusters that bombards the sample surface to sputter and generate secondary ions in the gas phase for mass-to-charge (m/z) analysis. Since the primary ion beam can be tightly focused, SIMS can achieve subcellular spatial resolution.31
Previous SIMS imaging investigations have established sample preparation methods that improve the limits of detection and molecular coverage of biological samples, including metal assisted35-37 and ionic liquid (IL) matrix-enhanced SIMS.38-40 Many IL mixtures have unique physical and chemical properties that can be optimized for SIMS- and MALDI-based detection.40,41
Recently, we demonstrated the capability of a high-throughput, microscopy-guided MALDI MS profiling method to classify dissociated rat pituitary cells, including rare cells, as well as elucidate the cellular heterogeneity of rat islets of Langerhans.32,33 The approach circumvents the need for MS raster imaging42,43 of a large region of interest, which is time consuming and often splits cell signals over multiple pixels. However, most single cell SIMS studies also utilize raster imaging22,34,35,44-50 to fully leverage the subcellular spatial resolution of the method and localize analytes within single cells, albeit at low throughput and reduced sensitivity.
Establishing optically-guided single cell SIMS profiling should facilitate lipidomics and metabolomics studies on large populations of cells. Here we report a combination of matrix-enhanced SIMS (ME-SIMS) and multivariate statistical analysis to profile single cells from the Aplysia californica central nervous system, the rat dorsal root ganglion (DRG), and the rat cerebellum. These neuronal cell types were chosen because they represent well-characterized large (>75 μm in diameter), medium (10–50 μm), and small (5–10 μm) cells, respectively. The A. californica samples included large neurons with well-studied metabolite and lipid contents,22,35,42,46,49 and are therefore suitable for our method validation experiments. The DRG contains the cell bodies of sensory neurons actively participating in neuropathic pain.51 DRGs are traditionally classified based their on size,52 electrophysiological properties,53 and peptide content.54 Cellular heterogeneity within the DRG was previously shown to affect opioid peptide sensitivity55 and produce differential responses to neuropathic pain.56 The cerebellar cells are critical to cognitive function and motor control,57 and were chosen as small cell targets for this study.
Here we performed ME-SIMS utilizing three different IL matrices to determine their ability to enhance the sputtering/ionization efficiency and chemical signals for single cell SIMS profiling. In addition, ME-SIMS tandem MS was performed to identify and characterize metabolites, including lipids, from single cells. Data sets acquired from populations of DRG and cerebellar cells were classified by t-distributed stochastic neighbor embedding (t-SNE). Each cellular population was further sub-divided by the same method, revealing their heterogeneity based on lipid content.
Experimental Section
Chemicals
All chemicals were purchased from Sigma Aldrich (St. Louis, MO) and used without further purification.
Matrix Preparation
Three IL matrix solutions were evaluated. The first, MI-CHCA, was prepared by dissolving 250 mg of α-cyano-4-hydroxycinnamic acid (CHCA; > 98% purity) in 10 mL LC-grade methanol, followed by an addition of 105 μL of 1-methylimidazole (MI; Reagent Plus, 99%), with 10 mL of LC-grade acetonitrile added to the total volume of 20 mL. The second, TRIP-CHCA, was similarly prepared using 252 μL of tripropylamine (TRIP; > 98% purity). The third, Mix-CHCA, was prepared by mixing equal volumes of the MI-CHCA and TRIP-CHCA solutions. DHB matrix was prepared by dissolving DHB (99% purity) to 50 mg/mL in 1:1 (v/v) LC-grade etha-nol:water and 0.1% trifluoroacetic acid solvent.
Sample Preparation
Single cell samples were prepared from a total of two A. californica and seven Rattus norvegicus animals. Sample preparation details are provided in the Supporting Information, Sample Preparation.
Instrumentation
The single cell profiling experiments were performed on two instruments. The first, a customized hybrid MALDI/C60-SIMS Q-TOF mass spectrometer, described in detail elsewhere,46 was operated in positive ion mode for all SIMS measurements. Negative ion mode on the custom instrument did not provide sufficient ion current during the single cell experiments. The C60-SIMS instrument required minor hardware modifications to utilize the previously-reported cell finding software32,33 for single cell measurements (for details, see Supporting Information, C60 SIMS Instrument Modifications, and Figure S1A and B).
Single cell SIMS profiling was accomplished by registering the x,y translation stage of the oMALDI server (AB Sciex, Framingham, MA) with whole-slide, bright-field, and fluorescence images. Cells deposited onto indiumtitanium oxide (ITO)-coated glass slides were placed into a custom sample holder that can accommodate slides as large as 40 × 25 mm2 (about one-half of a standard microscope slide). Several mechanically-etched fiducial markers facilitated point-based similarity registration to map cell locations back to the stage coordinate. Due to limitations with the SIMS instrument control, mass spectral data were continuously acquired as the stage moved. Because the sample stage repeatedly travels and stops at cell locations, it is critical to synchronize its movements with the primary C60+ ion beam activity and record when a cell is reached. The ion beam should only be “On” when the cell location is reached, and “Off” during sample stage movement, to ensure that only targeted cells are bombarded with primary ions. To perform these functions, an Arduino ATmega 2560 microcontroller (www.arduino.cc) was interfaced with the ion beam, mass analyzer, and linear encoders of the x,y translation stage, and a datalogging computer. The dwell time of the translation stage was set to 6 s per cell. For each cell, the C60+ ion beam was signaled to turn on for 1 s after a 3 s delay. The 1 s desorption time was found to be optimal, as shorter times yielded inadequate signals whereas longer beam exposure caused IL matrix depletion and complication of the mass spectra with additional background ion signals. The acquisition rate on the mass spectrometer was set to 2 s to improve the likelihood that the entire analyte sputtering event was captured in a single scan. In ∼20% of scans, the analyte sputtering event was split between two acquisition windows, resulting in a separation of low mass and high mass ions between two mass spectra (see Figure S1C).
The second instrument used was a Bruker ultrafleXtreme MALDI TOF/TOF mass spectrometer with a frequency tripled Nd:YAG solid state laser. Single cell MALDI MS analysis was performed as previously reported.32,33 Additional details are provided in the Supporting Information, Instrument Parameters.
Optical Imaging and Determination of Pixel Coordinates for Individual Cells
Each dispersed cell population on an ITO-coated glass slide was imaged using an Axio Imager M2 (Carl Zeiss, Oberkochen, Germany) in fluorescence and bright-field modes. An X-CITE 120 mercury lamp (Lumen Dynamics, Mississauga, Canada) and a 31000v2 DAPI filter set (Chroma Technology, Irvine, CA) were employed for fluorescence imaging. Because the ITO glass slides are transparent and conductive, they are compatible for both MALDI MS and SIMS single cell profiling experiments. A 10× objective was used to obtain a mosaic image of the targeted surface with 13% overlap between neighboring images. Images were taken using an Axio-Cam 503 Mono camera (Carl Zeiss) with a resolution of 1936 × 1460 pixels. All mosaic optical images were stitched with a minimum overlap of 5% and maximum shift of 10%. The stitched image was loaded into lab-built software32 for either manual or automatic cell finding. The fiducial marks were used to register the image coordinates to the x,y translation stage coordinate of the mass spectrometers. Based on the registration, the cell coordinates were saved in either a pattern coordinate file-format readable by the oMALDI server for SIMS experiments or a custom geometry file for the MALDI-MS FlexControl software for mass spectral acquisition.
Matrix Application
ITO-coated glass slides were affixed onto a rotating plate for automatic matrix application, as described elsewhere.32 Spraying conditions were optimized for each MS system. The distance between the spray tip and the rotating plate was 5 cm for SIMS and 2 cm for MALDI MS, with a nitrogen gas pressure of 50 psi. The solution flow rate was set to 30 mL/h for SIMS and 10 mL/h for MALDI MS, resulting in a matrix coating of 6 mg/cm2 and 15 mg/cm2, respectively. DHB matrix was also employed for MALDI MS for comparison with the IL matrices. The same spraying conditions were used for DHB as in IL MALDI-MS.
Results and Discussion
IL Matrix Enables Detection of Lipids in Single Cell SIMS Profiling Experiments
SIMS ionization allows the characterization of small molecules with high spatial resolution. Although SIMS does not require a matrix,31 analysis of small-volume samples and low-concentration analytes can benefit from such treatments.36,38,39,58 A. californica pedal ganglia neurons (∼75 μm or larger in diameter) were used to validate cell targeting and examine the effects of the IL-matrix coating. Several room temperature ILs have been reported to enhance lipid, cholesterol, and peptide signals in SIMS measurements.38-40 The enhancements are somewhat predictable, as ILs used in ME-SIMS are typically mixtures of an organic base and a traditional MALDI matrix, such as CHCA, acting as an acid.
Unlike ME-SIMS with a traditional MALDI matrix, the components of ILs are positively and negatively charged species that favorably assist proton transfer to, or capture from, analytes while preventing matrix crystallization. A total of 47 pedal neurons from two A. californica were examined with SIMS, producing one mass spectrum per cell. The averaged mass spectrum acquired with native conditions is shown in the left two panels of Figure 1A. The same sample was then coated with the MI-CHCA matrix and the same 47 cells were profiled to assess the effect of the IL matrix in SIMS analysis. The averaged mass spectrum acquired with the MI-CHCA coating is shown on the right side of Figure 1A. In both cases, the characteristic signals of α-tocopherol were detected at m/z 430.35 for the intact molecule as well as m/z 165.05 and m/z 205 for the fragments.22,35,49 However, many lipids were detected in the m/z 600–850 mass range exclusively in the presence of MI-CHCA. Although the relative intensity of vitamin E (m/z 430.35) was not significantly different after IL application (p = 0.73), the relative intensity of the phosphocholine head group (m/z 184.07) increased significantly, by two-fold (p <0.005) (Figure 1B). Finally, signals corresponding to fragments, sodiated and potassiated adducts of known glycerophospholipids (m/z 709.5, m/z 782.5, and m/z 808.6), and diacylglycerophosphocholines (m/z 746.5 and m/z 768.5) increased significantly (Figure S2), consistent with previously published SIMS imaging data.49 Profiling of metabolites in the A. californica neurons demonstrates the utility of an IL matrix for SIMS analysis of individual cells.
Figure 1.
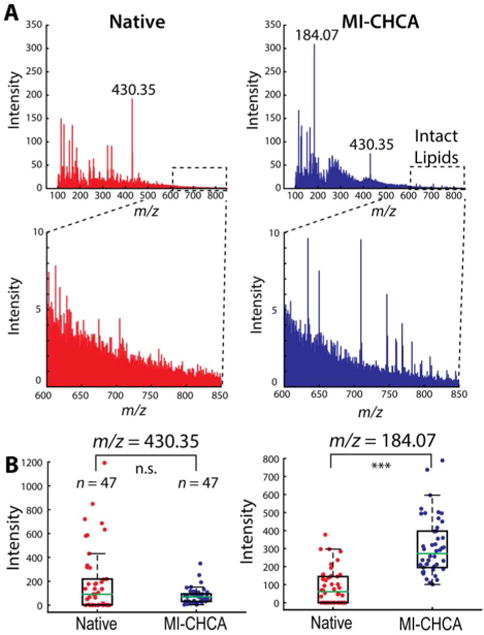
Effect of the IL matrix, MI-CHCA, on single cell profiling of A. californica pedal ganglion neurons with C60-SIMS. (A) The averaged SIMS mass spectrum acquired from a batch of single A. californica pedal ganglion neurons not treated (left, red) and treated (right, blue) with MI-CHCA matrix. (B) Box plots of α-tocopherol (m/z 430.35) and phosphocholine head group (m/z 184.07) signal intensities detected at two studied conditions. The statistical significance in each comparison was determined by a Wilcoxon rank sum test, *** p <0.0005, n.s. - not significant, n = 47 cells from two animals.
IL Matrix Optimization for SIMS Analysis of DRGs
While the profiling of pedal ganglion neurons demonstrates the capabilities of MI-CHCA for SIMS single cell lipid detection, other matrix compositions were investigated to improve the figures of merit.
Matrix Composition
A matrix capable of proton transfer will likely assist in the ionization of lipid compounds during SIMS ionization.38 Furthermore, for single cell profiling experiments it is imperative that the matrix uniformly covers the sample. Uniform coverage partially depends on interactions between the IL and substrate surface. Micrographs of an ITO-coated glass slide spray-coated with the MI-CHCA matrix (Figure S3A) show the matrix deposition non-uniformity when MI-CHCA solution was sprayed coated on a clean ITO glass slide. Similar to many imidazolium-based ILs, the high surface tension of MI-CHCA may lead to generation of non-uniform “puddles” on the surface.41 Poor matrix coverage introduces experimental cell-to-cell variability and redistributes analytes and background contaminants from uncoated regions of the substrate. Therefore, while MI-CHCA is a suitable matrix for general-purpose SIMS analyses, single cell SIMS measurements require improvements in matrix properties. Advantages of using IL matrices include the flexibility to tailor their physical properties by modifying IL components, or by utilizing different matrix mixtures.
Previous studies on IL structures suggest that increasing the alkyl chain lengths produces ILs with lower surface tensions, leading to more uniform sample coverage.41 As such, the TRIP-CHCA matrix was considered, as well as an equal-volume mixture of MI-CHCA and TRIP-CHCA, referred to here as Mix-CHCA. Both TRIP-CHCA and Mix-CHCA showed more uniform sample coverage with the same coating conditions (see Figure S3A). Although previous reports demonstrated that MI-CHCA provides higher signal enhancement for SIMS than TRIP-CHCA,38,39 the uniformity of the matrix coating was not considered in those studies; rather, the matrix and analyte solutions were mixed and spotted on the substrate.38,39
The three IL matrices—MI-CHCA, TRIP-CHCA, Mix-CHCA—were evaluated for lipid analysis of rat DRG cells. The DRG contains a variety of physiologically important lipids, making it a viable model for method development in the study of biologically significant lipid contents.59,60 Lipids have been shown to influence the activities of DRG neurons, and changes in lipid metabolism have been implicated in chronic neuropathic and inflammatory pain.60-63 For these comparisons between IL matrices, glycerol-stabilized DRG cell samples were washed with ammonium acetate buffer and stored in a nitrogen-purged dry box for 24 h before IL matrix application and MS analysis.
The observed lipid profiles obtained from the same animal using the three different IL matrices, and using Mix-CHCA across different animals, were compared. At least 300 DRG cells in each sample were profiled in each set of measurements. To prevent measurement bias from inadequate lipid signals occurring due to: (a) systematic errors in cell coordinate registration; (b) random motor slop; (c)
IL matrix application quality; or (d) inadequate ionization enhancement provided by the investigated matrix,38,39 single cell spectra with an m/z 184.07 (phosphocholine head group) signal intensity of less than 250 counts were removed from subsequent analyses. The fraction of removed cells provides a measure of matrix quality, assuming systematic errors did not vary significantly among different batches. As shown in Figure S3B, TRIP-CHCA had the highest fraction of removed mass spectra, likely reflecting lower repeatability of analyte extraction or matrix enhancement with this IL matrix. The fraction of removed single cell mass spectra using Mix-CHCA was lower than even MI-CHCA when comparing samples from the same animal.
Figure 2A shows the principal component analysis (PCA) score and loading plots of the filtered data sets. The data acquired using the three IL matrices are well separated (no overlap of the 95% confidence ellipses), whereas the three data sets obtained using three animals and Mix-CHCA overlap significantly. The score plots suggest that the matrix-related differences in data sets are larger than day-to-day and animal-to-animal variability. Mass spectra of individual cells investigated with MI-CHCA and characterized by negative PC1 scores generally had lower lipid signals and strong chemical noise in the m/z 200–400 range, as shown by the averaged mass spectra and the loading plot of PC1 (Figure 2A). The use of Mix-CHCA improved the number of cells with abundant lipid signals while reducing chemical noise. The relative signal intensities and number of analytes observed with Mix-CHCA are comparable to that of MI-CHCA, and significantly better than TRIP-CHCA (see Figure 2B), suggesting that the presence of TRIP in the mixture does not adversely affect lipid signal intensities. Taking into account the uniform sample coverage and matrix enhancement, Mix-CHCA was chosen for further single-cell profiling with ME-SIMS.
Figure 2.
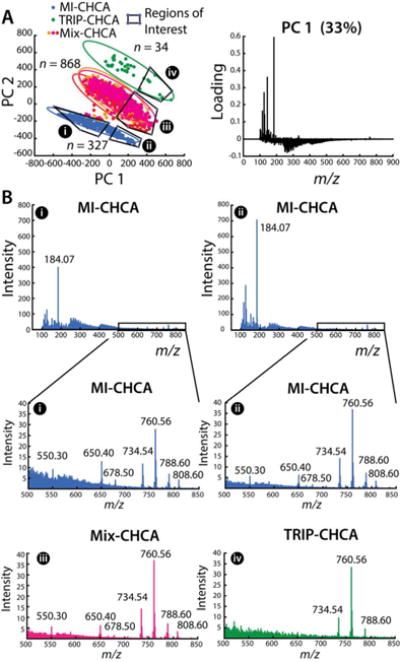
Multivariate analysis of the effects of different IL matrices on ME-SIMS measurements of 1229 individual DRG cells. (A) PCA score and PC1 loading plots showing the separation between the three different IL matrices. 95% confidence ellipses are shown for each condition with regions of interest outlined and labeled (i-iv). (B) Averaged spectra of DRG in negative (i) and positive (ii) PC1 score regions. The corresponding averaged mass spectra of regions i–iv for m/z regions populated by intact lipid signals. The identified lipid peaks are annotated with their m/z values.
Sample Preparation
Previous single cell studies suggested that cells analyzed shortly after isolation and sample preparation produce higher analyte signal intensities than those with prolonged storage, as sample degradation significantly reduces endogenous analyte concentrations.35 In agreement with these findings, Figure S4 shows that sample storage profoundly impaired data quality. DRG cell samples prepared and analyzed on the same day produced lipid signals three-fold more intense than signals acquired from similar samples that were stored for one day in a dry nitrogen atmosphere prior to IL matrix application. The improved sensitivity allows the detection of many minor lipid species. Most lipids detected in the m/z 600–850 range are phosphatidylcholines (PCs), as confirmed by tandem MS (Figure S5 and Table S1). A number of the observed PCs exhibit alkyl chains possessing between 30 and 36 carbons. The alkyl chains have at least two unsaturated forms as well as the fully saturated form (inset in Figure S4B). The improved sensitivity from analysis of fresh biological samples is in agreement with prior MALDI-MSI data from rat brain tissue.64
ME-SIMS Single Cell Profiling Provides Complementary Data to MALDI MS
From individual DRG cells, PC(34:1) at m/z 760.56 and PC(32:0) at m/z 734.54 displayed the highest relative intensity, with m/z 760.56 as the base peak with SIMS. To verify that the single cell SIMS measurements produce semi-quantitative information on endogenous lipid levels similar to MALDI MS, DRG cell profiling was also conducted with the Bruker ultrafleXtreme MALDI TOF/TOF mass spectrometer. A comparative analysis of freshly prepared samples coated with either DHB or MI-CHCA matrix was conducted. The Mix-CHCA matrix performed poorly for MALDI MS (lower total ion counts with a strong bias towards low-mass matrix peaks; data not shown) although the lipid distributions obtained with Mix-CHCA are consistent with those obtained with MI-CHCA and DHB (see Figure S6 and Figure 3). The analyte signal profiles in the averaged mass spectra in the m/z 500–850 region agree qualitatively.
Figure 3.
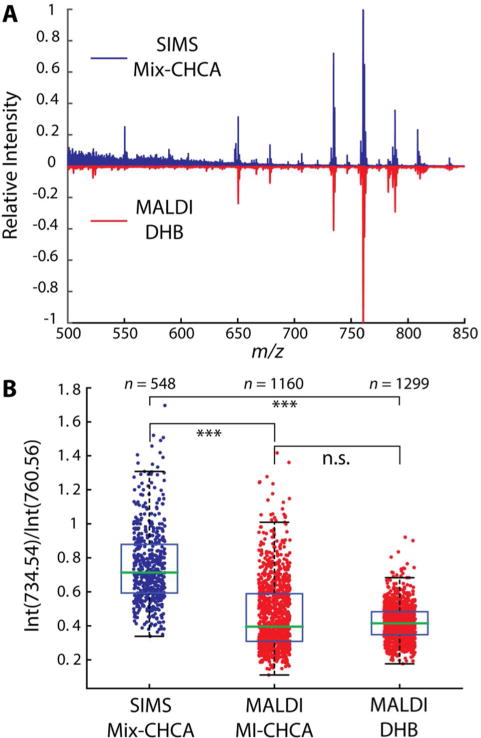
Comparison of lipid profiles detected in single DRG cells using ME-SIMS and MALDI MS. (A) The averaged mass spectra acquired from single DRG cells using SIMS (top, blue) and MALDI MS (bottom, red). (B) Quantitative comparison of the ratio of signal intensities of two dominant lipids, PC(32:0) at m/z 734.54 and PC(34:1) at m/z 760.56, between SIMS and MALDI MS measurements. *** p <0.005, n.s. - not significant as determined by a Wilcoxon rank sum test. The number n indicates the total number of DRG cells in each data set.
Quantitatively, the m/z 760.56 peak was typically the base peak in either analysis but the relative intensity of m/z 734.54 increased in the ME-SIMS experiments. Whereas SIMS investigates only the top few molecular layers of a sample, the inherent analyte extraction from sample volumes that occurs during MALDI matrix application leads to acquisition of mass spectra representative of the whole-cell content. Therefore, SIMS mass spectra likely possess signals more specific for the surface of cell membranes, producing the observed difference in lipid intensity ratios between the two approaches (Figure 3B). However, since the relative abundance of the two PC lipids is not significantly different between MALDI MS using DHB and MI-CHCA (Figure 3), the choice of the IL matrix in MALDI MS measurements does not lead to a change in the relative sensitivity during lipid detection.
The mass spectral peaks at m/z 478.3, 496.3, 522.3, and 550.3 (data not shown) are likely fragments of glycerophospholipids. This conclusion is made based on similarity in their m/z values to those of reported molecules and the presence of a peak at m/z 184.07 in the tandem MS product ion mass spectra of PC(32:0) at m/z 734.54 and PC(34:1) at m/z 760.56, and other lipids (Figure S5). Therefore, variations in the degree of analyte fragmentation between SIMS and MALDI MS may also account for the offset in detected ratios of intact lipids (Figure 3B). In summary, the relative lipid composition observed with SIMS appears to reflect endogenous cell content and provides complementary chemical information to MALDI MS.
Single Cell Profiling with SIMS Enables Differentiation of Cell Types with Similar Lipid Compositions
As discussed in the previous section, the relative PC lipid ratio from single cell ME-SIMS profiling appears to be an intrinsic property of a given cellular origin, at least for the cell types assayed here. However, incorporating more intact lipids into a multivariate dimension reduction, such as t-SNE, may improve identification of additional subpopulations based on variations in minor lipid species. To determine the capability of SIMS to distinguish single cells with similar lipid profiles, neuron populations from the DRG and cerebellum were individually profiled. For each cell type, two technical replicates were performed with a total of 548 DRG cells and 995 cerebellum cells. The same threshold limit of 250 counts for m/z 184.07 was applied as before (see Supporting Information, Threshold Limit for Mass Spectral Filtering, and Figures S11 and S12). The set of lipid compounds detected from cerebellum neurons is similar to DRG cells, and the two most dominant PC lipids, PC(32:0) and PC(34:1), are the same in both cell types. The mass spectra acquired from DRG and cerebellar cells have a number of signals within the m/z 700–850 range, corresponding to intact lipids. The spectra were normalized to intensities of the PC(34:1) m/z 760.56 signal.
The resulting data set was analyzed with t-SNE to provide a visual representation of the sample heterogeneity. Additional details about t-SNE analysis can be found in Supporting Information, Multivariate Statistical Analysis. Figure 4A shows the separation of DRG and cerebellum neurons determined by t-SNE. These cells from different origins are well-separated, with minimal overlap between the corresponding data sets, depicted by 95% confidence ellipses. The identity of the base peaks is distinct between the two averaged mass spectra acquired from each cell type. For DRGs, the unsaturated PC(34:1) at m/z 760.56 is the most intense signal, whereas for cerebellum neurons, the saturated PC(32:0) is the most intense peak. The high intensities of PC(32:0) and PC(34:1) signals may reflect the specific roles of these compounds in membrane integrity and fluidity. The cerebellar cell membranes, with relatively more PC(32:0), are expected to be less rigid than the membranes of larger DRG cells in which unsaturated PC(34:1) produces the strongest signal. This simple test illustrates the facile differentiation of nervous system cell types corresponding to their origin, based on lipid profiles.
Figure 4.
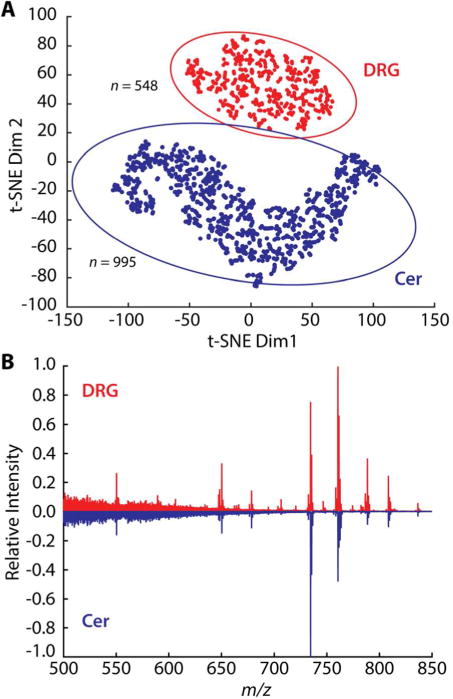
Origin-related differentiation of cell types based on single cell SIMS profiling. (A) t-SNE plot of DRG and cerebellar (Cer) cell data sets with 95% confidence ellipses. (B) The averaged mass spectra acquired from single DRG (red) and cerebellar cells (blue).
Multivariate Statistical Analysis Reveals Subpopulations of DRG and Cerebellar Cells
Figure 5A shows the two clusters obtained from k-means clustering of the t-SNE distributions. k-means classifies spectra according to their distance on the t-SNE plot and groups them into a specified number of clusters. Qualitatively, the two clusters differ based on the relative intensities of PC(34:1) and PC(32:0) signals, as well as the relative abundance of minor lipids such as PC(36:1) at m/z 788.60, PC(38:5) at m/z 808.60, and PC(40:5) at m/z 836.60. One can argue that the difference observed here arose due to experimental factors such as target accuracy and cell finding errors. However, the average spectra contain similar signal to noise ratios (S/N) (see Figure 5B), indicating the cells from each subpopulation were analyzed with similar target accuracy. Additionally, if target accuracy was poor, the mass spectra would be expected to cluster based on cell diameters, since larger cells could tolerate higher uncertainty in target positioning. Therefore, our data suggest the presence of at least two chemically distinct DRG cell populations. As seen in Figure 5B, in the first subpopulation (red), the relative signal intensities of other lipids to PC(34:1) are higher than in the second population (blue). The two cell clusters appear to distribute similarly along the cell size axis (Figure 5C). A previous study suggested that an increase in the relative lipid content due to peripheral inflammation occurs mainly in small-diameter DRG cells, but not in larger-diameter cells.60 Thus, the method described here can be instrumental in further characterization of such changes on a single cell level within these populations.60 6060
Figure 5.
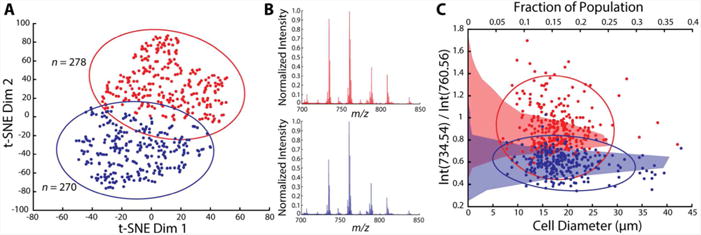
Identification of chemically distinct subpopulations of DRG neurons. (A) k-means clusters based on t-SNE distribution of data sets acquired from populations of single DRG cells. (B) Representative averaged spectra for each cluster. (C) Plot of ratios of intensities of m/z 734.54 and m/z 760.56 signals as a function of cell diameter. Cell diameters are determined after glycerol stabilization and drying, and therefore, are smaller than expected in vivo. Points on the plot are colored in correspondence with the k-means clusters in panel A. The averaged normalized intensities of PC(32:0) signals are 0.91 and 0.59 for cluster 1 (red) and cluster 2 (blue), respectively. A horizontal histogram of the relative population of each cluster based on the relative signal intensity ratio between PC(32:0) and PC(34:1) is shown as an area filled with the corresponding color. The 95% confidence ellipses are shown in scatter plots in A and C.
A similar multivariate analysis was performed on the cerebellar cell data set (Figure 6). Here, k-means clustering was optimal with four subpopulations. Unlike the outcome of the DRG data set analysis, the clusters are more distinct in the t-SNE space (Figure 6A). Qualitatively, the most intense PC(32:0) signal changed noticeably between clusters, increasing in clockwise order from the green to red cluster in the t-SNE space. The intensity of the saturated PC(34:0) at m/z 762.56 also followed the same trend (Figure 6B). Taking into account cell diameter and the size of the primary ion footprint, it is unlikely that some cells were partially sampled and passed the quality threshold (Figure 6C). However, the S/N for the yellow cluster is lower than the other clusters, primarily in the region outlined in Figure S7, suggesting that the cells in this cluster with high values of Int(734.54)/Int(760.56) may be “nearly-missed” cells rather than a separate subpopulation. The population and subpopulation classifications for the DRG and cerebellum cells were repeated with another pair of animals. This set of data was obtained one month after the first set to ensure that the conclusions were not biased by instrument and animal variations.
Figure 6.
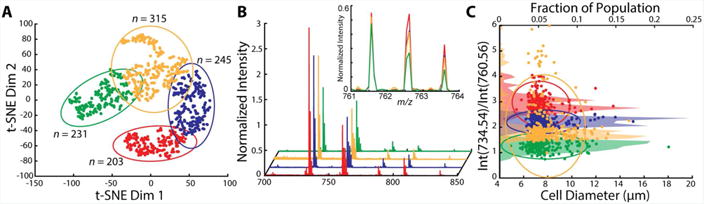
Multivariate analysis of data acquired from populations of single cerebellar cells. (A) k-means clustering of t-SNE distributions. (B) Representative averaged mass spectra of each cluster. The averaged normalized intensities of PC(32:0) signals are 1.3, 2.0, 2.2 and 2.9 for cluster 1 (green), cluster 2 (yellow), cluster 3 (blue), and cluster 4 (red), respectively. The inset shows the relative intensity of m/z 762.56 for each cluster. (C) Plot of ratios of intensities of m/z 734.54 and m/z 760.56 signals (Y axis) as a function of cell diameter (cell diameters are determined after treatment with glycerol and drying, and therefore, are smaller than expected in vivo). A horizontal histogram of the relative population of each cluster based on the relative signal intensity ratio between PC(32:0) and PC(34:1) is shown as an area filled with the corresponding color. The 95% confidence ellipses areshown.
Furthermore, since instrument parameters were optimized for each experiment, the difference in the chemical noise profile for each data set may induce non-biological separation among animals. Hence, we did not combine the two data sets in the same analysis. Nevertheless, in the second data set, a total of 324 DRG cells and 1,249 cerebellum cells were subjected to t-SNE analysis and k-means clustering. The results are consistent with the data presented above for the first data set, and shown in Figures S8–S10. However, for the cerebellum, the presence of only two cellular subpopulations in the second dataset was observed. The values of Int(734.54)/Int(760.56) for the first two populations shown in Figure 6 are identical to the two populations shown in Figure S10 (i.e., 1.3 and 2.0), suggesting that these two populations are biologically relevant. It would be of great interest to correlate these subpopulations to known cerebellum subtypes through the means of other techniques such as immunohistochemistry.
Summary and Conclusions
We describe a high-throughput method for single cell analysis using IL-assisted SIMS with a 20 kV C60+ primary ion beam. The IL matrix, composed of 50:50 (v/v) MI-CHCA and TRIP-CHCA, provided uniform coating coverage and robust enhancement of a number of lipid signals that were otherwise undetectable. Cells from three different model systems were studied: the A. californica central nervous system, and the rat DRG and cerebellum. For each cell type, characteristic metabolites (e.g., α-tocopherol) and lipids (e.g., PCs) were observed. While PC(34:1) was the most abundant lipid in a majority of the studied DRG cells, there were a few cells with more abundant saturated PC(32:0) than unsaturated PC(34:1). These cells also showed an increase in absolute intensities of lipid signals. Therefore, at least two subpopulations (types) of DRG cells can be classified using the approaches presented here. Analysis of the lipid profiles of cells isolated from the rat cerebellum revealed similar lipid compositions as those found in DRG cells. However, PC(32:0) was more frequently observed as the base lipid peak—a characteristic molecular signature to differentiate these two cell types from each other. Further classification of cerebellar cells based on lipid profiles revealed at least two cellular subpopulations.
Our method provides a unique approach to differentiate cell types and subtypes by utilizing lipid ratios as biomarkers, and is applicable to different classes of neuronal cells. Optically-guided ME-SIMS can profile up to 2,000 cells in one experiment at the rate of ∼600 cells/h. These figures of merit are limited by three factors: (a) the size of the sample holder/slide, (b) the control of the ion beam state and its synchronization to mass spectral acquisition, and (c) the ionization efficiency of the primary ion beam. The maximum number of cells assayed per experiment is proportional to the sample area but is also limited by the degradation of IL matrix inside the vacuum chamber, typically occurring after 3–4 h of analysis. A higher energy ion beam would improve ionization efficiency and decrease the acquisition time per cell. Together with better communication and synchronization between the ion beam, sample stage, and mass analyzer, an acquisition rate as fast as 1 Hz can be achieved. The availability of subcellular resolution with SIMS will aid in the discovery of compartment-specific cellular markers. A combination of SIMS and MALDI MS profiling with other non-MS based techniques, including microscopy and spectroscopy, will allow simultaneous and multidimensional characterization of various analyte classes in the same sample, yielding unique and complementary information for each cell.
Supplementary Material
Acknowledgments
We thank Xiying Wang for help with sample preparation, and Joseph Ellis and Elizabeth Neumann for assistance with instrumentation and useful discussions. We gratefully acknowledge support from the National Institutes of Health, Award Number P30 DA018310 from the National Institute on Drug Abuse, and Award Number 1U01 MH109062 from the National Institute of Mental Health. T.J.C. and S.J.B.D. acknowledge support from the National Science Foundation Graduate Research Fellowship Program and the Springborn Fellowship. T.J.C. received additional support through the Training Program at Chemistry-Interface with Biology (T32 GM070421).
Footnotes
Supporting Information: Details about the sample preparation, instrument modifications and parameters, threshold limit for mass spectral filtering, and multivariate statistical analysis, and Figures S1–S12 and Table S1, are provided. The Supporting Information is available free of charge on the ACS Publications website.
References
- 1.Navin NE. Genome Res. 2015;25:1499–1507. doi: 10.1101/gr.191098.115. [DOI] [PMC free article] [PubMed] [Google Scholar]
- 2.Schwartzman O, Tanay A. Nat Rev Genet. 2015;16:716–726. doi: 10.1038/nrg3980. [DOI] [PubMed] [Google Scholar]
- 3.Gawad C, Koh W, Quake SR. Nat Rev Genet. 2016;17:175–188. doi: 10.1038/nrg.2015.16. [DOI] [PubMed] [Google Scholar]
- 4.Rubakhin SS, Romanova EV, Nemes P, Sweedler JV. Nat Methods. 2011;8:S20–29. doi: 10.1038/nmeth.1549. [DOI] [PMC free article] [PubMed] [Google Scholar]
- 5.Ong TH, Tillmaand EG, Makurath M, Rubakhin SS, Sweedler JV. Biochim Biophys Acta. 2015;1854:732–740. doi: 10.1016/j.bbapap.2015.01.008. [DOI] [PMC free article] [PubMed] [Google Scholar]
- 6.Li L, Garden RW, Sweedler JV. Trends Biotechnol. 2000;18:151–160. doi: 10.1016/s0167-7799(00)01427-x. [DOI] [PubMed] [Google Scholar]
- 7.Zenobi R. Science. 2013;342:1243259. doi: 10.1126/science.1243259. [DOI] [PubMed] [Google Scholar]
- 8.Svatos A. Anal Chem. 2011;83:5037–5044. doi: 10.1021/ac2003592. [DOI] [PubMed] [Google Scholar]
- 9.Gode D, Volmer DA. Analyst. 2013;138:1289–1315. doi: 10.1039/c2an36337b. [DOI] [PubMed] [Google Scholar]
- 10.Kolitz SE, Lauffenburger DA. Biochemistry. 2012;51:7433–7443. doi: 10.1021/bi300846p. [DOI] [PMC free article] [PubMed] [Google Scholar]
- 11.Patel AP, Tirosh I, Trombetta JJ, Shalek AK, Gillespie SM, Wakimoto H, Cahill DP, Nahed BV, Curry WT, Martuza RL, Louis DN, Rozenblatt-Rosen O, Suva ML, Regev A, Bernstein BE. Science. 2014;344:1396–1401. doi: 10.1126/science.1254257. [DOI] [PMC free article] [PubMed] [Google Scholar]
- 12.Heath JR, Ribas A, Mischel PS. Nat Rev Drug Discov. 2016;15:204–216. doi: 10.1038/nrd.2015.16. [DOI] [PMC free article] [PubMed] [Google Scholar]
- 13.Chen X, Love JC, Navin NE, Pachter L, Stubbington MJT, Svensson V, Sweedler JV, Teichmann SA. Nat Biotechnol. 2016;34:1111–1118. doi: 10.1038/nbt.3721. [DOI] [PubMed] [Google Scholar]
- 14.Lanni EJ, Rubakhin SS, Sweedler JV. J Proteomics. 2012;75:5036–5051. doi: 10.1016/j.jprot.2012.03.017. [DOI] [PMC free article] [PubMed] [Google Scholar]
- 15.Fujii T, Matsuda S, Tejedor ML, Esaki T, Sakane I, Mizuno H, Tsuyama N, Masujima T. Nat Protoc. 2015;10:1445–1456. doi: 10.1038/nprot.2015.084. [DOI] [PubMed] [Google Scholar]
- 16.Si T, Li B, Zhang K, Xu Y, Zhao H, Sweedler JV. J Proteome Res. 2016;15:1955–1962. doi: 10.1021/acs.jproteome.6b00127. [DOI] [PMC free article] [PubMed] [Google Scholar]
- 17.Amantonico A, Urban PL, Fagerer SR, Balabin RM, Zenobi R. Anal Chem. 2010;82:7394–7400. doi: 10.1021/ac1015326. [DOI] [PubMed] [Google Scholar]
- 18.Fernandez R, Carriel V, Lage S, Garate J, Diez-Garcia J, Ochoa B, Castro B, Alaminos M, Fernandez JA. ACS Chem Neurosci. 2016;7:624–632. doi: 10.1021/acschemneuro.6b00010. [DOI] [PubMed] [Google Scholar]
- 19.Rompp A, Spengler B. Histochem Cell Biol. 2013;139:759–783. doi: 10.1007/s00418-013-1097-6. [DOI] [PMC free article] [PubMed] [Google Scholar]
- 20.Rompp A, Guenther S, Takats Z, Spengler B. Anal Bioanal Chem. 2011;401:65–73. doi: 10.1007/s00216-011-4990-7. [DOI] [PubMed] [Google Scholar]
- 21.Soltwisch J, Kettling H, Vens-Cappell S, Wiegelmann M, Muthing J, Dreisewerd K. Science. 2015;348:211–215. doi: 10.1126/science.aaa1051. [DOI] [PubMed] [Google Scholar]
- 22.Monroe EB, Jurchen JC, Lee J, Rubakhin SS, Sweedler JV. J Am Chem Soc. 2005;127:12152–12153. doi: 10.1021/ja051223y. [DOI] [PubMed] [Google Scholar]
- 23.Song Y, Nelp MT, Bandarian V, Wysocki VH. ACS Cent Sci. 2015;1:477–487. doi: 10.1021/acscentsci.5b00251. [DOI] [PMC free article] [PubMed] [Google Scholar]
- 24.Shrestha B, Vertes A. Anal Chem. 2014;86:4308–4315. doi: 10.1021/ac500007t. [DOI] [PubMed] [Google Scholar]
- 25.Hofmann J, Hahm HS, Seeberger PH, Pagel K. Nature. 2015;526:241–244. doi: 10.1038/nature15388. [DOI] [PubMed] [Google Scholar]
- 26.Bernstein SL, Dupuis NF, Lazo ND, Wyttenbach T, Condron MM, Bitan G, Teplow DB, Shea JE, Ruotolo BT, Robinson CV, Bowers MT. Nat Chem. 2009;1:326–331. doi: 10.1038/nchem.247. [DOI] [PMC free article] [PubMed] [Google Scholar]
- 27.Kopysov V, Makarov A, Boyarkin OVJ. Phys Chem Lett. 2016;7:1067–1071. doi: 10.1021/acs.jpclett.6b00292. [DOI] [PubMed] [Google Scholar]
- 28.Gonzalez Florez AI, Mucha E, Ahn DS, Gewinner S, Schollkopf W, Pagel K, von Helden G. Angew Chem Int Ed Engl. 2016;55:3295–3299. doi: 10.1002/anie.201510983. [DOI] [PMC free article] [PubMed] [Google Scholar]
- 29.Cong X, Liu Y, Liu W, Liang X, Russell DH, Laganowsky AJ. Am Chem Soc. 2016;138:4346–4349. doi: 10.1021/jacs.6b01771. [DOI] [PubMed] [Google Scholar]
- 30.Gault J, Donlan JA, Liko I, Hopper JT, Gupta K, Housden NG, Struwe WB, Marty MT, Mize T, Bechara C, Zhu Y, Wu B, Kleanthous C, Belov M, Damoc E, Makarov A, Robinson CV. Nat Methods. 2016;13:333–336. doi: 10.1038/nmeth.3771. [DOI] [PMC free article] [PubMed] [Google Scholar]
- 31.Boxer SG, Kraft ML, Weber PK. Annu Rev Biophys. 2009;38:53–74. doi: 10.1146/annurev.biophys.050708.133634. [DOI] [PubMed] [Google Scholar]
- 32.Jansson ET, Comi TJ, Rubakhin SS, Sweedler JV. ACS Chem Biol. 2016;11:2588–2595. doi: 10.1021/acschembio.6b00602. [DOI] [PMC free article] [PubMed] [Google Scholar]
- 33.Ong TH, Kissick DJ, Jansson ET, Comi TJ, Romanova EV, Rubakhin SS, Sweedler JV. Anal Chem. 2015;87:7036–7042. doi: 10.1021/acs.analchem.5b01557. [DOI] [PMC free article] [PubMed] [Google Scholar]
- 34.Passarelli MK, Newman CF, Marshall PS, West A, Gilmore IS, Bunch J, Alexander MR, Dollery CT. Anal Chem. 2015;87:6696–6702. doi: 10.1021/acs.analchem.5b00842. [DOI] [PubMed] [Google Scholar]
- 35.Tucker KR, Li Z, Rubakhin SS, Sweedler JVJ. Am Soc Mass Spectrom. 2012;23:1931–1938. doi: 10.1007/s13361-012-0472-1. [DOI] [PMC free article] [PubMed] [Google Scholar]
- 36.Dunham SJ, Comi TJ, Ko K, Li B, Baig NF, Morales-Soto N, Shrout JD, Bohn PW, Sweedler JV. Biointerphases. 2016;11:02A325. doi: 10.1116/1.4942884. [DOI] [PMC free article] [PubMed] [Google Scholar]
- 37.Wehbe N, Mouhib T, Prabhakaran A, Bertrand P, Delcorte A. J Am Soc Mass Spectrom. 2009;20:2294–2303. doi: 10.1016/j.jasms.2009.08.022. [DOI] [PubMed] [Google Scholar]
- 38.Dertinger JJ, Walker AV. J Am Soc Mass Spectrom. 2013;24:348–355. doi: 10.1007/s13361-012-0568-7. [DOI] [PubMed] [Google Scholar]
- 39.Fitzgerald JJ, Kunnath P, Walker AV. Anal Chem. 2010;82:4413–4419. doi: 10.1021/ac100133c. [DOI] [PubMed] [Google Scholar]
- 40.Bundaleski N, Caporali S, Chenakin SP, Moutinho AMC, Teodoro OMND, Tolstogouzov A. Int J Mass Spectrom. 2013;353:19–25. [Google Scholar]
- 41.Tariq M, Freire MG, Saramago B, Coutinho JA, Lopes JN, Rebelo LP. Chem Soc Rev. 2012;41:829–868. doi: 10.1039/c1cs15146k. [DOI] [PubMed] [Google Scholar]
- 42.Zimmerman TA, Rubakhin SS, Sweedler JV. J Am Soc Mass Spectrom. 2011;22:828–836. doi: 10.1007/s13361-011-0111-2. [DOI] [PMC free article] [PubMed] [Google Scholar]
- 43.Schober Y, Guenther S, Spengler B, Rompp A. Anal Chem. 2012;84:6293–6297. doi: 10.1021/ac301337h. [DOI] [PubMed] [Google Scholar]
- 44.Hua X, Szymanski C, Wang Z, Zhou Y, Ma X, Yu J, Evans J, Orr G, Liu S, Zhu Z, Yu XY. Integr Biol (Camb) 2016;8:635–644. doi: 10.1039/c5ib00308c. [DOI] [PubMed] [Google Scholar]
- 45.Parry S, Winograd N. Anal Chem. 2005;77:7950–7957. doi: 10.1021/ac051263k. [DOI] [PubMed] [Google Scholar]
- 46.Lanni EJ, Dunham SJ, Nemes P, Rubakhin SS, Sweedler JV. J Am Soc Mass Spectrom. 2014;25:1897–1907. doi: 10.1007/s13361-014-0978-9. [DOI] [PubMed] [Google Scholar]
- 47.Sjovall P, Lausmaa J, Johansson B. Anal Chem. 2004;76:4271–4278. doi: 10.1021/ac049389p. [DOI] [PubMed] [Google Scholar]
- 48.Phan NT, Fletcher JS, Ewing AG. Anal Chem. 2015;87:4063–4071. doi: 10.1021/acs.analchem.5b00555. [DOI] [PubMed] [Google Scholar]
- 49.Passarelli MK, Ewing AG, Winograd N. Anal Chem. 2013;85:2231–2238. doi: 10.1021/ac303038j. [DOI] [PMC free article] [PubMed] [Google Scholar]
- 50.Angerer TB, Pour MD, Malmberg P, Fletcher JS. Anal Chem. 2015;87:4305–4313. doi: 10.1021/ac504774y. [DOI] [PubMed] [Google Scholar]
- 51.Sapunar D, Kostic S, Banozic A, Puljak L. J Pain Res. 2012;5:31–38. doi: 10.2147/JPR.S26603. [DOI] [PMC free article] [PubMed] [Google Scholar]
- 52.Kishi M, Tanabe J, Schmelzer JD, Low PA. Diabetes. 2002;51:819–824. doi: 10.2337/diabetes.51.3.819. [DOI] [PubMed] [Google Scholar]
- 53.Villiere V, McLachlan EM. J Neurophysiol. 1996;76:1924–1941. doi: 10.1152/jn.1996.76.3.1924. [DOI] [PubMed] [Google Scholar]
- 54.Usoskin D, Furlan A, Islam S, Abdo H, Lonnerberg P, Lou D, Hjerling-Leffler J, Haeggstrom J, Kharchenko O, Kharchenko PV, Linnarsson S, Ernfors P. Nat Neurosci. 2015;18:145–153. doi: 10.1038/nn.3881. [DOI] [PubMed] [Google Scholar]
- 55.Werz MA, Macdonald RL. Nature. 1982;299:730–733. doi: 10.1038/299730a0. [DOI] [PubMed] [Google Scholar]
- 56.Boateng EK, Novejarque A, Pheby T, Rice AS, Huang W. Eur J Pain. 2015;19:236–245. doi: 10.1002/ejp.541. [DOI] [PMC free article] [PubMed] [Google Scholar]
- 57.Wang SS, Kloth AD, Badura A. Neuron. 2014;83:518–532. doi: 10.1016/j.neuron.2014.07.016. [DOI] [PMC free article] [PubMed] [Google Scholar]
- 58.Dertinger JJ, Walker AV. J Am Soc Mass Spectrom. 2013;24:1288–1295. doi: 10.1007/s13361-013-0666-1. [DOI] [PubMed] [Google Scholar]
- 59.Calderon RO, Attema B, DeVries GH. J Neurochem. 1995;64:424–429. doi: 10.1046/j.1471-4159.1995.64010424.x. [DOI] [PubMed] [Google Scholar]
- 60.Barabas ME, Mattson EC, Aboualizadeh E, Hirschmugl CJ, Stucky CL. J Biol Chem. 2014;289:34241–34249. doi: 10.1074/jbc.M114.570101. [DOI] [PMC free article] [PubMed] [Google Scholar]
- 61.Gnanasekaran A, Sundukova M, van denMaagdenberg AM, Fabbretti E, Nistri A. Mol Pain. 2011;7:77. doi: 10.1186/1744-8069-7-77. [DOI] [PMC free article] [PubMed] [Google Scholar]
- 62.Zhang YH, Khanna R, Nicol GD. Neuroscience. 2013;248:562–570. doi: 10.1016/j.neuroscience.2013.06.039. [DOI] [PMC free article] [PubMed] [Google Scholar]
- 63.Patti GJ, Yanes O, Shriver LP, Courade JP, Tautenhahn R, Manchester M, Siuzdak G. Nat Chem Biol. 2012;8:232–234. doi: 10.1038/nchembio.767. [DOI] [PMC free article] [PubMed] [Google Scholar]
- 64.Jackson SN, Wang HY, Woods AS. Anal Chem. 2005;77:4523–4527. doi: 10.1021/ac050276v. [DOI] [PubMed] [Google Scholar]
Associated Data
This section collects any data citations, data availability statements, or supplementary materials included in this article.