Abstract
This study tested the hypothesis that combined therapy with melatonin (Mel) and exendin-4 (Ex4) would be superior to either therapy alone for preventing the deterioration of renal function in cardiorenal syndrome (CRS). Male adult Sprague Dawley rats (n = 48) were randomly and equally divided into sham-control (SC), chronic kidney disease (CKD; induced by 5/6 nephrectomy), CRS (CKD + dilated cardiomyopathy, DCM; induced by doxorubicin 7 mg/kg i.p. every 5 days, 4 doses), CRS-Mel (20 mg/kg/day), CRS-Ex4 (10 µg/kg/day) and CRS-Mel-Ex4. They were euthanized by day 60 after CRS induction. By day 60, plasma creatinine level, urine protein/creatinine ratio and kidney injury histopathology score were highest in CRS, lowest in SC, and progressively decreased from CKD, CRS-Mel, CRS-Ex4 to CRS-Mel-Ex4 (all P<0.0001). The kidney protein expressions of inflammation (TNF-α/NF-κB/MMP-9/iNOS/RANTES), oxidative stress (NOX-1/NOX-2/NOX-4/oxidized protein), apoptosis (cleaved caspase-3/cleaved PARP/Bax), DNA-damaged marker (γ-H2AX) and fibrosis (p-mad3/TFG-β) showed identical patterns of creatinine level, whereas kidney protein expressions of GLP-1R showed a progressive increase from SC to CRS-Mel-Ex4 (all P<0.0001). Cellular expressions of inflammatory (CD14/CD68), DNA/kidney-damaged (γ-H2AX/KIM-1) and podocyte/renal tubule dysfunction signaling (β-catenin/Wnt1/Wnt4) biomarkers in kidney tissue exhibited an identical pattern of creatinine level (all P<0.0001). Podocyte components (podocin/dystroglycan/p-cadherin/synatopodin) were highest in SC, lowest in CRS, and significantly progressively increased from CKD to CRS-Mel-Ex4 (all P<0.0001). In conclusion, combined Mel-Ex4 therapy was superior to either one alone in preserving renal-function and kidney architectural integrity in the setting of CRS.
Keywords: Cardiorenal syndrome, renal function impairment, melatonin, exendin-4
Introduction
Normal cardiac and kidney function are important for long and good quality of life. The heart drives the circulation of blood, which enables its several functions. The kidney has crucial roles in PH-value/electrolyte and water balance, detoxification and excretion, such as of metabolized substances and uremic toxic molecules.
The heart and kidneys work together, but they can also deteriorate together. Left ventricular (LV) dysfunction commonly impacts deleteriously on kidney function, often directly proportionally; this effect is also observed vice versa [1-4]. When LV dysfunction is combined with acute or chronic kidney disease (CKD), so called cardiorenal syndrome (CRS) [1,2,5-9], the deterioration of both organs results in high morbidity and mortality [10-15]. Despite state-of-the-art drugs and invasive treatments, such as renal replacement therapy, the prognosis for patients with CRS remains unfavorable [10-17]. The management of CRS remains a formidable challenge for clinicians [8,13,18] and effective therapies for CRS patients are urgently required.
Commonly considered underlying mechanisms for CRS deterioration include increased oxidative stress, up-regulation of reactive oxygen species (ROS), increased inflammation, and increased cellular apoptosis/death [7,9,19]. Interestingly, melatonin (Mel), mainly secreted by the pineal gland, has been revealed to be a powerful antioxidant [20,21] for suppressing the generation of oxidative stress/ROS, and has anti-inflammatory capacity. Additionally, exendin-4 (Ex4), originally used for controlling blood sugar levels in diabetes mellitus, has been shown to have potent anti-inflammatory capacity [22-27] and inhibits oxidative stress [25,27,28]. Our recent work demonstrated that combined Mel-Ex4 was superior to either one alone for protecting the kidney against ischemia-reperfusion injury [29]. Accordingly, this study tested the hypothesis that combined Mel-Ex4 would be superior to either one alone for protecting the kidney from CRS in a rat model.
Materials and methods
Ethics
All animal experimental procedures were approved by the Institute of Animal Care and Use Committee at Kaohsiung Chang Gung Memorial Hospital (Affidavit of Approval of Animal Use Protocol No. 2014032702) and performed in accordance with the Guide for the Care and Use of Laboratory Animals.
Animals were housed in an Association for Assessment and Accreditation of Laboratory Animal Care International (AAALAC; Frederick, MD, USA)-approved animal facility in our hospital with controlled temperature and light cycles (24°C and 12/12 light cycle).
Determination of doxorubicin regimen for induction of dilated cardiomyopathy (DCM)
Optimal doxorubicin dosage for successful induction of DCM was established in a pilot study. This determined that doxorubicin doses of 20, 10, and 7 mg/kg given to the animals at 4 separate time points within 20 days (once every 5 days) resulted in 100%, 75%, and less than 15% mortality, respectively, by the end of a 60-day time period. Additionally, left ventricular ejection fraction (LVEF) was significantly reduced by 18% in animals receiving 7 mg/kg compared to sham controls (SC) as determined by transthoracic echocardiography performed by a senior cardiologist blinded to protocols and treatments. Thus, four doses of 7 mg/kg doxorubicin given at 5 day intervals were utilized to create a rodent DCM model.
Experimental model of chronic kidney disease (CKD) and definition of CRS in rat
The procedure and protocol of CKD induction have been described previously [30]. Pathogen-free, adult male Sprague-Dawley (SD) rats (n = 48) weighing 320-350 g (Charles River Technology, BioLASCO Taiwan Co. Ltd., Taiwan) were utilized in the current study. Animals in each group were anesthetized (inhalational 2.0% isoflurane) and placed supine on a warming pad (37°C) for midline laparotomies. Animals in the SC group underwent laparotomy only. CKD was induced in other groups of animals by right nephrectomy plus arterial ligation of the blood supply to the upper and middle thirds of the other kidney. This model allows preservation of only a limited volume of functioning renal parenchyma to simulate CKD. DCM and CKD were induced simultaneously to model CRS.
Animal grouping
The 48 animals were randomly and equally divided into six groups (eight animals per group): SC, CKD, CRS (i.e., DCM + CKD), CRS + Mel (20 mg/kg/day i.p. commencing day 20 after CRS induction), CRS + Ex4 (10 μg/kg/day i.p. commencing day 20 after CRS induction), and CRS + Mel + Ex4. Animals in each group were euthanized by day 60 after CRS induction.
Circulating levels of creatinine and BUN, and 24-hour urine collection to determine urine protein to creatinine ratio at day 60 after CRS induction
Blood samples were collected from all animals in each group to measure the changes in serum creatinine and blood urine nitrogen (BUN) levels by day 0 and day 60 after CRS induction.
For 24-hour urine collection, each animal was placed into a metabolic cage [DXL-D, space: 19 × 29 × 55 cm, Suzhou Fengshi Laboratory Animal Equipment, China] for 24 hours with free access to food and water from day 59 to 60 after the CRS procedure. Daily urine volume and the ratio of urine protein to urine creatinine were determined.
Functional assessment by echocardiography
Transthoracic echocardiography (Vevo 2100, Visualsonics, Toronto, Ontario, Canada) was performed in animals from each group prior to and at day 60 after doxorubicin treatment by a veterinary cardiologist blinded to the experimental design. M-mode standard two-dimensional (2D) left parasternal long axis echocardiographic examination was conducted. Left ventricular internal dimensions [i.e., left ventricular end-systolic diameter (LVESd) and left ventricular end-diastolic diameter (LVEDd)] were measured at mitral valve and papillary levels of the left ventricle, as per the American Society of Echocardiography (Morrisville, NC) leading-edge methodology, using at least three consecutive cardiac cycles. Left ventricular ejection fraction (LVEF) was calculated as follows: LVEF (%) = [(LVEDd3-LVESd3)/LVEDd3] × 100%.
Qualitative analysis of kidney injury scores by day 60 after CRS induction
Histopathological scoring of kidney injury was assessed in a blinded fashion as previously reported [25,26,29]. Briefly, kidney specimens from all animals were fixed in 10% buffered formalin, embedded in paraffin, sectioned at 5 μm and stained with hematoxylin and eosin (H&E) for light microscopy. The scoring system, reflecting the grading of tubular necrosis, loss of brush border, cast formation, and tubular dilatation in 10 random non-overlapping fields (200x), was as follows: 0 (none), 1 (≤ 10%), 2 (11-25%), 3 (26-45%), 4 (46-75%), and 5 (≥ 76%).
Western blot analysis
The procedure and protocol for the Western blot analysis was as previously reported [25,26,29]. Briefly, equal amounts (50 mg) of protein extracts from kidney were loaded and separated by SDS-PAGE using acrylamide gradients. After electrophoresis, the separated proteins were transferred electrophoretically to a polyvinylidene difluoride (PVDF) membrane (Amersham Biosciences, Amersham, UK). Nonspecific sites were blocked by incubation of the membrane overnight in blocking buffer (5% nonfat dry milk in Tris-buffered saline containing 0.05% Tween 20). The membranes were incubated with the indicated primary antibodies [NOX-1 (1:1500, Sigma, St. Louis, MO), NOX-2 (1:1500, Sigma, MO), NOX-4 (1:1000, Abcam, Cambridge, MA), cleaved caspase 3 (1:1000, Cell Signaling, Danvers, MA), cleaved Poly (ADP-ribose) polymerase (PARP) (1:1000, Cell Signaling, Danvers, MA), γ-H2AX (1:1000, Cell Signaling, Danvers, MA), glucagon-like-peptide-1 receptor (GLP-1R) (1:1000, Abcam, Cambridge, MA), interleukin (IL)-1β (1:1000, Cell Signaling, Danvers, MA), tumor necrosis factor (TNF)-α (1:1000, Cell Signaling, Danvers, MA), nuclear factor (NF)-κB (1:600, Abcam, Cambridge, MA), MMP-9 (1:3000, Abcam, Cambridge, MA), Bax (1:1000, Abcam, Cambridge, MA), Smad3 (1:1000, Cell Signaling, Danvers, MA), Smad1/5 (1:1000, Cell Signaling, Danvers, MA), transforming growth factor (TGF)-β (1:1000, Abcam, Cambridge, MA), RANTES (1:1000, Cell Signaling, Danvers, MA), inducible nitric oxide synthase (iNOS) (1:250, Abcam, Cambridge, MA) and actin (1:10000, Chemicon, Billerica, MA)] for 1 hour at room temperature. Horseradish peroxidase-conjugated anti-rabbit immunoglobulin IgG (1:2000, Cell Signaling, Danvers, MA) was used as a secondary antibody for one-hour incubation at room temperature. The washing procedure was repeated eight times within one hour. Immunoreactive bands were visualized by enhanced chemiluminescence (ECL; Amersham Biosciences, Amersham, UK) and exposed to Biomax L film (Kodak, Rochester, NY, USA). For quantification, ECL signals were digitized using Labwork software (UVP, Waltham, MA, USA).
Immunohistochemical (IHC) and immunofluorescent (IF) staining
The procedure and protocol of IHC and IF staining were as previously described [25,26,29]. For IHC and IF staining, rehydrated paraffin sections were first treated with 3% H2O2 for 30 minutes and incubated with Immuno-Block reagent (BioSB, Santa Barbara, CA) for 30 minutes at room temperature. Sections were then incubated with primary antibodies specifically against γ-H2AX (1/500, Abcam, Cambridge, MA), CD14 (1/50, Santa Cruz, CA), CD68 (1/100, Abcam, Cambridge, MA), kidney injury molecule (KIM)-1 (1:500, R&D Systems, Minneapolis, MN), podocin (1:50, Abcam, Cambridge, MA), dystroglycan (1:50, Abcam, Cambridge, MA), p-cadherin (1:100, Abcam, Cambridge, MA), synatopodin (1:500, Santa-Cruz, Santa Cruze, CA), β-catenin (1:100, Abcam, Cambridge, MA), Wnt1 (1:200, BioSS, Woburn, MA), Wnt4 (1:200, BioSS, Woburn, MA) and heme oxygenase (HO)-1 (1/250, Abcam, Cambridge, MA), while sections incubated with the use of irrelevant antibodies served as controls. Three sections of kidney from each rat were analyzed. For quantification, three randomly selected HPFs (200 × or 400 × for IHC and IF studies) were analyzed in each section. The mean number of positively-stained cells per HPF for each animal was then determined by summation of all numbers divided by 9.
An IF-based (KIM-1, synatopodin and HO-1) and IHC-based (podocin, dystroglycan, p-cadherin, β-catenin, Wnt1 and Wn4) scoring systems were adopted for semi-quantitative analyses of the biomarkers in the kidney as a percentage of positive cells in a blinded fashion (0 = negative staining; 1 ≤ 15%; 2 = 15-25%; 3 = 25-50%; 4 = 50-75%; 5 ≥ 75%-100% per HPF).
Assessment of oxidative stress
The procedure and protocol for evaluating the protein expressions of oxidative stress were as previously reported [25,26,29]. The Oxyblot Oxidized Protein Detection Kit was purchased from Chemicon (Billerica, MA). 2,4-dinitrophenylhydrazine (DNPH) derivatization was carried out on 6 μg of protein for 15 minutes according to the manufacturer’s instructions. One-dimensional electrophoresis was carried out on 12% SDS/polyacrylamide gel after DNPH derivatization. Proteins were transferred to nitrocellulose membranes that were then incubated in the primary antibody solution (anti-dinitrophenyl [DNP] 1:150) for 2 hours, followed by incubation in secondary antibody solution (1:300) for 1 hour at room temperature. The washing procedure was repeated eight times within 40 minutes. Immunoreactive bands were visualized by enhanced chemiluminescence (ECL; Amersham Biosciences, Amersham, UK) which was then exposed to Biomax L film (Kodak, Rochester, NY, USA). For quantification, ECL signals were digitized using Labwork software (UVP, Waltham, MA, USA). For oxyblot protein analysis, a standard control was loaded on each gel.
Statistical analysis
Quantitative data are expressed as means ± SD. Statistical analysis was adequately performed by ANOVA, followed by Bonferroni multiple-comparison post hoc test. SAS statistical software for Windows version 8.2 (SAS institute, Cary, NC) was utilized. A probability value <0.05 was considered statistically significant.
Results
Transthoracic echocardiographic results at baseline and by day 60, circulating level of creatinine and BUN, and the ratio of urine protein to creatinine by day 60 after CRS induction (Figure 1)
On day 0, circulating levels of BUN and creatinine, and LVEF did not differ among the six groups (Figure 1A, 1C, 1E). However, by day 60 after CRS induction, LVEF was highest in SC and lowest in CRS, significantly higher in CKD than in CRS-Mel-Ex4, CRS-Mel and CRS-Ex4, significantly higher in CRS-Mel-Ex4 than in CRS-Mel and CRS-Ex4, and significantly higher in CRS-Ex4 than in CRS-Mel (Figure 1B). Conversely, the circulating levels of BUN (Figure 1D) and creatinine (Figure 1F) and the urine protein to creatinine ratio (Figure 1G) showed an opposite pattern of LVEF among the six groups. These findings implicate that combined Mel-Ex4 treatment was superior to either therapy alone not only in improving heart function but also in inhibiting the deterioration of renal function in CRS.
Figure 1.
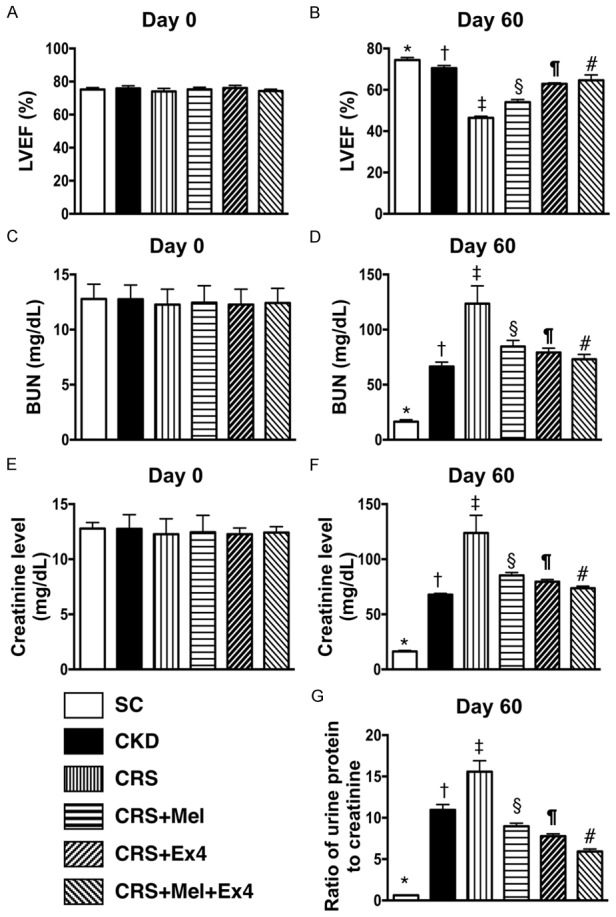
Echocardiographic results and circulating levels of BUN and creatinine prior to and at 60 after CRS induction. A: By day 0, analytical result of left ventricular ejection fraction (LVEF), P>0.5. B: By the day 60, analytical result of LVEF, * vs. other groups with different symbols (†, ‡, §, ¶, #), P<0.0001. C: By day 0, the analytical result of blood urine nitrogen (BUN) level, P>0.5. D: By day 60, analytical results of BUN level, * vs. other groups with different symbols (†, ‡, §, ¶, #), P<0.0001. E: By day 0, analytical result of creatinine level, P>0.5. F: By day 60, analytical result of creatinine level, * vs. other groups with different symbols (†, ‡, §, ¶, #), P<0.0001. G: By day 60, analytical results of ratio of urine protein to creatinine, * vs. other groups with different symbols (†, ‡, §, ¶, #), P<0.0001. All statistical analyses were performed by one-way ANOVA, followed by Bonferroni multiple comparison post hoc test (n = 8 for each group). Symbols (*, †, ‡, §, ¶, #) indicate significance (at 0.05 level). SC = sham control; CKD = chronic kidney disease; CRS = cardiorenal syndrome; Mel = melatonin; Ex4 = exendin-4.
Histopathological findings of renal parenchymal injury by day 60 after CRS induction (Figure 2)
(Figure 2) By the end of the study period, H&E microscopy revealed that the kidney injury score was highest in CRS animals and lowest in SC, significantly higher in CKD than in other groups, significantly higher in CRS-Melatonin and CRSEx4 than in CRS-Mel-Ex4, and significantly higher in CRS-Melatonin than in CRS-Ex4. These findings once again suggest that combined Mel-Ex4 treatment was superior to either treatment alone for protecting the kidney from CRS injury.
Figure 2.
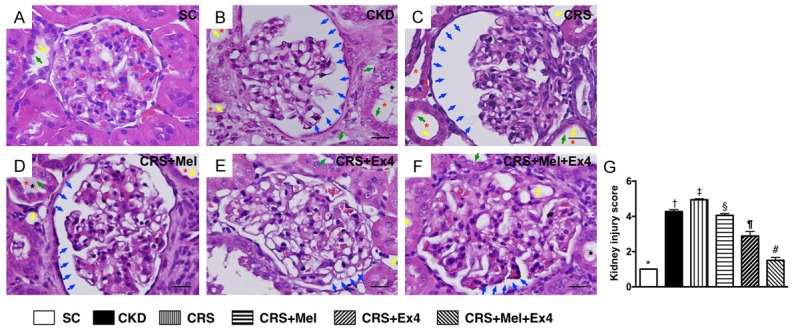
Determinant of histopathological findings of kidney parenchyma by day 60 after CRS procedure. A-F: Light microscopic findings (400 ×) of HE stain illustrating remarkably increased in loss of brush border in renal tubules (yellow arrows), tubular necrosis (green arrows), tubular dilatation (red asterisk) protein cast formation (black asterisk), and dilatation of Bowman’s capsule (blue arrows) in CRS group than in other groups. G: Kidney injury score, * vs. other groups with different symbols (†, ‡, §, ¶, #), P<0.0001. Scale bars in right lower corner represent 20 µm. All statistical analyses were performed by one-way ANOVA, followed by Bonferroni multiple comparison post hoc test (n = 8 for each group). Symbols (*, †, ‡, §, ¶, #) indicate significance (at 0.05 level). SC = sham control; CKD = chronic kidney disease; CRS = cardiorenal syndrome; Mel = melatonin; Ex4 = exendin-4.
Protein expressions of inflammatory and oxidative-stress biomarkers in kidney parenchyma by day 60 after CRS (Figures 3 and 4)
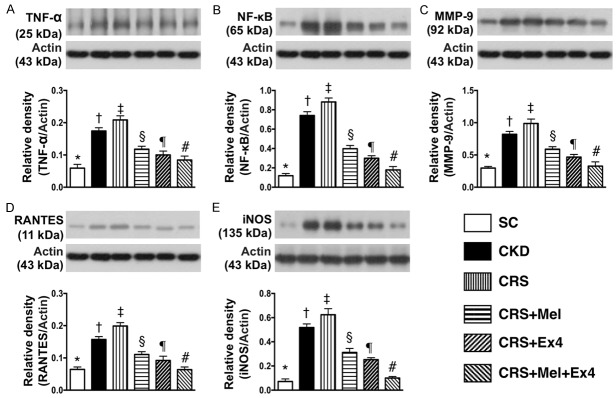
The protein expressions of TNF-α, NF-κB, MMP-9, RANTES, and iNOS, five indices of inflammation, were highest in CRS and lowest in SC, significantly higher in CKD than in CRS-Mel-Ex4, CRS-Mel and CRS-Ex4, significantly higher in CRS-Mel than in CRS-Ex4 and CRS-Mel-Ex4, and significantly higher in CRS-Ex4 than in CRS-Mel-Ex4 (Figure 3). Additionally, the protein expressions of NOX-1, NOX-2 and NOX-4, and oxidized protein, four indicators of oxidative stress, showed an identical pattern of inflammation among the six groups (Figure 4).
Figure 3.
Protein expressions of inflammatory biomarkers in kidney parenchyma by day 60 after CRS. A: Protein expression of tumor necrosis factor (TNF)-α, * vs. other groups with different symbols (†, ‡, §, ¶, #), P<0.0001. B: Protein expression of nuclear factor (NF)-κB, * vs. other groups with different symbols (†, ‡, §, ¶, #), P<0.0001. C: Protein expression of matrix metalloproteinase (MMP)-9, * vs. other groups with different symbols (†, ‡, §, ¶, #), P<0.0001. D: Protein expression of RANTES, * vs. other groups with different symbols (†, ‡, §, ¶, #), P<0.0001. E: Protein expression of inducible nitric oxide synthase (iNOS), * vs. other groups with different symbols (†, ‡, §, ¶, #), P<0.0001. All statistical analyses were performed by one-way ANOVA, followed by Bonferroni multiple comparison post hoc test (n = 8 for each group). Symbols (*, †, ‡, §, ¶, #) indicate significance (at 0.05 level). SC = sham control; CKD = chronic kidney disease; CRS = cardiorenal syndrome; Mel = melatonin; Ex4 = exendin-4.
Figure 4.
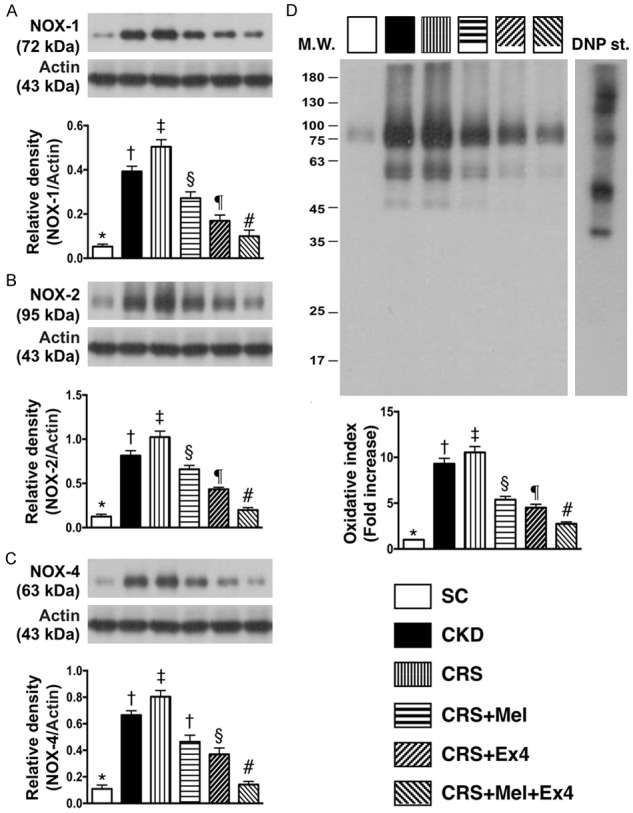
Protein expression of oxidative-stress biomarkers in kidney parenchyma by day 60 after CRS. A: Protein expression of NOX-1, * vs. other groups with different symbols (†, ‡, §, ¶, #), P<0.0001. B: Protein expression of NOX-2, * vs. other groups with different symbols (†, ‡, §, ¶, #), P<0.0001. C: Protein expression of NOX-4, * vs. other groups with different symbols (†, ‡, §, ¶, #), P<0.0001. D: Expression of oxidized protein, * vs. other groups with different symbols (†, ‡, §, ¶, #), P<0.0001. (Note: the left and right lanes shown on the upper panel represent protein molecular weight marker and control oxidized molecular protein standard, respectively). M.W = molecular weight; DNP = 1-3 dinitrophenylhydrazone. All statistical analyses were performed by one-way ANOVA, followed by Bonferroni multiple comparison post hoc test (n = 8 for each group). Symbols (*, †, ‡, §, ¶, #) indicate significance (at 0.05 level). SC = sham control; CKD = chronic kidney disease; CRS = cardiorenal syndrome; Mel = melatonin; Ex4 = exendin-4.
Protein expressions of apoptotic, fibrotic, DNA-damage and anti-fibrotic biomarkers in kidney parenchyma by day 60 after CRS induction (Figure 5)
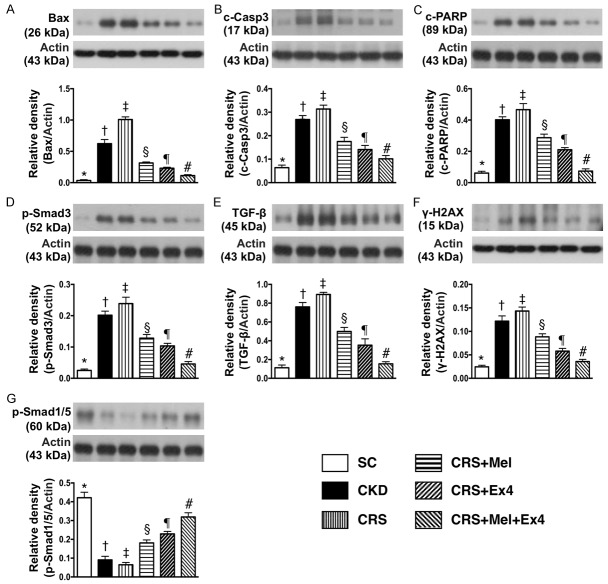
(Figure 5) The protein expressions of Bax, cleaved (c) caspase 3 and c-PARP, three indicators of apoptosis, were highest in CRS and lowest in SC, significantly higher in CKD than in CRS-Mel-Ex4, CRS-Mel and CRS-Ex4, significantly higher in CRS-Mel than in CRS-Ex4 and CRS-Mel-Ex4, and significantly higher in CRS-Ex4 than in CRS-Mel-Ex4. Additionally, the protein expressions of Samd3 and TGF-β, two indices of fibrosis, and γ-H2AX, a DNA-damage marker, exhibited an identical pattern of apoptosis among the six groups. On the other hand, the protein expression of Smad1/5, an indicator of anti-fibrosis, displayed an opposite pattern of apoptosis among the six groups.
Figure 5.
Protein expressions of apoptotic, fibrotic, DNA-damaged and anti-fibrotic biomarkers in kidney parenchyma by day 60 after CRS induction. A: Protein expression of Bax, * vs. other groups with different symbols (†, ‡, §, ¶, #), P<0.0001. B: Protein expression of cleaved caspase 3 (c-Casp-3), * vs. other groups with different symbols (†, ‡, §, ¶, #), P<0.0001. C: Protein expression of cleaved Poly (ADP-ribose) polymerase (c-PARP), * vs. other groups with different symbols (†, ‡, §, ¶, #), P<0.0001. D: Protein expression of Samd3, * vs. other groups with different symbols (†, ‡, §, ¶, #), P<0.0001. E: Protein expression of transforming growth factor (TGF)-β, * vs. other groups with different symbols (†, ‡, §, ¶, #), P<0.0001. F: Protein expression of γ-H2AX, * vs. other groups with different symbols (†, ‡, §, ¶, #), P<0.0001. G: Protein expression of Smad1/5, * vs. other groups with different symbols (†, ‡, §, ¶, #), P<0.0001. All statistical analyses were performed by one-way ANOVA, followed by Bonferroni multiple comparison post hoc test (n = 8 for each group). Symbols (*, †, ‡, §, ¶, #) indicate significance (at 0.05 level). SC = sham control; CKD = chronic kidney disease; CRS = cardiorenal syndrome; Mel = melatonin; Ex4 = exendin-4.
Microscopic findings of inflammatory infiltrating cells in kidney parenchyma by 60 after CRS induction (Figure 6)
(Figure 6) If microscopy demonstrated that the numbers of CD14+ and CD68+ cells, two indicators of inflammation, were highest in CRS and lowest in SC, significantly higher in CKD than in CRS-Mel-Ex4, CRS-Mel and CRS-Ex4, significantly higher in CRS-Mel than in CRS-Ex4 and CRS-Mel-Ex4, and significantly higher in CRS-Ex4 than in CRS-Mel-Ex4.
Figure 6.
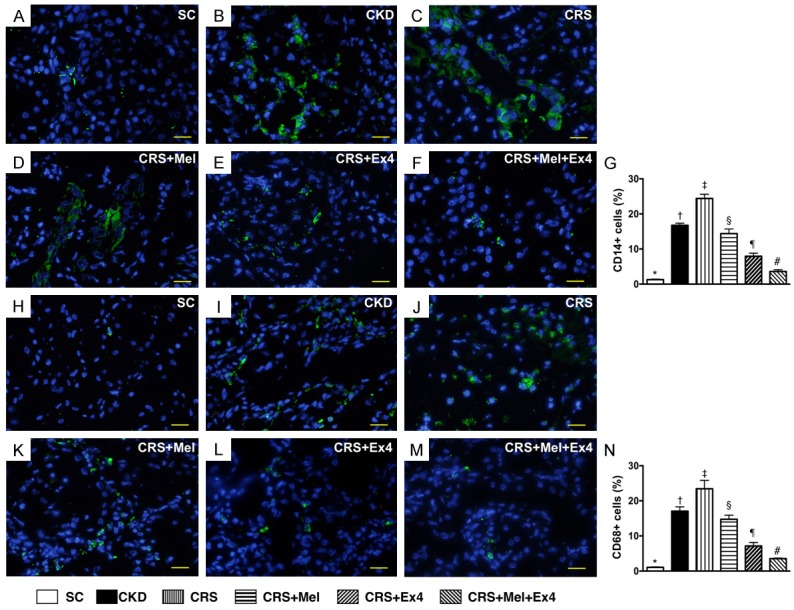
Infiltrations of Inflammatory cells in kidney parenchyma by 60 after CRS induction. A-F: Illustrating the immunofluorescent (IF) microscopic finding (400 ×) of CD14+ cells (green color) in kidney parenchyma. G: Analytic results of number of CD14+ cells, * vs. other groups with different symbols (†, ‡, §, ¶, #), P<0.0001. H-M: IF microscopic finding (400 ×) of positively-stained CD68 cells (green color). N: Analytical results of number of CD68+ cells, * vs. other groups with different symbols (†, ‡, §, ¶, #), P<0.0001. Scale bars in right lower corner represent 20 µm. All statistical analyses were performed by one-way ANOVA, followed by Bonferroni multiple comparison post hoc test (n = 8 for each group). Symbols (*, †, ‡, §, ¶, #) indicate significance (at 0.05 level). SC = sham control; CKD = chronic kidney disease; CRS = cardiorenal syndrome; Mel = melatonin; Ex4 = exendin-4.
Microscopic findings of cellular-damage markers in kidney parenchyma by day 60 after CRS induction (Figure 7)
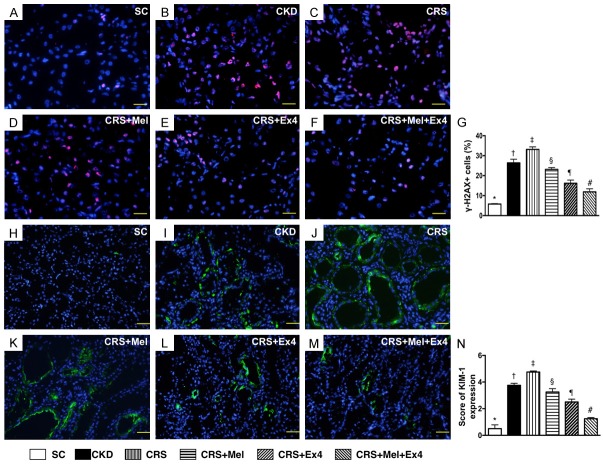
(Figure 7) IF microscopy identified that the cellular expression of γ-H2AX, a biomarker of DNA-damage, was highest in CRS and lowest in SC, significantly higher in CKD than in CRS-Mel-Ex4, CRS-Mel and CRS-Ex4, significantly higher in CRS-Mel than in CRS-Ex4 and CRS-Mel-Ex4, and significantly higher in CRS-Ex4 than in CRS-Mel-Ex4. Additionally, IF microscopy showed that the number of positively-stained KIM-1, a renal tubular damage marker, expressed an identical pattern of γ-H2AX among the six groups.
Figure 7.
Cellular-damaged markers in kidney parenchyma by day 60 after CRS induction. A-F: Demonstrating IF microscopic finding (400 ×) of positively-stained γ-H2AX cells (pink color) in kidney parenchyma. G: Analytical results of number of γ-H2AX+ cells, * vs. other groups with different symbols (†, ‡, §, ¶, #), P<0.0001. Scale bars in right lower corner represent 20 µm. H-M: Demonstrating IF microscopic finding (200 ×) of kidney injury molecule-1 (KIM)-1+ cells (green color). N: Analytical results of KIM-1+ cells, * vs. other groups with different symbols (†, ‡, §, ¶, #), P<0.0001. Scale bars in right lower corner represent 50 µm. All statistical analyses were performed by one-way ANOVA, followed by Bonferroni multiple comparison post hoc test (n = 8 for each group). Symbols (*, †, ‡, §, ¶, #) indicate significance (at 0.05 level). SC = sham control; CKD = chronic kidney disease; CRS = cardiorenal syndrome; Mel = melatonin; Ex4 = exendin-4.
Microscopic findings of podocyte components of kidney by day 60 after CRS induction (Figures 8 and 9)
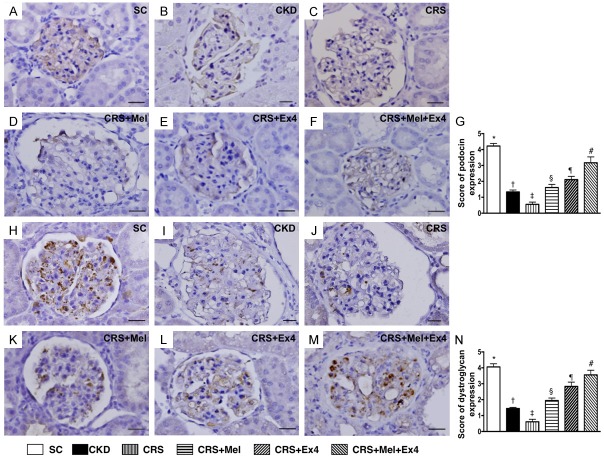
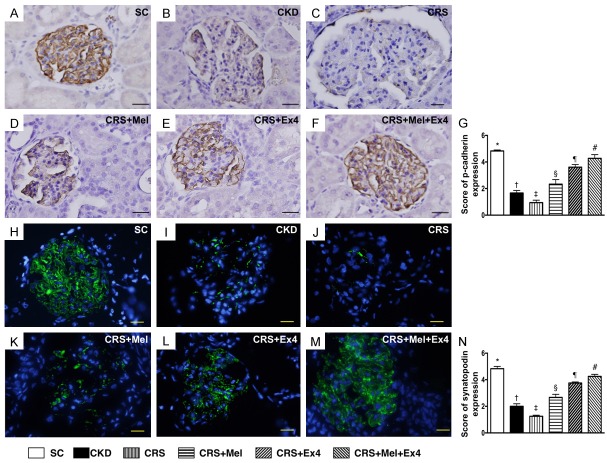
IHC staining exhibited that the cellular expressions of podocin (Figure 8), dystroglycan (Figure 8) and p-cadherin (Figure 9), three indicators of podocyte component integrity, were highest in SC and lowest in CRS, significantly lower in CKD than in CRS-Mel-Ex4, CRS-Mel and CRS-Ex4, significantly lower in CRS-Mel and CRS-Ex4 than in CRS-Mel-Ex4, and significantly lower in CRS-Mel than in CRS-Ex4. Additionally, IF microscopy exhibited that the cellular expression of synatopodin, another indicator of podocyte integrity, showed an identical pattern of podocin among the six groups (Figure 9).
Figure 8.
IHC staining for identification of podocyte components of glomeruli by day 60 after CRS induction. A-F: Illustrating microscopic finding (400 ×) of immunofluorescent (IHC) positively-stained podocin (gray color) in glomeruli. G: Analytical results of number of podocin+ cells, * vs. other groups with different symbols (†, ‡, §, ¶, #), p<0.0001. H-M: Illustrating microscopic finding (400 ×) of IHC positively-stained dystroglycan (gray color) in glomeruli. N: Analytical results of number of dystroglycan positively stained cells, * vs. other groups with different symbols (†, ‡, §, ¶, #), p<0.0001. Scale bars in right lower corner represent 20 µm. All statistical analyses were performed by one-way ANOVA, followed by Bonferroni multiple comparison post hoc test (n = 8 for each group). Symbols (*, †, ‡, §, ¶, #) indicate significance (at 0.05 level). SC = sham control; CKD = chronic kidney disease; CRS = cardiorenal syndrome; Mel = melatonin; Ex4 = exendin-4.
Figure 9.
Microscopic findings for identifying the podocyte components of p-cadherin and synatopodin in glomeruli by day 60 after CRS induction. A-F: Illustrating microscopic finding (400 ×) of immunohistochemical positively-stained p-cadherin (gray color) in glomeruli. G: Analytical results of number of p-cadherin+ cells, * vs. other groups with different symbols (†, ‡, §, ¶, #), P<0.0001. H-M: Illustrating immunofluorescent microscopic finding (400 ×) of positively-stained synatopodin (green color) in glomeruli. N: Analytical results of number of synatopodin, * vs. other groups with different symbols (†, ‡, §, ¶, #), P<0.0001. Scale bars in right lower corner represent 20 µm. All statistical analyses were performed by one-way ANOVA, followed by Bonferroni multiple comparison post hoc test (n = 8 for each group). Symbols (*, †, ‡, §, ¶, #) indicate significance (at 0.05 level). SC = sham control; CKD = chronic kidney disease; CRS = cardiorenal syndrome; Mel = melatonin; Ex4 = exendin-4.
Microscopic findings of cellular expressions of podocyte/renal tubule dysfunction signaling and protein expression of GLP-1R by day 60 after CRS induction (Figures 10 and 11)
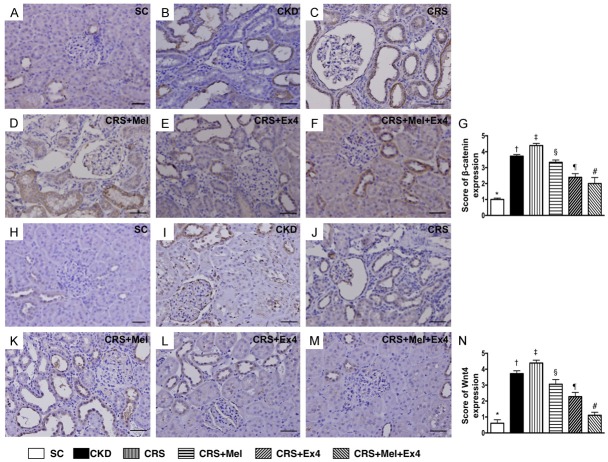
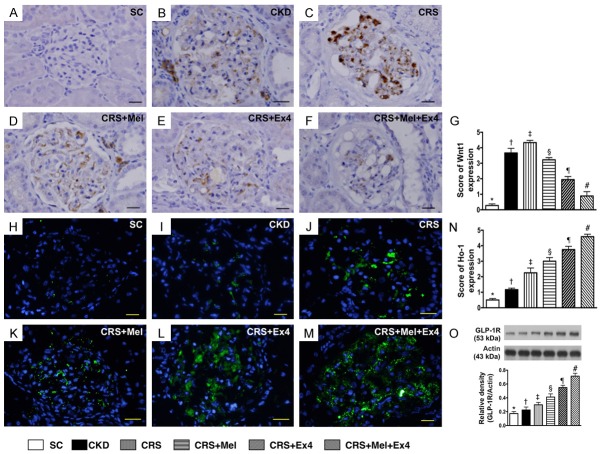
IHC staining demonstrated that the cellular expressions of β-catenin/Wnt4 (Figure 10), two cellular dysfunction signaling markers in renal tubules, were highest in SC and lowest in CRS, significantly lower in CKD than in CRS-Mel, CRS-Ex4 and CRS-Mel-Ex4, significantly lower in CRS-Mel than in CRS-Ex4 and CRS-Mel-Ex4, and significantly lower in CRS-Ex4 than in CRS-Mel-Ex4. Additionally, cellular expression of Wnt1 (Figure 11), a podocyte dysfunction signaling in glomeruli, showed an identical pattern to β-catenin/Wnt4 among the six groups. Furthermore, IF microscopy identified that the cellular expression of HO-1, an indicator of anti-oxidant, was progressively increased from SC to CRS-Mel-Ex4 (Figure 11). Moreover, the protein expression of GLP-1R, an intrinsic response to kidney damage, was characterized to progressively increase from SC to CRS-Mel-Ex4 among the animals (Figure 11).
Figure 10.
Cellular dysfunction signaling in renal tubules by day 60 after CRS induction. A-F: Illustrating microscopic finding (200 ×) of immunohistochemical (IHC) staining of β-catenin+ cells to distribute mainly in renal tubules. G: Analytical results of number of β-catenin+ cells, * vs. other groups with different symbols (†, ‡, §, ¶, #), p<0.0001. H-M: Illustrating microscopic findings (200 ×) IHC staining of Wnt4+ cells mainly in renal tubules. N: Analytical results of number of Wnt4+ cells, * vs. other groups with different symbols (†, ‡, §, ¶, #), P<0.0001. Scale bars in right lower corner represent 50 µm. All statistical analyses were performed by one-way ANOVA, followed by Bonferroni multiple comparison post hoc test (n = 8 for each group). Symbols (*, †, ‡, §, ¶, #) indicate significance (at 0.05 level). SC = sham control; CKD = chronic kidney disease; CRS = cardiorenal syndrome; Mel = melatonin; Ex4 = exendin-4.
Figure 11.
Podocyte dysfunction signaling of Wnt1 in glomeruli and protein expression of GLP-1R by day 60 after CRS induction. A-F: Illustrating microscopic finding (400 ×) of immunohistochemical staining of Wnt1+ cells in glomeruli. G: Analytical results of number of Wnt1+ cells, * vs. other groups with different symbols (†, ‡, §, ¶, #), P<0.0001. Scale bars in right lower corner represent 20 µm. H-M: Illustrating microscopic finding (400x) of immunofluorescent staining of heme-oxygenase (HO)-1+ cells in renal parenchyma. N: Analytical results of number of OH+ cells, * vs. other groups with different symbols (†, ‡, §, ¶, #), p<0.0001. Scale bars in right lower corner represent 20 µm. O: The protein expression of glucagon-like peptide 1 receptor (GLP-1R), * vs. other groups with different symbols (†, ‡, §, ¶, #), P<0.0001. All statistical analyses were performed by one-way ANOVA, followed by Bonferroni multiple comparison post hoc test (n = 8 for each group). Symbols (*, †, ‡, §, ¶, #) indicate significance (at 0.05 level). SC = sham control; CKD = chronic kidney disease; CRS = cardiorenal syndrome; Mel = melatonin; Ex4 = exendin-4.
Discussion
This preclinical study, which investigated the impact of LV dysfunction on the deterioration of renal function in the setting of CKD, and the therapeutic potential of Mel-Ex4 on reversing the deterioration of renal function, yielded several clinically relevant implications. First, renal functional reduction was clearly identified in the setting of DCM (an index of LV dysfunction/heart failure). Multifaceted molecular-cellular perturbation was observed not only in renal tubules but also in glomeruli with deteriorated architecture and function. Third, combined Mel-Ex4 treatment was superior to either therapy alone for attenuating the deterioration of renal function in CRS.
An essential finding was that, when compared with CKD animals, renal function was worse in CRS animals. This finding highlighted that systolic LV dysfunction/heart failure played a critical role in worsening kidney function. Numerous clinical observational studies [1-4] have shown that LV dysfunction, especially in the setting of acute decompensated heart failure, would always deteriorate renal function and urine output, which, in turn, cause fluid overload and acute pulmonary edema [1,2,5-9]. Therefore, findings from the present experimental study support the results of clinical observational studies [1-9].
The most important finding in the present study was that kidney injury score (i.e., histopathological integrity of kidney architecture) as well as proteinuria (i.e., functional finding) were remarkably reduced in CRS animals after receiving melatonin treatment. Importantly, these two parameters were remarkably reduced by Ex4 treatment and reduced even further by that of the combined Mel-Ex4 treatment. Intriguingly, our recent study revealed that combined melatonin and exendin-4 therapy preserved renal ultrastructural integrity after ischemia-reperfusion injury in the rat [29]. Accordingly, the findings of our present study, in addition to strengthening the findings of our recent study [29], highlight that combined Mel-Ex4 may be an alternative and realistic option for CRS patients.
The underlying mechanisms of deterioration of renal function in the setting of CRS have been extensively investigated [7,9,19] with the consensus of a multifactorial signaling pathway rather than only one. In the present study, inflammation and oxidative stress were substantially increased in CKD and more substantially increased in CRS animals. Consistently, our recent studies have demonstrated that inflammatory and oxidative-stress biomarkers were increased not only in the setting of acute ischemia-reperfusion kidney injury but also in the setting of CKD [9,18,19,25,26,28,29,31]. In this way, our findings, in addition to corroborating our recent studies [9,18,19,25,26,28,29,31], could, at least in part, explain why apoptotic, fibrotic and DNA-damage biomarkers, kidney injury score, defective kidney ultra-structure (i.e., components of glomeruli and renal architecture) and proteinuria were markedly increased in CKD animals and more markedly increased in CRS. Our findings are comparable to those of previous studies [9,18,19,30,31] that complicated signaling pathways participated in initiation and propagation of further kidney damage in CRS. Of particular importance, these molecular-cellular perturbations were significantly reversed by Mel treatment, further significantly reversed by Ex4 treatment and more further significantly reversed by combined Mel-Ex4 treatment in CRS animals. Therefore, our experimental findings provide important clinically relevant data for explaining the mechanistic basis of deteriorating heart and renal function in CRS.
Study limitations
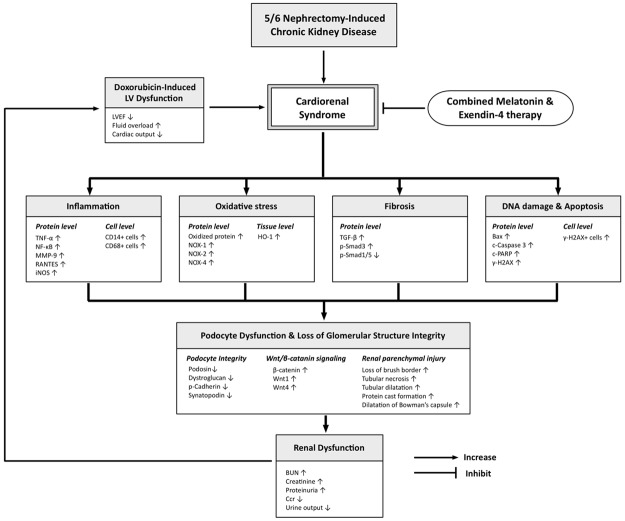
This study has limitations. First, the regimen of Mel and Ex4 were based on our previous studies and the optimal dose of Mel and Ex4 was not tested. Therefore, whether the effect of Ex4 was superior to Mel, or vice versa, for protecting the deterioration of kidney function in CRS remains uncertain. Second, although extensive works were done in the present study, the exact underlying mechanisms remain unconfirmed. The proposed mechanisms underlying the observed protection of Mel-Ex4 treatment against acute CRS based on our findings have been summarized in Figure 12.
Figure 12.
Proposed mechanisms underlying the positive therapeutic effects of combined melatonin and exendin-4 therapy on reversing the deterioration of kidney function from cardiorenal syndrome (CRS). LEVF = left ventricular ejection fraction; TNF-α = tumor necrosis factor alpha; NF-κB = nuclear factor-κB; MMP-9 = matrix metalloproteinase 9; iNOS = inducible nitric oxide synthase; HO-1 = heme oxygenase 1; TGF-β = transforming growth factor beta; c-PARP = cleaved Poly (ADP-ribose) polymerase.
In conclusion, CRS worsened the renal function that was reversed by Mel-Ex4 therapy.
Acknowledgements
This study was supported by a program grant from Chang Gung Memorial Hospital, Chang Gung University (Grant number: CMRPG8D0611).
Disclosure of conflict of interest
None.
References
- 1.Shlipak MG, Massie BM. The clinical challenge of cardiorenal syndrome. Circulation. 2004;110:1514–1517. doi: 10.1161/01.CIR.0000143547.55093.17. [DOI] [PubMed] [Google Scholar]
- 2.Ronco C, McCullough P, Anker SD, Anand I, Aspromonte N, Bagshaw SM, Bellomo R, Berl T, Bobek I, Cruz DN, Daliento L, Davenport A, Haapio M, Hillege H, House AA, Katz N, Maisel A, Mankad S, Zanco P, Mebazaa A, Palazzuoli A, Ronco F, Shaw A, Sheinfeld G, Soni S, Vescovo G, Zamperetti N, Ponikowski P. Cardio-renal syndromes: report from the consensus conference of the acute dialysis quality initiative. Eur Heart J. 2010;31:703–711. doi: 10.1093/eurheartj/ehp507. [DOI] [PMC free article] [PubMed] [Google Scholar]
- 3.Tsai TH, Yeh KH, Sun CK, Yang CH, Chen SM, Hang CL, Chen CJ, Chung SY, Chen YL, Wu CJ, Chang HW, Yip HK. Estimated glomerular filtration rate as a useful predictor of mortality in patients with acute myocardial infarction undergoing primary percutaneous coronary intervention. Am J Med Sci. 2013;345:104–111. doi: 10.1097/MAJ.0b013e318258f482. [DOI] [PubMed] [Google Scholar]
- 4.Ando G, Morabito G, de Gregorio C, Trio O, Saporito F, Oreto G. Age, glomerular filtration rate, ejection fraction, and the AGEF score predict contrast-induced nephropathy in patients with acute myocardial infarction undergoing primary percutaneous coronary intervention. Catheter Cardiovasc Interv. 2013;82:878–885. doi: 10.1002/ccd.25023. [DOI] [PubMed] [Google Scholar]
- 5.Sarraf M, Masoumi A, Schrier RW. Cardiorenal syndrome in acute decompensated heart failure. Clin J Am Soc Nephrol. 2009;4:2013–2026. doi: 10.2215/CJN.03150509. [DOI] [PubMed] [Google Scholar]
- 6.Prins KW, Thenappan T, Markowitz JS, Pritzker MR. Cardiorenal Syndrome Type 1: Renal Dysfunction in Acute Decompensated Heart Failure. J Clin Outcomes Manag. 2015;22:443–454. [PMC free article] [PubMed] [Google Scholar]
- 7.Matsushita K. Pathogenetic Pathways of Cardiorenal Syndrome and Their Possible Therapeutic Implications. Curr Pharm Des. 2016;22:4629–4637. doi: 10.2174/1381612822666160510125057. [DOI] [PubMed] [Google Scholar]
- 8.Obi Y, Kim T, Kovesdy CP, Amin AN, Kalantar-Zadeh K. Current and Potential Therapeutic Strategies for Hemodynamic Cardiorenal Syndrome. Cardiorenal Med. 2016;6:83–98. doi: 10.1159/000441283. [DOI] [PMC free article] [PubMed] [Google Scholar]
- 9.Giam B, Kaye DM, Rajapakse NW. Role of Renal Oxidative Stress in the Pathogenesis of the Cardiorenal Syndrome. Heart Lung Circ. 2016;25:874–880. doi: 10.1016/j.hlc.2016.02.022. [DOI] [PubMed] [Google Scholar]
- 10.Cruz DN, Gheorghiade M, Palazzuoli A, Ronco C, Bagshaw SM. Epidemiology and outcome of the cardio-renal syndrome. Heart Fail Rev. 2011;16:531–542. doi: 10.1007/s10741-010-9223-1. [DOI] [PubMed] [Google Scholar]
- 11.Ronco C, Haapio M, House AA, Anavekar N, Bellomo R. Cardiorenal syndrome. J Am Coll Cardiol. 2008;52:1527–1539. doi: 10.1016/j.jacc.2008.07.051. [DOI] [PubMed] [Google Scholar]
- 12.Forman DE, Butler J, Wang Y, Abraham WT, O'Connor CM, Gottlieb SS, Loh E, Massie BM, Rich MW, Stevenson LW, Young JB, Krumholz HM. Incidence, predictors at admission, and impact of worsening renal function among patients hospitalized with heart failure. J Am Coll Cardiol. 2004;43:61–67. doi: 10.1016/j.jacc.2003.07.031. [DOI] [PubMed] [Google Scholar]
- 13.Cowie MR, Komajda M, Murray-Thomas T, Underwood J, Ticho B, Investigators P. Prevalence and impact of worsening renal function in patients hospitalized with decompensated heart failure: results of the prospective outcomes study in heart failure (POSH) Eur Heart J. 2006;27:1216–1222. doi: 10.1093/eurheartj/ehi859. [DOI] [PubMed] [Google Scholar]
- 14.Metra M, Nodari S, Parrinello G, Bordonali T, Bugatti S, Danesi R, Fontanella B, Lombardi C, Milani P, Verzura G, Cotter G, Dittrich H, Massie BM, Dei Cas L. Worsening renal function in patients hospitalised for acute heart failure: clinical implications and prognostic significance. Eur J Heart Fail. 2008;10:188–195. doi: 10.1016/j.ejheart.2008.01.011. [DOI] [PubMed] [Google Scholar]
- 15.Logeart D, Tabet JY, Hittinger L, Thabut G, Jourdain P, Maison P, Tartiere JM, Solal AC. Transient worsening of renal function during hospitalization for acute heart failure alters outcome. Int J Cardiol. 2008;127:228–232. doi: 10.1016/j.ijcard.2007.06.007. [DOI] [PubMed] [Google Scholar]
- 16.Zhang W, Wen D, Zou YF, Shen PY, Xu YW, Shi H, Xu J, Chen XN, Chen N. One-year survival and renal function recovery of acute kidney injury patients with chronic heart failure. Cardiorenal Med. 2015;5:40–47. doi: 10.1159/000369834. [DOI] [PMC free article] [PubMed] [Google Scholar]
- 17.Ronco C. Cardiorenal syndromes: definition and classification. Contrib Nephrol. 2010;164:33–38. doi: 10.1159/000313718. [DOI] [PubMed] [Google Scholar]
- 18.Pateinakis P, Papagianni A. Cardiorenal syndrome type 4-cardiovascular disease in patients with chronic kidney disease: epidemiology, pathogenesis, and management. Int J Nephrol. 2011;2011:938651. doi: 10.4061/2011/938651. [DOI] [PMC free article] [PubMed] [Google Scholar]
- 19.Rubattu S, Mennuni S, Testa M, Mennuni M, Pierelli G, Pagliaro B, Gabriele E, Coluccia R, Autore C, Volpe M. Pathogenesis of chronic cardiorenal syndrome: is there a role for oxidative stress? Int J Mol Sci. 2013;14:23011–23032. doi: 10.3390/ijms141123011. [DOI] [PMC free article] [PubMed] [Google Scholar]
- 20.Reiter RJ, Acuna-Castroviejo D, Tan DX, Burkhardt S. Free radical-mediated molecular damage. Mechanisms for the protective actions of melatonin in the central nervous system. Ann N Y Acad Sci. 2001;939:200–215. [PubMed] [Google Scholar]
- 21.Galano A, Tan DX, Reiter RJ. On the free radical scavenging activities of melatonin’s metabolites, AFMK and AMK. J Pineal Res. 2013;54:245–257. doi: 10.1111/jpi.12010. [DOI] [PubMed] [Google Scholar]
- 22.Galano A, Tan DX, Reiter RJ. Melatonin as a natural ally against oxidative stress: a physicochemical examination. J Pineal Res. 2011;51:1–16. doi: 10.1111/j.1600-079X.2011.00916.x. [DOI] [PubMed] [Google Scholar]
- 23.Kang JW, Koh EJ, Lee SM. Melatonin protects liver against ischemia and reperfusion injury through inhibition of toll-like receptor signaling pathway. J Pineal Res. 2011;50:403–411. doi: 10.1111/j.1600-079X.2011.00858.x. [DOI] [PubMed] [Google Scholar]
- 24.Reiter RJ, Tan DX, Fuentes-Broto L. Melatonin: a multitasking molecule. Prog Brain Res. 2010;181:127–151. doi: 10.1016/S0079-6123(08)81008-4. [DOI] [PubMed] [Google Scholar]
- 25.Chen YT, Tsai TH, Yang CC, Sun CK, Chang LT, Chen HH, Chang CL, Sung PH, Zhen YY, Leu S, Chang HW, Chen YL, Yip HK. Exendin-4 and sitagliptin protect kidney from ischemia-reperfusion injury through suppressing oxidative stress and inflammatory reaction. J Transl Med. 2013;11:270. doi: 10.1186/1479-5876-11-270. [DOI] [PMC free article] [PubMed] [Google Scholar]
- 26.Chen HH, Lin KC, Wallace CG, Chen YT, Yang CC, Leu S, Chen YC, Sun CK, Tsai TH, Chen YL, Chung SY, Chang CL, Yip HK. Additional benefit of combined therapy with melatonin and apoptotic adipose-derived mesenchymal stem cell against sepsis-induced kidney injury. J Pineal Res. 2014;57:16–32. doi: 10.1111/jpi.12140. [DOI] [PubMed] [Google Scholar]
- 27.Sheu JJ, Chang MW, Wallace CG, Chiang HJ, Sung PH, Tsai TH, Chung SY, Chen YL, Chua S, Chang HW, Sun CK, Lee FY, Yip HK. Exendin-4 protected against critical limb ischemia in obese mice. Am J Transl Res. 2015;7:445–459. [PMC free article] [PubMed] [Google Scholar]
- 28.Kim S, Moon M, Park S. Exendin-4 protects dopaminergic neurons by inhibition of microglial activation and matrix metalloproteinase-3 expression in an animal model of Parkinson’s disease. J Endocrinol. 2009;202:431–439. doi: 10.1677/JOE-09-0132. [DOI] [PubMed] [Google Scholar]
- 29.Yip HK, Yang CC, Chen KH, Huang TH, Chen YL, Zhen YY, Sung PH, Chiang HJ, Sheu JJ, Chang CL, Chen CH, Chang HW, Chen YT. Combined melatonin and exendin-4 therapy preserves renal ultrastructural integrity after ischemia-reperfusion injury in the male rat. J Pineal Res. 2015;59:434–447. doi: 10.1111/jpi.12273. [DOI] [PubMed] [Google Scholar]
- 30.Yang CC, Yip HK, Chen KH, Sun CK, Chen YT, Chai HT, Sung PH, Chiang HJ, Ko SF, Chen SY, Chen CH, Lin KC, Lin PY, Sheu JJ. Impact of impaired cardiac function on the progression of chronic kidney disease---role of pharmacomodulation of valsartan. Am J Transl Res. 2016;8 (In Press) [PMC free article] [PubMed] [Google Scholar]
- 31.Huang TH, Chen YT, Sung PH, Chiang HJ, Chen YL, Chai HT, Chung SY, Tsai TH, Yang CC, Chen CH, Chen YL, Chang HW, Sun CK, Yip HK. Peripheral blood-derived endothelial progenitor cell therapy prevented deterioration of chronic kidney disease in rats. Am J Transl Res. 2015;7:804–824. [PMC free article] [PubMed] [Google Scholar]


