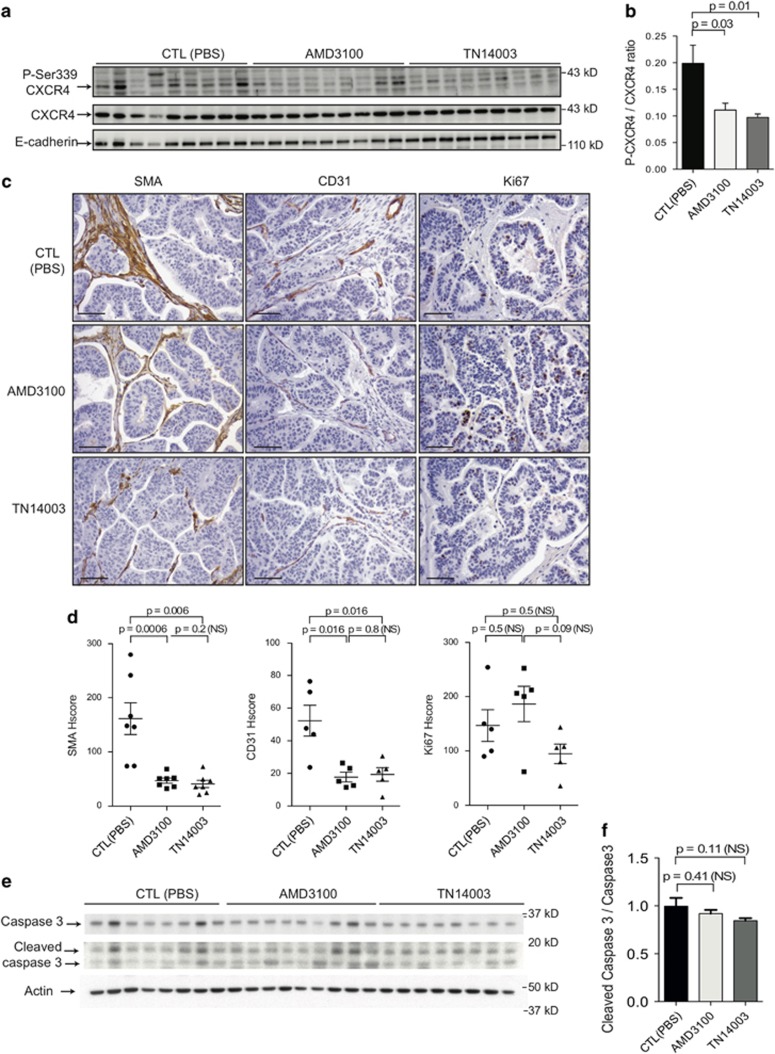
Figure 3.
CXCR4 inhibitors reduce tumor angiogenesis and myofibroblast content in HER2 PDX. (a) Representative western blots showing phosphorylated Ser339-CXCR4, CXCR4 and E-cadherin protein levels from HER2-BC1 PDX treated either with PBS (CTL), AMD3100 or TN14003, as indicated. (b) Bar graph represents the ratio of the phosphorylated form of CXCR4 on Ser339 residue (Ser339-CXCR4) to its total protein levels, as assessed by densitometry analysis of western blots (as shown on the Right). N=10 per group. P-values are from Student's t-test. (c) Representative views of SMA (Left), CD31 (Middle) and Ki67 (Right) IHC in tumors from HER2-BC1 PDX treated either with PBS (CTL), AMD3100 or TN14003, as indicated. Scale bar: 125 μm. (d) Scatter plots showing histological scores (HScores, see Materials and methods) of stromal SMA (Left), CD31 (Middle) and Ki67 staining (Right) from tumors of HER2-BC1 PDX treated either with PBS (CTL), AMD3100 or TN14003, as indicated. Data are shown as means±s.e.m. P-values are based on Mann–Whitney test. (e) Representative western blots showing caspase 3 and cleaved caspase 3 protein levels from HER2-BC1 PDX treated either with PBS (CTL), AMD3100 or TN14003, as indicated. Actin is used as a control for protein loading. (f) Bar graph represents the ratio of the cleaved caspase 3 to its total protein levels, as assessed by densitometry analysis of western blots (as shown on the Right). N=7 at least per group. P-values are from Student's t-test.

