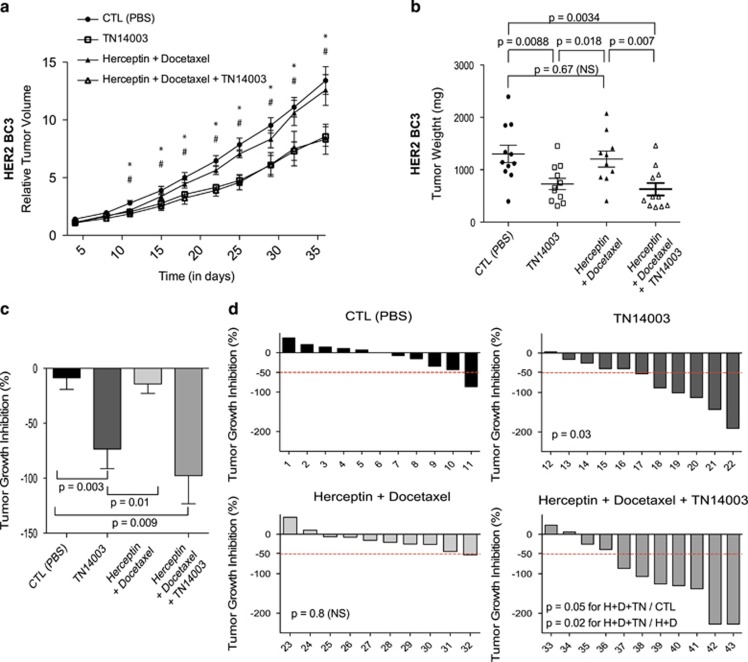
Figure 4.
TN14003 reduce tumor growth in herceptin-resistant HER2 PDX. (a) Tumor growth curve showing variation of tumor volume as a function of time in HER2-BC3 PDX Mice were treated with PBS (CTL, Control) (•), TN14003 (□), Herceptin+Docetaxel (▴) or with Herceptin+Docetaxel+TN14003 (▵). Data are means±s.e.m (N⩾10 per group). P-values are from Student t-test, where # and * represent significant P-values (P⩽0.05) between PBS (CTL)− and TN14003-treated mice or between PBS (CTL)− and Herceptin+Docetaxel+TN14003-treated mice, respectively. (b) Scatter plots showing final weight of tumors from HER2-BC3 PDX following treatments, as indicated. Data are means±s.e.m (N⩾10 per group). P-values are from Student's t-test. (c) Bar graph showing tumor growth inhibition (TGI) related to control mean (see Materials and methods) in HER2-BC3 PDX following treatments, as indicated, with CTL mice having been injected with PBS. P-values are from Mann–Whitney test. (d) Waterfall plots showing individual TGI for each mouse following treatment with PBS (CTL, upper left panel), TN14003 (upper right panel), Herceptin+Docetaxel (lower left panel) or Herceptin+Docetaxel+TN14003 (lower right panel). For each treatment and each mouse, TGI has been related to the mean of the control group. Numbers below each bar graph represent the tag number of each mouse. P-values are from Fisher's test considering mice harboring tumor progression (TGI>0), minor regression (−50<TGI<0) or major regression (TGI<−50) after treatment compared with controls.

