Muscle contraction is associated with a significant increase in motor-evoked potential (MEP) duration and amplitude. Whereas the increase in MEP duration was linear, the amplitude increase exhibited a ceiling effect. Importantly, the MEP duration increase strongly correlated with short interval-intracortical inhibition, a biomarker of motor cortical function. This suggests that whereas similar physiological processes contribute to changes in facilitated MEP duration and amplitude, cortical mechanisms appear to contribute to MEP duration changes.
Keywords: cortical processes, MEP duration, propriospinal
Abstract
Voluntary contraction leads to facilitation of motor-evoked potentials (MEPs) producing greater amplitude, shorter onset latency, and prolonged duration of the electromyography potential. Whereas hyperexcitability of spinal motoneurons and changes in descending corticospinal volleys have been proposed as putative mechanisms for changes in MEP amplitude and onset latency, a contribution of propriospinal interneurons, exerting modulatory effects on α-motoneurons, has been proposed as a potential explanation for prolongation of MEP duration. The aim of the present study is to gain further insight into the physiological processes underlying changes in MEP duration. Transcranial magnetic stimulation (TMS) studies were undertaken on 30 healthy controls, using a 90-mm circular coil, with MEPs recorded at rest and during facilitation, produced by contraction of abductor pollicis brevis. In the same experiment, short interval-intracortical inhibition (SICI) was recorded at rest. Facilitation resulted in a significant prolongation of MEP duration, which increased with stimulus intensity and was accompanied by an increase in MEP amplitude. The main effect (TMS intensity × activation state) was correlated with MEP duration (F = 10.9, P < 0.001), whereas TMS intensity (F = 30.5, P < 0.001) and activation state (F = 125.8, P < 0.001) in isolation were correlated with MEP amplitude. There was a significant inverse relationship between SICI and MEP duration at rest (R2 = 0.141, P = 0.041) and during facilitation (R2 = 0.340, P = 0.001). The present findings suggest that similar physiological processes mediate changes in the facilitated MEP duration and amplitude and that both cortical and nonpropriospinal spinal mechanisms contribute to changes in MEP duration.
NEW & NOTEWORTHY Muscle contraction is associated with a significant increase in motor-evoked potential (MEP) duration and amplitude. Whereas the increase in MEP duration was linear, the amplitude increase exhibited a ceiling effect. Importantly, the MEP duration increase strongly correlated with short interval-intracortical inhibition, a biomarker of motor cortical function. This suggests that whereas similar physiological processes contribute to changes in facilitated MEP duration and amplitude, cortical mechanisms appear to contribute to MEP duration changes.
the motor-evoked potential (MEP), generated in response to transcranial magnetic simulation (TMS) applied to the primary motor cortex, has proven to be an important measure of upper-motoneuron function in healthy controls and in human disease (Chen et al. 2008; Rossini et al. 1999, 2015; Vucic et al. 2013). In particular, the MEP onset latency and amplitude can provide important insights into the function of the motor cortex (Chen et al. 2008; Vucic et al. 2013). The descending corticospinal volleys summate to activate the spinal motor neuron, thereby generating the MEP (Burke et al. 1993; Day et al. 1989; Di Lazzaro et al. 1998a, c, 2003, 2008, 2012; Hanajima et al. 2002; Rossini et al. 2015; Rusu et al. 2014).
Recently, it was proposed that MEP-duration increases, in response to voluntary muscle contraction, were a measure of propriospinal interneuronal function (Brum et al. 2016). There is cogent evidence in the macaque that a propriospinal system operating at the C3–C4 level is involved in coordinating the activity of forelimb muscles when reaching for a target, with axial muscles stabilizing the trunk during reaching (Alstermark et al. 2007; Isa et al. 2006, 2013; Kinoshita et al. 2012). In addition, indirect evidence for the existence of a propriospinal system in humans has been proposed (Giboin et al. 2012; Martin et al. 2007; Pierrot-Deseilligny 1996; Pierrot-Deseilligny and Burke 2012) with activation of the C3–C4 propriospinal neurons by descending corticospinal inputs, providing a disynaptic excitatory contribution to the MEP (Pierrot-Deseilligny 1996; Pierrot-Deseilligny and Burke 2012). The propriospinal system contributes to the activation of various upper-limb motoneuron pools during specific voluntary tasks (Giboin et al. 2012), and greater transmission of the cortical command for movement through the propriospinal system may play a role in the recovery from stroke (Mazevet et al. 2003; Stinear and Byblow 2004).
The notion, however, that increases in facilitated MEP duration reflect propriospinal input may be problematic, given that activation of the target motoneuron pool will occur 1 ms after the monosynaptic corticospinal input and therefore, cannot be identified in conventional MEP studies because the corticospinal volley set up by TMS is complex and dispersed over several milliseconds. As a result, the assessment of propriospinal function in humans has relied on demonstrating cutaneous suppression of descending excitatory commands traversing propriospinal relays (Martin et al. 2007; Mazevet et al. 2003; Pierrot-Deseilligny 1996) or assessment of effects of propriospinally mediated peripheral nerve excitation on poststimulus time histograms and MEP amplitudes (Malmgren and Pierrot-Deseilligny 1987). Separately, Brum and colleagues (2016) recorded MEP responses from intrinsic hand muscles that do not appear to receive propriospinal inputs (Pierrot-Deseilligny 1996; Pierrot-Deseilligny and Burke 2012).
In the present study, we explored an alternative explanation, namely, that the facilitated MEP duration was, in part, mediated by cortical mechanisms, in addition to changes at a spinal level. Voluntary contraction is associated with an increase in frequency and amplitude of indirect waves, but spinal motoneuronal hyperexcitability is thought to be the predominant driver of the increase in MEP amplitude with facilitation (Di Lazzaro et al. 1998b). Consequently, the duration of MEP was assessed in resting and facilitated states across a range of stimulus intensities, from 110 to 150% of resting motor threshold (RMT), and correlated with changes in MEP latency and amplitude and with short interval-intracortical inhibition (SICI) to determine whether similar physiological processes underlie the changes in MEP parameters and whether cortical mechanisms are involved.
MATERIALS AND METHODS
Studies were undertaken on 30 healthy, right-handed control subjects (14 men, 16 women, mean age 44.5 yr, age range 21–72 yr), who were prospectively recruited and were not preselected based on differences in TMS parameters. None of the subjects suffered from medical disorders or were receiving any medication. Informed consent was obtained from all subjects, with the study approved by the Sydney West Area Health Service and Human Research Ethics Committees.
Peripheral studies.
Before undertaking TMS studies, the median nerve was stimulated at the wrist using 10 mm gel electrodes (3M, St. Paul, MN), using a bipolar constant-current source (maximal output ± 50 mA; DS5; Digitimer, Welwyn Garden City, UK). The compound muscle action potential (CMAP) was recorded from the abductor pollicis brevis (APB) muscle using a belly-tendon montage, with the active (G1) electrode positioned over the motor point and reference (G2) electrode placed over the base of the proximal thumb. The resultant peak–peak amplitude of the CMAP was measured (in millivolts), as were the total CMAP duration (from first negative deflection to return to baseline), distal motor latency (in milliseconds), minimal F-wave latency (in milliseconds), and frequency.
Cortical studies.
TMS, using single- and paired-pulse techniques, was undertaken by applying a 90-mm circular coil connected to a BiStim device (Magstim, Carmarthenshire, UK), according to previously reported methods (Vucic et al. 2006). The MEP was recorded over APB. RMT was defined as the stimulus intensity required to generate and maintain an MEP of 0.2 mV (±20%) (Pasquereau et al. 2016). A value of 0.2 mV was selected, rather than the conventional 0.05-mV value used in the constant stimulus TMS technique (Fisher et al. 2002; Vucic et al. 2006), because a 0.2-mV response generally lies in the middle of the linear logarithmic stimulus-response curve (Fisher et al. 2002) and is less likely to be contaminated by an electromyography (EMG) artifact.
Subsequently, single-pulse TMS was used to generate MEPs at rest and during voluntary contraction of APB. Auditory and visual feedback of the EMG of APB was provided to ensure that when recording the facilitated MEP, the contraction level was ~10% of the maximal voluntary contraction. MEPs were recorded at the stimulus intensities of 110, 120, 130, and 150% of RMT during both rest and activity. Three MEPs were recorded at each stimulus intensity. The total MEP duration (in milliseconds) was measured from the latency of onset to the return to baseline for both resting and facilitated MEPs (Fig. 1). The MEP “tail” (in milliseconds) was defined as the difference between the end of the facilitated MEP and the end of the rest MEP, in accordance with the definition of Brum and colleagues (2016) (Fig. 1). The total MEP duration was recorded as an absolute value and normalized as a percentage of the peripheral CMAP duration. MEP amplitude was recorded in absolute terms (in millivolts) and normalized to the maximal CMAP. The onset latency of the MEP was recorded in milliseconds for each trace.
Fig. 1.
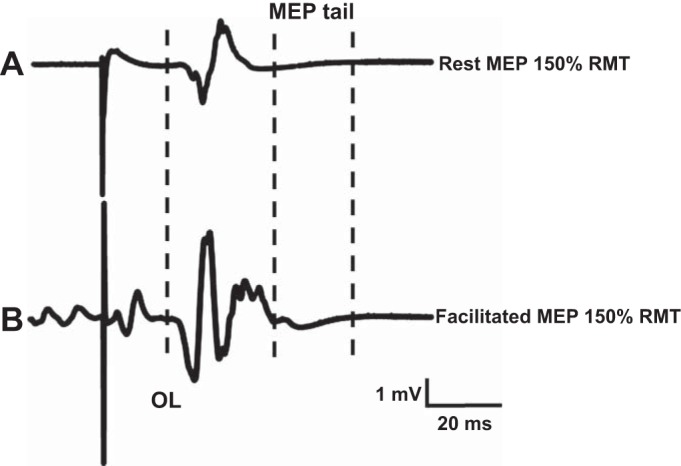
The motor-evoked potential (MEP) duration at rest (A) exhibited longer onset latency (OL) and was of shorter duration when compared with the facilitated MEP response (B). Left dotted, vertical line represents the onset latency; middle dotted, vertical line depicts the end of the rest MEP response; and right dotted, vertical line depicts the end of the facilitated MEP response. The MEP tail (in milliseconds) was defined as the difference between the end of the facilitated MEP (right vertical, dotted line) and the end of rest MEP (middle vertical, dotted line) responses. MEP responses were generated by stimulus intensity set to 150% resting motor threshold (RMT).
Paired-pulse, threshold-tracking TMS was used to assess SICI and intracortical facilitation (ICF), according to previously reported techniques (Fisher et al. 2002; Vucic et al. 2006). All paired-pulse recordings were undertaken in the resting state to minimize the effects of fatigue, which have been shown to reduce the degree of intracortical inhibition and facilitation (Hunter et al. 2016). In these studies, the intensity of the test stimulus was adjusted upward by the computer to keep the test MEP constant, despite inhibition (with SICI), and downward with facilitation (with ICF). Briefly, the subthreshold conditioning stimulus was set to 70% RMT, and SICI was recorded over the following interstimulus intervals (ISIs): 1, 1.5, 2, 2.5, 3, 3.5, 4, 5, and 7 ms. ICF was measured at ISIs of 10, 15, 20, 25, and 30 ms. Intracortical inhibition and facilitation were calculated offline using a previously reported formula (Fisher et al. 2002; Vucic et al. 2006).
Recordings of EMG potentials were amplified and filtered (3 Hz–3 kHz) using a Nicolet Biomedical EA-2 amplifier (Cardinal Health Viking Select version 11.1.0; Viasys Healthcare NeuroCare Group, Madison, WI). Sampling rate was set to 10 kHz using a 16-bit data acquisition card (PCI-MIO-16E-4; National Instruments, Austin, TX). Data acquisition and stimulation delivery were controlled by QTRACS software (Hugh Bostock, University College London Institute of Neurology, London, UK).
Statistical analysis.
The data were tested for normality using the Shapiro-Wilk test. Factorial analysis was undertaken using the variables of “muscle activation state” (2 levels: rest or facilitated) and “TMS intensity” (4 levels: from 110 to 150% of RMT). For parametric data analyses, one-factor or two-factor repeated-measures (RM) ANOVA with post hoc testing was used. For nonparametric analyses, a one-factor RM ANOVA by ranks was undertaken using Friedman’s test, with a Wilcoxon signed-rank test for post hoc testing. The regression relationships between MEP duration and other experimental variables (MEP amplitude and SICI) were examined using linear and curvilinear models. All results are expressed as means ± SE or median (interquartile range) for nonparametric data. Analyses were considered significant with P < 0.05.
RESULTS
At rest, the MEP onset latency was 20.6 ± 0.33 ms, with TMS intensity of 150% RMT, and was significantly longer than the facilitated MEP onset latency (16.4 ± 0.48 ms, P < 0.001). A two-factor RM ANOVA disclosed a significant effect of TMS intensity (F = 179.1, P < 0.001) and muscle activation state (F = 10.7, P < 0.001) on the MEP onset latency. Interestingly, the interaction of TMS intensity × muscle activation state (F = 2.4, P = 0.083) did not significantly influence the MEP onset latency. Post hoc testing confirmed that the MEP onset latency was consistently shorter in the facilitated state at each level of stimulus intensity.
MEP duration.
The TMS intensity and muscle activation state were both significantly correlated with MEP duration, expressed as a percentage of the CMAP duration. From a novelty perspective, a two-factor RM ANOVA disclosed a significant main effect of TMS intensity × muscle activation state (F = 8.1, P < 0.001) on MEP duration. Significant subeffects were also evident, whereby TMS intensity (F = 54.5, P < 0.001) and muscle activation state (F = 168.5, P < 0.001) influenced the MEP duration in isolation. Selective post hoc testing demonstrated significant differences across stimulus intensities in both resting and facilitated states (Fig. 2). The analysis was repeated with the MEP duration recorded in absolute values (in milliseconds). The differences were significant using a two-factor ANOVA, both for the main effect (TMS intensity × muscle activation state, F = 10.9, P < 0.001) and individual subeffects of TMS intensity (F = 71.1, P < 0.001) and muscle activation state (F = 169.2, P < 0.001).
Fig. 2.
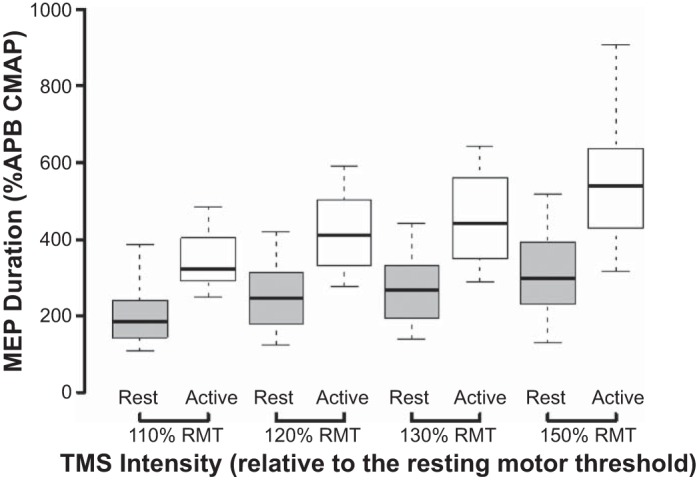
The motor-evoked potential (MEP) duration, expressed as a percentage of the compound muscle action potential (CMAP), was significantly higher with facilitation (white bars) when compared with rest (gray bars) at each level of stimulus intensity, expressed as percentage of resting motor threshold (RMT). Horizontal, center lines show the medians; box limits indicate the 25th and 75th percentiles; and whiskers extend to minimum and maximum values. All paired comparisons between rest and facilitation were significantly different at a level of at least P < 0.05. APB, abductor pollicis brevis; TMS, transcranial magnetic stimulation.
In conjunction with changes of MEP duration, facilitation led to the development of an MEP tail, defined as the absolute difference between the offset latencies of facilitated and rest MEPs (Brum et al. 2016). The MEP tail was previously demonstrated with TMS intensities of 120% RMT and postulated to be a biomarker of propriospinal interneuronal function (Brum et al. 2016). The present study established that the MEP tail duration significantly correlated with TMS intensity (χ2 = 18.3, P < 0.001; Fig. 3). Importantly, the MEP tail duration was longest with the stimulus intensity set to 150% RMT (Friedman’s test, P < 0.05; Fig. 3).
Fig. 3.
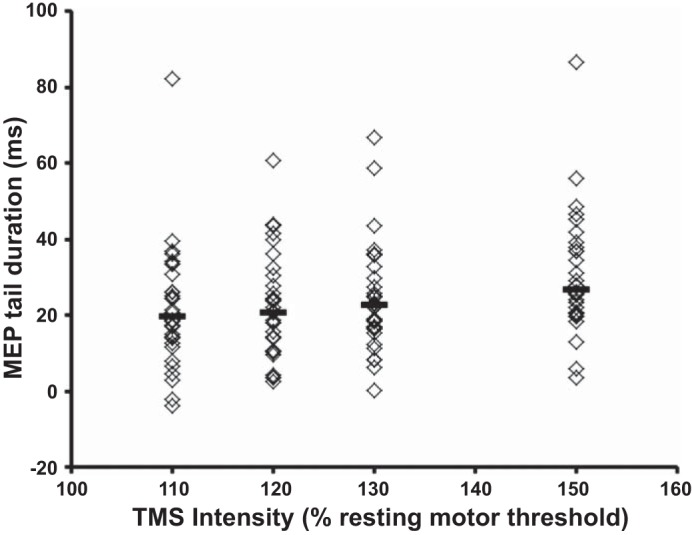
The duration of the motor-evoked potential (MEP) tail increased with transcranial magnetic stimulation (TMS) intensity. Horizontal, center lines show the medians for each intensity, whereas individual subject results are depicted as open diamonds.
MEP amplitude.
As expected, the MEP amplitude, expressed as a percentage of the CMAP, was significantly greater with increasing TMS intensities and muscle contraction (Fig. 4). Importantly, a two-way RM ANOVA disclosed a significant effect of TMS intensity (F = 30.5, P < 0.001) and muscle activation state (F = 125.8, P < 0.001) on MEP amplitude. Pair-wise comparisons (paired t-tests) between rest and facilitation disclosed significant increases in MEP amplitude at each level of stimulus intensity (Fig. 4). In contrast to the effects on the MEP duration, the main effect of TMS intensity × muscle activation state did not exert a significant effect on MEP amplitude (F = 2.329, P = 0.103).
Fig. 4.
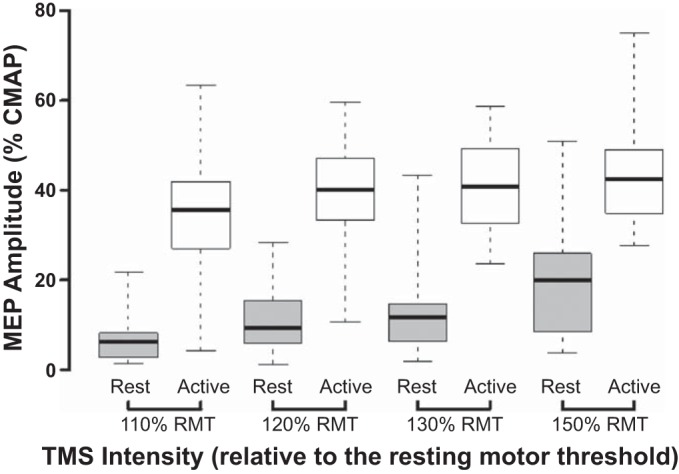
The motor-evoked potential (MEP) amplitude, expressed as a percentage of the compound muscle action potential (CMAP) amplitude, was significantly higher with facilitation (white bars) than at rest (gray bars) at each stimulus intensity [expressed as percentage of resting motor threshold (RMT)]. Horizontal, center lines show the medians; box limits indicate the 25th and 75th percentiles; and whiskers extend to minimal and maximal values. All paired comparisons between rest and facilitation were significantly different. TMS, transcranial magnetic stimulation.
The scatter plot in Fig. 5 shows the relationship between MEP amplitude and duration (Fig. 5). The averages of the normalized MEP amplitude and MEP duration, for each level of TMS intensity at rest and facilitation, were pooled for individual subjects into a regression model. Whereas a linear regression model was significant (R2 = 0.454, F1,237 = 199.173, P < 0.001), the data were best fit by a curvilinear regression model using a power function (as shown in Fig. 5), with R2 = 0.595, F1,237 = 350.180, and P < 0.001.
Fig. 5.
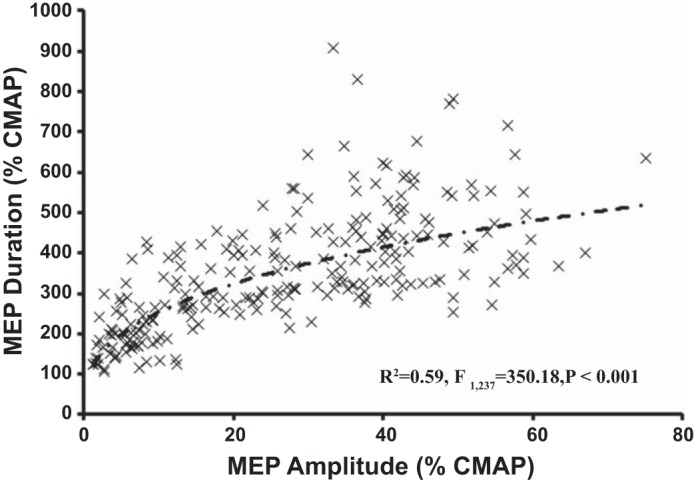
Relationship between the motor-evoked potential (MEP) duration, expressed as a percentage of the compound muscle action potential (CMAP) duration, and MEP amplitude. Each data point represents an averaged MEP duration and amplitude value for a specific level of stimulus intensity and muscle activation state in each individual. The dashed line represents the optimal curvilinear model.
Intracortical inhibition and facilitation.
In the same sitting, the subjects underwent paired-pulse TMS testing for assessment of SICI and ICF. The averaged SICI, between ISI 1–7 ms, was 12.9 ± 1.2%; i.e., the test stimulus had to be increased by 12.9% to produce the target MEP. ICF was −1.1 ± 0.6%. These values for SICI and ICF are comparable with previously established normative values (Vucic et al. 2006).
Correlation analyses confirmed a significant relationship between mean SICI and MEP duration generated across a range of TMS intensities (120, 130, and 150% RMT) at rest (Table 1). With the focus on the maximal TMS intensities, a significant inverse linear relationship was seen between the average SICI and total MEP duration (TMS intensity 150% RMT) produced at rest (R2 = 0.141, F1,28 = 4.583, P = 0.041; Fig. 6A). There were similar correlations between SICI and the MEP amplitude recorded at rest (Table 1). In other words, subjects with less SICI had larger and longer MEPs.
Table 1.
Results of a correlation analysis between motor-evoked potential (MEP) duration and amplitude, as well as average short interval-intracortical inhibition (SICI) between interstimulus interval 1–7 ms, recorded at rest
| Rest MEP Duration | Average SICI, 1–7 ms | Rest MEP Amplitude | Average SICI, 1–7 ms |
|---|---|---|---|
| 110% RMT | r = −0.222, P = 0.119 | 110% RMT | r = −0.458, P = 0.006 |
| 120% RMT | r = −0.362, P = 0.025 | 120% RMT | r = −0.469, P = 0.004 |
| 130% RMT | r = −0.438, P = 0.008 | 130% RMT | r = −0.486, P = 0.003 |
| 150% RMT | r = −0.495, P = 0.003 | 150% RMT | r = −0.323, P = 0.041 |
RMT, resting motor threshold.
Fig. 6.
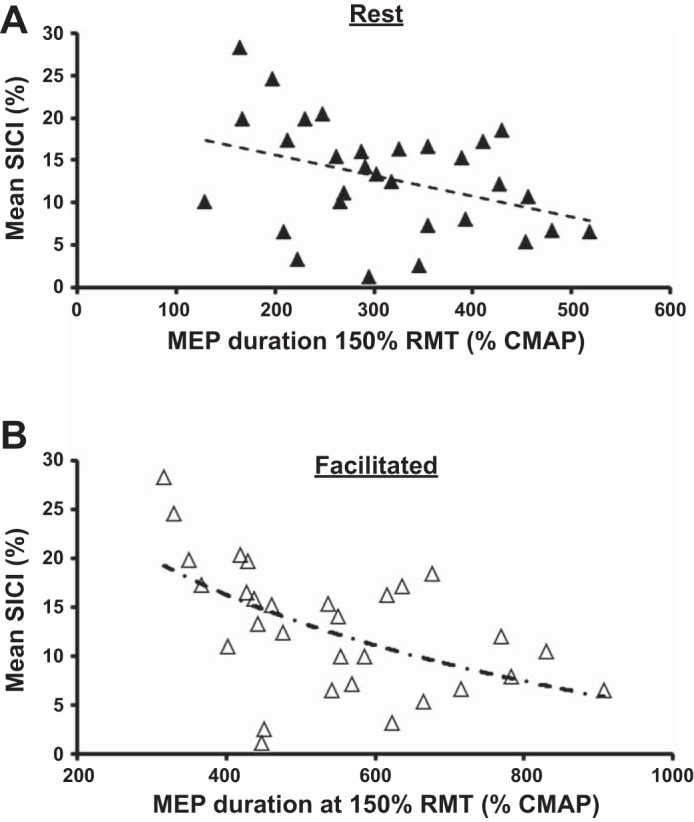
Relationship between mean short interval-intracortical inhibition (SICI) between interstimulus intervals 1–7 ms and the motor-evoked potential (MEP) duration, expressed as a percentage of the compound muscle action potential (CMAP) duration, at rest (A) and with facilitation (B). Each data point represents the averaged SICI and MEP duration [single pulse at 150% resting motor threshold (RMT)] for an individual subject (n = 30). The dashed lines represent the optimal linear and curvilinear models (logarithmic function).
The relationship between SICI and MEP duration was even stronger during facilitation (R2 = 0.245, F1,28 = 9.099, P = 0.005). Specifically, a curvilinear regression model (logarithmic relationship) best fitted the relationship between average SICI and facilitated MEP duration (generated with TMS intensity set to 150% RMT), with evidence of a significant inverse regression relationship (R2 = 0.340, F2,27 = 8.479, P = 0.001; Fig. 6B). Direct comparison of linear and logarithmic models confirmed the greater strength of the logarithmic relationship with an F change of 6.177 and P = 0.019. In contrast, there was no significant relationship between SICI recorded at rest and facilitated MEP amplitude at 150% RMT (F1,29 = 3.260, P = 0.082).
There were no significant correlations between the rest or facilitated MEP durations and ICF or RMT. In addition, there were no significant correlations between the MEP tail duration at any of the TMS intensities and averaged SICI, RMT, or ICF.
DISCUSSION
Findings from the present study have confirmed that both TMS intensity and muscle activation state impact significantly on MEP duration and amplitude. Interestingly, whereas the MEP duration and amplitude increased across stimulus intensities in the resting state, a differential effect was evident with facilitation, whereby the MEP duration continued to increase, and the MEP amplitude exhibited a ceiling effect. As a result, there was a nonlinear association between the MEP duration and amplitude, with a significant effect of MEP amplitude on MEP duration in a curvilinear regression model. An increase in spinal motor neuron excitability has been postulated as the main factor underlying the enhancement of MEP responses in transition from rest to activity. However, there is an increase in the amplitude and frequency of indirect waves in descending corticospinal volleys (Di Lazzaro et al. 1998b), and this implies a cortical contribution to changes in these measures of the MEP. The significant correlations between SICI and resting MEP parameters also suggest that cortical processes contribute to the duration and amplitude of the resting MEP. The significant inverse relationship between facilitated MEP duration and SICI raises the possibility that subjects with less SICI at rest have more prolonged MEPs during voluntary activity. Taken together, the findings in the present study suggest a contribution of both cortical processes and nonpropriospinal spinal mechanisms in mediating prolongation of MEP duration with voluntary contraction.
The effects of facilitation on MEP parameters.
Voluntary muscle contraction results in a facilitated MEP response characterized by a shorter onset latency, increased amplitude, and prolonged duration (Valls-Solé et al. 1994). Previous studies have established that whereas the MEP amplitude saturates at ~50% of the CMAP amplitude, the duration of the facilitated MEP continues to increase with stimulus intensity (Valls-Solé et al. 1994). During a tonic, voluntary contraction, a number of factors produce increased excitability of the spinal motoneuron pool (Pierrot-Deseilligny and Burke 2012). Increased excitability of the spinal motoneuron pool was proposed as a likely mechanism for prolongation of the MEP duration and shortening of onset latency (Day et al. 1987; Thompson et al. 1991; Ugawa et al. 1994). The ceiling effects observed with MEP amplitude were attributed to phase cancellation of repetitive motor-unit discharges (Kiers et al. 1995; Valls-Solé et al. 1994), a notion supported by triple-stimulation techniques (Magistris et al. 1998). The present study extends these findings by establishing a significant correlation between changes in the facilitated MEP duration and amplitude, thereby suggesting that similar physiological processes underlie changes in both parameters. In addition to changes at the spinal level mentioned above, greater voluntary effort is associated with changes in the descending corticospinal volleys.
Although there was a significant correlation between the MEP duration and amplitude, the degree of association was modest, and the main effect (stimulus intensity × activation state) influenced the MEP duration only. This suggests that a number of factors contribute to the greater MEP duration during voluntary contractions. Whereas increases in spinal motoneuron excitability appear to be important in enhancing MEP responses when transitioning from rest to activity, the increasing complexity of descending corticospinal volleys is likely to underlie the changes in MEP parameters with stronger voluntary contraction (Di Lazzaro et al. 1998b). Temporal summation of the components of the stronger and more complex corticospinal volley would lead to prolongation of MEP duration. However, in addition, the prominent correlation between averaged SICI and MEP duration during facilitation implies that disinhibition of the motor cortex may also contribute to prolongation of MEP duration.
Recently, it has been suggested that prolongation of MEP duration and development of the MEP tail were mediated by activation of premotor propriospinal neurons via descending supraspinal inputs (Brum et al. 2016). The basis for this was the absence of significant prolongation of MEP duration in patients with multiple sclerosis, hereditary spastic paraplegia, and psychogenic weakness. In patients with multiple sclerosis and hereditary spastic paraplegia, the authors argued that any potential effects of propriospinal interneurons were masked by a significant MEP prolongation at rest and in those with psychogenic weakness, by a failure of propriospinal activation secondary to inadequate voluntary effort. Whereas the presence of propriospinal projections to intrinsic hand muscles has not been documented in healthy human subjects (Lourenço et al. 2007; Pierrot-Deseilligny 1996; Pierrot-Deseilligny and Burke 2012), thereby arguing against a propriospinal contribution in healthy humans, the possibility of a propriospinal effect on MEP duration in pathological states cannot be completely discounted.
In conclusion, findings in the present study confirm that MEP duration is significantly prolonged with voluntary contraction and is accompanied by an increase in MEP amplitude and shortening of onset latency. Whereas a ceiling effect was evident for MEP amplitude, MEP duration continued to increase across the stimulus intensities, and this was accompanied by the presence of an MEP tail. A number of physiological processes are likely to be involved in the increase in MEP duration, and they are likely to operate at different levels of the neuraxis. Additionally, the finding of a significant inverse regression relationship between SICI and facilitated MEP duration suggests a contribution of cortical processes in prolongation of facilitated MEP duration. In contrast, the lack of correlation between SICI and the facilitated MEP amplitude is consistent with existing evidence that facilitation of MEP amplitude during a tonic voluntary contraction is primarily spinal (Di Lazzaro et al. 1998b; Kaneko et al. 1996), perhaps suggesting a contribution of nonpropriospinal mechanisms. Future studies should assess the changes in MEP duration in disease predominantly affecting the motor cortex and corticospinal tracts, such as amyotrophic lateral sclerosis, to glean the usefulness of MEP duration as a pathophysiological biomarker.
GRANTS
Support for this work was provided by the Motor Neurone Disease (MND) Research Institute of Australia and the Stanford Family MND Research Grant.
DISCLOSURES
No conflicts of interest, financial or otherwise, are declared by the authors.
AUTHOR CONTRIBUTIONS
M.A.J.v.d.B. and S.V. conceived and designed research; M.A.J.v.d.B., N.G., P.M., and S.V. performed experiments; M.A.J.v.d.B., N.G., and S.V. analyzed data; M.A.J.v.d.B., D.B., and M.C.K. interpreted results of experiments; M.A.J.v.d.B. and S.V. prepared figures; M.A.J.v.d.B., D.B., and S.V. drafted manuscript; M.A.J.v.d.B., N.G., P.M., D.B., M.C.K., and S.V. edited and revised manuscript; M.A.J.v.d.B., N.G., P.M., D.B., M.C.K., and S.V. approved final version of manuscript.
REFERENCES
- Alstermark B, Isa T, Pettersson LG, Sasaki S. The C3–C4 propriospinal system in the cat and monkey: a spinal pre-motoneuronal centre for voluntary motor control. Acta Physiol (Oxf) 189: 123–140, 2007. doi: 10.1111/j.1748-1716.2006.01655.x. [DOI] [PubMed] [Google Scholar]
- Brum M, Cabib C, Valls-Solé J. Clinical value of the assessment of changes in MEP duration with voluntary contraction. Front Neurosci 9: 505, 2016. doi: 10.3389/fnins.2015.00505. [DOI] [PMC free article] [PubMed] [Google Scholar]
- Burke D, Hicks R, Gandevia SC, Stephen J, Woodforth I, Crawford M. Direct comparison of corticospinal volleys in human subjects to transcranial magnetic and electrical stimulation. J Physiol 470: 383–393, 1993. doi: 10.1113/jphysiol.1993.sp019864. [DOI] [PMC free article] [PubMed] [Google Scholar]
- Chen R, Cros D, Curra A, Di Lazzaro V, Lefaucheur JP, Magistris MR, Mills K, Rösler KM, Triggs WJ, Ugawa Y, Ziemann U. The clinical diagnostic utility of transcranial magnetic stimulation: report of an IFCN committee. Clin Neurophysiol 119: 504–532, 2008. doi: 10.1016/j.clinph.2007.10.014. [DOI] [PubMed] [Google Scholar]
- Day BL, Dressler D, Maertens de Noordhout A, Marsden CD, Nakashima K, Rothwell JC, Thompson PD. Electric and magnetic stimulation of human motor cortex: surface EMG and single motor unit responses. J Physiol 412: 449–473, 1989. doi: 10.1113/jphysiol.1989.sp017626. [DOI] [PMC free article] [PubMed] [Google Scholar]
- Day BL, Rothwell JC, Thompson PD, Dick JP, Cowan JM, Berardelli A, Marsden CD. Motor cortex stimulation in intact man. 2. Multiple descending volleys. Brain 110: 1191–1209, 1987. doi: 10.1093/brain/110.5.1191. [DOI] [PubMed] [Google Scholar]
- Di Lazzaro V, Oliviero A, Mazzone P, Pilato F, Saturno E, Dileone M, Tonali PA. Generation of I waves in the human: spinal recordings. Clinical Neurophysiol Suppl 56: 143–152, 2003. [DOI] [PubMed] [Google Scholar]
- Di Lazzaro V, Oliviero A, Profice P, Saturno E, Pilato F, Insola A, Mazzone P, Tonali P, Rothwell JC. Comparison of descending volleys evoked by transcranial magnetic and electric stimulation in conscious humans. Electroencephalogr Clin Neurophysiol 109: 397–401, 1998a. doi: 10.1016/S0924-980X(98)00038-1. [DOI] [PubMed] [Google Scholar]
- Di Lazzaro V, Profice P, Ranieri F, Capone F, Dileone M, Oliviero A, Pilato F. I-wave origin and modulation. Brain Stim 5: 512–525, 2012. doi: 10.1016/j.brs.2011.07.008. [DOI] [PubMed] [Google Scholar]
- Di Lazzaro V, Restuccia D, Oliviero A, Profice P, Ferrara L, Insola A, Mazzone P, Tonali P, Rothwell JC. Effects of voluntary contraction on descending volleys evoked by transcranial stimulation in conscious humans. J Physiol 508: 625–633, 1998b. doi: 10.1111/j.1469-7793.1998.625bq.x. [DOI] [PMC free article] [PubMed] [Google Scholar]
- Di Lazzaro V, Restuccia D, Oliviero A, Profice P, Ferrara L, Insola A, Mazzone P, Tonali P, Rothwell JC. Magnetic transcranial stimulation at intensities below active motor threshold activates intracortical inhibitory circuits. Exp Brain Res 119: 265–268, 1998c. doi: 10.1007/s002210050341. [DOI] [PubMed] [Google Scholar]
- Di Lazzaro V, Ziemann U, Lemon RN. State of the art: physiology of transcranial motor cortex stimulation. Brain Stimul 1: 345–362, 2008. doi: 10.1016/j.brs.2008.07.004. [DOI] [PubMed] [Google Scholar]
- Fisher RJ, Nakamura Y, Bestmann S, Rothwell JC, Bostock H. Two phases of intracortical inhibition revealed by transcranial magnetic threshold tracking. Exp Brain Res 143: 240–248, 2002. doi: 10.1007/s00221-001-0988-2. [DOI] [PubMed] [Google Scholar]
- Giboin LS, Lackmy-Vallée A, Burke D, Marchand-Pauvert V. Enhanced propriospinal excitation from hand muscles to wrist flexors during reach-to-grasp in humans. J Neurophysiol 107: 532–543, 2012. doi: 10.1152/jn.00774.2011. [DOI] [PubMed] [Google Scholar]
- Hanajima R, Ugawa Y, Terao Y, Enomoto H, Shiio Y, Mochizuki H, Furubayashi T, Uesugi H, Iwata NK, Kanazawa I. Mechanisms of intracortical I-wave facilitation elicited with paired-pulse magnetic stimulation in humans. J Physiol 538: 253–261, 2002. doi: 10.1113/jphysiol.2001.013094. [DOI] [PMC free article] [PubMed] [Google Scholar]
- Hunter SK, McNeil CJ, Butler JE, Gandevia SC, Taylor JL. Short-interval cortical inhibition and intracortical facilitation during submaximal voluntary contractions changes with fatigue. Exp Brain Res 234: 2541–2551, 2016. doi: 10.1007/s00221-016-4658-9. [DOI] [PMC free article] [PubMed] [Google Scholar]
- Isa T, Kinoshita M, Nishimura Y. Role of direct vs. indirect pathways from the motor cortex to spinal motoneurons in the control of hand dexterity. Front Neurol 4: 191, 2013. doi: 10.3389/fneur.2013.00191. [DOI] [PMC free article] [PubMed] [Google Scholar]
- Isa T, Ohki Y, Seki K, Alstermark B. Properties of propriospinal neurons in the C3–C4 segments mediating disynaptic pyramidal excitation to forelimb motoneurons in the macaque monkey. J Neurophysiol 95: 3674–3685, 2006. doi: 10.1152/jn.00103.2005. [DOI] [PubMed] [Google Scholar]
- Kaneko K, Kawai S, Fuchigami Y, Shiraishi G, Ito T. Effect of stimulus intensity and voluntary contraction on corticospinal potentials following transcranial magnetic stimulation. J Neurol Sci 139: 131–136, 1996. [PubMed] [Google Scholar]
- Kiers L, Clouston P, Chiappa KH, Cros D. Assessment of cortical motor output: compound muscle action potential versus twitch force recording. Electroencephalogr Clin Neurophysiol 97: 131–139, 1995. doi: 10.1016/0924-980X(94)00325-2. [DOI] [PubMed] [Google Scholar]
- Kinoshita M, Matsui R, Kato S, Hasegawa T, Kasahara H, Isa K, Watakabe A, Yamamori T, Nishimura Y, Alstermark B, Watanabe D, Kobayashi K, Isa T. Genetic dissection of the circuit for hand dexterity in primates. Nature 487: 235–238, 2012. doi: 10.1038/nature11206. [DOI] [PubMed] [Google Scholar]
- Lourenço G, Iglesias C, Marchand-Pauvert V. Effects produced in human arm and forearm motoneurones after electrical stimulation of ulnar and median nerves at wrist level. Exp Brain Res 178: 267–284, 2007. doi: 10.1007/s00221-006-0729-7. [DOI] [PubMed] [Google Scholar]
- Magistris MR, Rösler KM, Truffert A, Myers JP. Transcranial stimulation excites virtually all motor neurons supplying the target muscle. A demonstration and a method improving the study of motor evoked potentials. Brain 121: 437–450, 1998. doi: 10.1093/brain/121.3.437. [DOI] [PubMed] [Google Scholar]
- Malmgren K, Pierrot-Deseilligny E. Evidence that low threshold afferents both evoke and depress polysynaptic excitation of wrist flexor motoneurones in man. Exp Brain Res 67: 429–432, 1987. doi: 10.1007/BF00248563. [DOI] [PubMed] [Google Scholar]
- Martin PG, Gandevia SC, Taylor JL. Muscle fatigue changes cutaneous suppression of propriospinal drive to human upper limb muscles. J Physiol 580: 211–223, 2007. doi: 10.1113/jphysiol.2006.125997. [DOI] [PMC free article] [PubMed] [Google Scholar]
- Mazevet D, Meunier S, Pradat-Diehl P, Marchand-Pauvert V, Pierrot-Deseilligny E. Changes in propriospinally mediated excitation of upper limb motoneurons in stroke patients. Brain 126: 988–1000, 2003. doi: 10.1093/brain/awg088. [DOI] [PubMed] [Google Scholar]
- Pasquereau B, DeLong MR, Turner RS. Primary motor cortex of the parkinsonian monkey: altered encoding of active movement. Brain 139: 127–143, 2016. doi: 10.1093/brain/awv312. [DOI] [PMC free article] [PubMed] [Google Scholar]
- Pierrot-Deseilligny E. Transmission of the cortical command for human voluntary movement through cervical propriospinal premotoneurons. Prog Neurobiol 48: 489–517, 1996. doi: 10.1016/0301-0082(96)00002-0. [DOI] [PubMed] [Google Scholar]
- Pierrot-Deseilligny E, Burke D. Propriospinal transmission of descending motor commands. In: The Circuitry of the Human Spinal Cord: Spinal and Corticospinal Mechanisms of Movement. Cambridge: Cambridge University Press, 2012, p. 395–442. doi: 10.1017/CBO9781139026727.011. [DOI] [Google Scholar]
- Rossini PM, Berardelli A, Deuschl G, Hallett M, Maertens de Noordhout AM, Paulus W, Pauri F; The International Federation of Clinical Neurophysiology . Applications of magnetic cortical stimulation. Electroencephalogr Clin Neurophysiol Suppl 52: 171–185, 1999. [PubMed] [Google Scholar]
- Rossini PM, Burke D, Chen R, Cohen LG, Daskalakis Z, Di Iorio R, Di Lazzaro V, Ferreri F, Fitzgerald PB, George MS, Hallett M, Lefaucheur JP, Langguth B, Matsumoto H, Miniussi C, Nitsche MA, Pascual-Leone A, Paulus W, Rossi S, Rothwell JC, Siebner HR, Ugawa Y, Walsh V, Ziemann U. Non-invasive electrical and magnetic stimulation of the brain, spinal cord, roots and peripheral nerves: Basic principles and procedures for routine clinical and research application. An updated report from an I.F.C.N. Committee. Clin Neurophysiol 126: 1071–1107, 2015. doi: 10.1016/j.clinph.2015.02.001. [DOI] [PMC free article] [PubMed] [Google Scholar]
- Rusu CV, Murakami M, Ziemann U, Triesch J. A model of TMS-induced I-waves in motor cortex. Brain Stimul 7: 401–414, 2014. doi: 10.1016/j.brs.2014.02.009. [DOI] [PubMed] [Google Scholar]
- Stinear JW, Byblow WD. The contribution of cervical propriospinal premotoneurons in recovering hemiparetic stroke patients. J Clin Neurophysiol 21: 426–434, 2004. doi: 10.1097/00004691-200411000-00006. [DOI] [PubMed] [Google Scholar]
- Thompson PD, Day BL, Rothwell JC, Dressler D, Maertens de Noordhout A, Marsden CD. Further observations on the facilitation of muscle responses to cortical stimulation by voluntary contraction. Electroencephalogr Clin Neurophysiol 81: 397–402, 1991. doi: 10.1016/0168-5597(91)90029-W. [DOI] [PubMed] [Google Scholar]
- Ugawa Y, Uesaka Y, Terao Y, Hanajima R, Kanazawa I. Magnetic stimulation of corticospinal pathways at the foramen magnum level in humans. Ann Neurol 36: 618–624, 1994. doi: 10.1002/ana.410360410. [DOI] [PubMed] [Google Scholar]
- Valls-Solé J, Pascual-Leone A, Brasil-Neto JP, Cammarota A, McShane L, Hallett M. Abnormal facilitation of the response to transcranial magnetic stimulation in patients with Parkinson’s disease. Neurology 44: 735–741, 1994. doi: 10.1212/WNL.44.4.735. [DOI] [PubMed] [Google Scholar]
- Vucic S, Howells J, Trevillion L, Kiernan MC. Assessment of cortical excitability using threshold tracking techniques. Muscle Nerve 33: 477–486, 2006. doi: 10.1002/mus.20481. [DOI] [PubMed] [Google Scholar]
- Vucic S, Ziemann U, Eisen A, Hallett M, Kiernan MC. Transcranial magnetic stimulation and amyotrophic lateral sclerosis: pathophysiological insights. J Neurol Neurosurg Psychiatry 84: 1161–1170, 2013. doi: 10.1136/jnnp-2012-304019. [DOI] [PMC free article] [PubMed] [Google Scholar]


