

Abstract
miRNAs are small 22-nucleotide RNAs that can post-transcriptionally regulate gene expression. It has been proposed that dietary plant miRNAs can enter the human bloodstream and regulate host transcripts; however, these findings have been widely disputed. We here conduct the first comprehensive meta-study in the field, surveying the presence and abundances of cross-species miRNAs (xenomiRs) in 824 sequencing data sets from various human tissues and body fluids. We find that xenomiRs are commonly present in tissues (17%) and body fluids (69%); however, the abundances are low, comprising 0.001% of host human miRNA counts. Further, we do not detect a significant enrichment of xenomiRs in sequencing data originating from tissues and body fluids that are exposed to dietary intake (such as liver). Likewise, there is no significant depletion of xenomiRs in tissues and body fluids that are relatively separated from the main bloodstream (such as brain and cerebro-spinal fluids). Interestingly, the majority (81%) of body fluid xenomiRs stem from rodents, which are a rare human dietary contribution but common laboratory animals. Body fluid samples from the same studies tend to group together when clustered by xenomiR compositions, suggesting technical batch effects. Last, we performed carefully designed and controlled animal feeding studies, in which we detected no transfer of plant miRNAs into rat blood, or bovine milk sequences into piglet blood. In summary, our comprehensive computational and experimental results indicate that xenomiRs originate from technical artifacts rather than dietary intake.
Keywords: miRNA, microRNA, meta-study, exogenous miRNAs, next-generation sequencing, contamination, artifacts
INTRODUCTION
Over the past decade, RNAs extracted from cell-free body fluids have received increasing attention as novel diagnostic markers for disorders as diverse as narcolepsy, cancers, and viral infections (Mitchell et al. 2008; Winther et al. 2013; Holm et al. 2014a). Many distinct body fluids have been profiled for biomarkers (Weber et al. 2010; Holm et al. 2014b). Blood samples are most commonly used, as they are obtained from the human body with minimal invasion and can give snapshots of the transcriptome of many tissues that are communicating with the bloodstream (Chen et al. 2008; Schwarzenbach et al. 2014). Profiling of microRNAs (miRNAs), a group of small noncoding RNAs, is particularly promising because the only ∼22 nucleotides (nt) short fully matured miRNAs are considerably stable compared to other RNA species, such as mRNAs (Jung et al. 2010). The maturation is a process of sequential endonucleolytic cleavages of the primary miRNA transcript by RNase III enzymes (Ha and Kim 2014). After cleavage the mature miRNA is incorporated into the miRISC complex, where it serves to guide the complex to target sites in mRNAs. Once bound, the complex can regulate mRNA gene expression by inhibiting translation, promoting degradation or relocation to subcellular foci where mRNA is no longer accessible to the translational machinery. miRNAs in human body fluids have been identified as emerging effective biomarkers in many different biological states as well as diseases (Simonson and Das 2015; Fabris and Calin 2016). While most cell-free body fluid biomarker studies have been conducted by conventional quantitative PCR-based methods, an increasing number of more recent studies use deep sequencing as a method that is independent of prior knowledge of transcript sequence composition (Freedman et al. 2016).
The current state-of-the-art method for profiling body fluid miRNAs is next-generation sequencing of small RNAs (sRNA-seq). This technique detects millions of miRNAs in a single experiment and allows discovery of new transcripts (Burgos et al. 2014; Byron et al. 2016). Sequencing allows detection of miRNAs in an unbiased way that can lead to surprising results. For example, a recent report from Zhang et al. (2012) suggested that a miRNA (osa-MIR168) from a rice-rich diet can cross the human gut epithelium and enter the bloodstream where it can interact with and repress the human high-density lipoprotein RAP1 transcript. The ramifications of this observation are profound, since it implies that cross-species miRNAs (“xenomiRs”) can impact the human transcriptome through diet. This could open up a new research field of nutrition-specific RNA-based remedies and development of oral delivery of RNA-based medicine.
The xenomiR hypothesis is indirectly supported by studies showing that miRNAs extracted from plants (Philip et al. 2015) or from body fluids (Chen et al. 2008) are stable when subjected to high temperature or enzymatic digestions. Some in vivo studies support the initial finding that xenomiRs are present in body fluids of humans and other animals, however at a very low expression level (Wang et al. 2012, 2013). The most highly abundant Brassica oleracea MIR172 was found in stomach, intestine, serum, and feces of mice that were fed plant RNA extracts. The MIR172 abundance and peak time in multiple origins of samples was consistent with ordered dietary update: stomach > intestine > feces > serum (Liang et al. 2014). Another study found several plant and insect xenomiRs in serum and plasma samples. Interestingly, the rice-derived xenomiRs were dominating in the serum sample from Chinese ethnicity compared to the plasma sample from Caucasian ethnicity, which was dominated by corn-derived xenomiRs (Wang et al. 2012). In a recent study, new evidence of xenomiRs was presented showing that food-derived miRNAs were transferred to mammalian placenta and directly regulating fetus gene expression (Li et al. 2015). In another mouse study, the authors reported that MIR2911, derived from the honeysuckle plant, was present in animals drinking or gavage feeding honeysuckle. Additionally, the authors showed that the miRNAs were able to regulate influenza virus by reducing replication and rescued viral infection (Zhou et al. 2015).
In contrast, several studies were unable to reproduce the original findings or have provided direct evidence that the xenomiRs are the result of technical contaminations rather than diet-dependent cellular uptake. A number of groups have searched for plant xenomiRs in human body fluids but have been unable to find these sequences at any substantial level (Snow et al. 2013; Witwer et al. 2013). Similarly, other groups were unable to detect dietary xenomiRs when conducting controlled feeding studies in humans, mice, bees, and other insects (Dickinson et al. 2013; Witwer et al. 2013; Auerbach et al. 2016). Further, one independent research group investigated the xenomiR composition of sRNA-seq data from amphioxus animals, generated by the team of the original Zhang et al. (2012) publication. It was found that the amphioxus data contained rice miRNAs in exactly the same composition as in the previous human serum study from the same group (Tosar et al. 2014). Given that amphibia have an exclusive algae-based diet, this strongly suggests that the rice miRNAs identified in both studies are the result of contamination. In general, contaminations can occur at several steps in sequence data generation. They can happen if traces of samples are mixed, either in the field, clinic, or laboratory. Since next-generation sequencing is tremendously sensitive, a few molecules could feasibly cause false detection of xenomiRs. Functional contaminations can also occur during sequencing or the data analysis. Often, several sample cDNA libraries are sequenced together, and each read is assigned back to the sample through a barcode. If cDNA molecules are in spatial proximity during sequencing, their respective barcodes can be swapped. Additionally, if the barcodes are similar in sequence, the defaults analysis software can misassign the reads to the wrong sample (Kircher et al. 2012).
Despite the many studies on xenomiRs, it still remains unresolved if they originate from diet or from laboratory contaminations. Public sequence repositories contain hundreds of sRNA-seq data sets from human tissues and body fluids. Surprisingly, this resource has not been mined in a systematic manner to study the presence and compositions of xenomiRs. To address this, we conducted the first comprehensive meta-study of xenomiRs in 824 public human data sets. We developed a new computational pipeline to standardize and normalize the raw sequence data, allowing us to compare the results from multiple studies. We found that xenomiRs are present in many human sRNA-seq data sets, although in very low abundances. There is no enrichment of xenomiRs in samples that are exposed to dietary intake (liver and serum) compared to samples that are protected by the blood–brain barrier (brain and cerebrospinal fluid, CSF). The body fluid samples are dominated by xenomiRs from rodents, which are rare in human diets, but are common laboratory animals. We observe that the body fluid xenomiR profiles group by study (batch effects), suggesting that technical factors influence the xenomiR presence. In complementary controlled animal feeding studies, we see no transfer of dietary plant miRNAs into the bloodstream of rats, nor of cow milk miRNAs into piglets. In summary, our computational and wet-lab results provide evidence for a technical rather than a biological origin of xenomiRs in human body fluids and tissues.
RESULTS
Meta-study of 824 human sRNA-seq data sets
We collected 824 public human sRNA-seq data sets, comprising a total of 10 billion sequencing reads, to profile the presence and abundance of xenomiRs (Supplemental Table 1). These data sets included 215 serum and plasma samples and 37 exosome samples, since these are body fluids that have previously been described to contain xenomiRs (Wang et al. 2012, 2013; Zhang et al. 2012; Liang et al. 2015). We also selected 180 samples of cerebrospinal fluid (CSF), which is separated from the bloodstream by the brain–blood barrier (BBB), which unprotected small RNAs are unlikely to cross (Pardridge 2005; Boudreau et al. 2011). To investigate whether xenomiRs accumulate in cellular tissues, we selected 93 samples from liver and 197 samples from blood cells. We considered these to be the tissues most likely to be exposed to dietary transcripts. As a negative control, we selected 102 samples from human brain, since this organ is separated from the bloodstream by the BBB. The raw sequence data from the 824 sets were selected, quality controlled, and preprocessed using a standardized computational pipeline, to ensure that results are comparable. Specifically, the data sets were selected and automatically downloaded from the public GEO database based on keyword searches (Fig. 1; Supplemental Fig. 1; Materials and Methods). The data were subjected to manual inspection and a subsequent stringent computational quality control based on sequence quality and complexity. The remaining reads were preprocessed by removing the sequencing adapters and discarding short reads that are unlikely to be functional miRNAs. The processed data were then used to assess the presence and abundance of xenomiRs.
FIGURE 1.
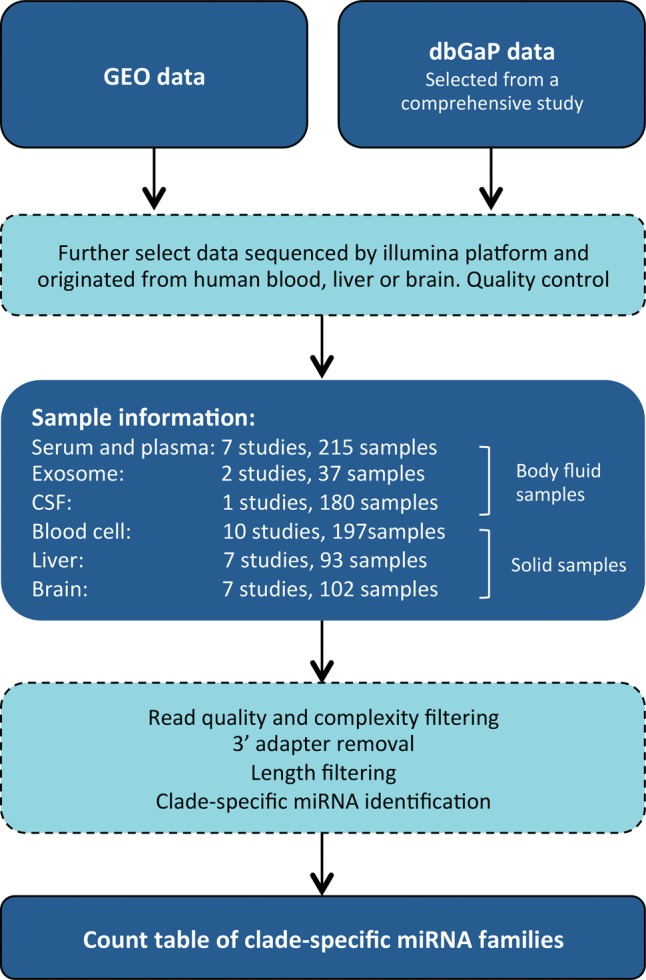
Flowchart of the computational pipeline used to analyze the sequence data.
XenomiRs are largely absent in brain, liver, and blood cell samples
We first investigated the presence of xenomiRs in the 392 human tissue data sets, comprised of samples from liver, brain, and blood (we here consider blood cells and whole blood as tissue). To perform a stringent analysis, we only considered miRNAs that are specific to certain animal and plant clades (branches of the phylogenetic tree) (Sempere et al. 2006; Wheeler et al. 2009; Taylor et al. 2014). For instance, the miR-3 family is known to be present only in insects, so the presence of miR-3 constitutes strong evidence for insect RNA. In contrast, deeply conserved miRNAs like let-7 are present in all bilaterian animals. Therefore, it is difficult to distinguish insect let-7 and primate let-7, given that sequence differences can be obscured by RNA editing, sequencing errors, etc. A full list of the conservative clade-specific miRNA families can be found in Supplemental Table 2. When analyzing the human 392 tissue samples, we observed abundant primate-specific miRNAs in all samples (Fig. 2). This is according to expectations, as these very likely represent bona fide endogenous human miRNAs. On average, a median of 979 primate miRNA counts from 17 distinct primate miRNA families were detected (Supplemental Fig. 2A,D). It should be noted that these counts are substantially less than the total number of human miRNAs, since we here only consider the primate clade-specific miRNAs, which tend to be lowly expressed. While primate-specific miRNAs were found in 100% of the samples, xenomiRs (combined clade-specific miRNAs from rodents, insects, etc.) were present in only 17% of the tissue samples (Supplemental Fig. 3A). Some entire studies were completely void of any xenomiRs, such as GSE67491 with 30 samples comprising more than 244 million reads. This complete absence of xenomiRs in some large studies demonstrates the high specificity and low false-positive rate of our pipeline. In the samples that did contain xenomiRs, we found a median of 3.5 xenomiR read counts and 1.5 distinct xenomiR families, much lower than for the primate-specific miRNAs (Supplemental Fig. 2A,D). In summary, we find xenomiRs absent from most human tissue samples. In the samples where they are present, they are very lowly abundant.
FIGURE 2.

Presence and abundance of xenomiRs in tissue samples from human blood cell, liver, and brain. Every column represents one sample. Samples are grouped in studies (facets) based on database accession number (GSE number shown below each study). Every row represents one type of animal or plant clade. A dot indicates the presence of one or more xenomiRs belonging to the clade in the given sample. The dot size indicates how many distinct xenomiRs belonging to the clade were detected. The dot gradient from light to dark indicates the overall abundance of the xenomiRs. Dot color codes: green, plant clades; red, mammal clades; purple, bird, reptile, fish, echinochozoa, or lophotrochozoa; gray, insect, nematode, or animal sponge. The brain samples collected from the individual with brain diseases are shaded with gray background. Consistent with all samples deriving from humans, the primate-specific miRNAs (the large red dots) are consistently present across all samples. XenomiRs are overall rarely present and lowly expressed compared to the primate-specific miRNAs.
XenomiRs are not enriched in tissues exposed to dietary intake
Of the tissues in the human body, we would expect liver and blood cells to be relatively exposed to dietary molecules. Conversely, brain cells would be insulated from miRNA molecules by the BBB (Pardridge 2005; Boudreau et al. 2011). Despite this, we found that xenomiRs were present in similar fractions (28%) in the exposed liver and in the relatively protected brain samples. In addition, xenomiRs were present at a lower fraction of the blood cells (7%) than in the brain and liver samples (28%) (Supplemental Fig. 4: p1.1). Since the BBB can be permeabilized by neurodegenerative diseases, we repeated the analyses above considering only healthy control brains, with the comparable results (Supplemental Fig. 4: p1.2). These results support a nondietary origin of the detected xenomiRs. Interestingly, summed over all the 392 tissue samples, the xenomiRs were significantly overrepresented in older studies from before the year 2013 relative to the newer studies (88% versus 12%, P-value <0.001, Supplemental Fig. 4: p2). In addition, the older studies were more likely to contain xenomiRs from multiple clades than were the recent ones (P-value <0.001, Supplemental Fig. 4: p3). This observation suggests that the presence of xenomiRs in tissue samples is influenced by technical factors.
XenomiRs are commonly present in body fluids
We next analyzed the occurrence of miRNAs in the 432 human body fluid data sets, comprised of samples from serum, plasma, exosome, and CSF. As in the tissue samples, we found primate-specific (presumably endogenous human) miRNAs present in all body fluid samples (Fig. 3). However, the primate-specific miRNAs were overall less abundant and less diverse (in terms of distinct miRNA families) in the body fluid samples than in the tissue samples described above (median of count: 204 versus 979, P-value <0.001, distinct miRNA families: 11 versus 17, P-value <0.001; Supplemental Fig. 4: p4–5). Interestingly, xenomiRs were present in more body fluid samples (69% of samples) than in tissue samples (17%) (Figs. 2, 3, P-value <0.001; Supplemental Fig. 4: p6). The most common xenomiRs were from rodent, dicot, and insect clades (Supplemental Table 3B). We found that the rodent, euphyllophyta, lophotrochozoa, and insect xenomiRs group by study in body fluid samples (permutation test P-value <0.05) (Supplemental Fig. 4: p7); for instance, serum and CSF samples from study PRJNA241469 contained numerous rodent sequences, while serum samples from study GSE59565 had many insect sequences. The body fluids had low abundance and diversity of xenomiRs, with a median five xenomiR read counts and two distinct xenomiR families. These abundances and diversities were comparable in the tissue samples (P-value = 0.278 and P-value = 0.870, respectively, Supplemental Fig. 4: p8–9). Interestingly, xenomiRs were found in comparable fractions of serum (64%) and CSF (70%) from the study PRJNA241469, even though the CSF is separated from the bloodstream by the BBB (P-value = 0.312, Supplemental Fig. 4: p10). Serum and CSF xenomiR levels were also similar when considering only CSF from healthy individuals (χ2 test, P-value = 0.476). To demonstrate that our findings are not biased by the choice of miRNA database, we repeated the analysis using only the highly curated miRNAs from MirGeneDB (Fromm et al. 2015). For zebrafish, chicken, and mouse we find exactly the same amount of miRNAs reported using miRBase and MirGeneDB (Supplemental Fig. 5). For human, we saw an imperfect correlation (Pearson's correlation coefficient = 0.61) between miRBase and MirGeneDB. However, all our conclusions regarding P-values and grouping of samples still hold using the miRNAs reported by MirGeneDB (Supplemental Fig. 5). Overall, these results show that xenomiRs are present, although at very low levels, in most of the studied body fluid samples.
FIGURE 3.

Presence and abundance of xenomiRs in human body fluid samples from serum, plasma, and cerebrospinal fluid (CSF), similar to Figure 2. Each study is indicated with a color identical to the colors used in Figure 5C,D, for easy comparison (top strip of each facet). The CSF samples collected from the individual with brain diseases are shaded with gray background. The xenomiRs are present in more body fluid samples than tissue samples (Fig. 2). Most xenomiRs are derived from clades of rodent, dicot, insects, and euphyllophyta.
Most xenomiRs originate from unlikely food sources
If xenomiRs have dietary origins, we would expect that their composition would reflect the common human diet. For instance, based on our dietary preferences, one can expect a strong presence of crop plants (dicots, monocots, and euphyllophyta), fish and birds and a low presence of animal sponges, nematodes, insects, lophotrophozoa, echinoderms, and rodents, as these animals rarely constitute the human diet. Surprisingly, we find that rodents and dicots are the two clades that have the strongest xenomiR presence in the 432 body fluid samples (each is present in 34% and 29% of the samples, respectively) (Fig. 4; Supplemental Fig. 3B). Insect and euphyllophyta xenomiRs are also common (present in 13% and 11% of the samples). Even though birds and fish both comprise common human food sources, these xenomiRs were only rarely observed in the serum, plasma, and exosome samples (0.8% and 4% percentages of samples, respectively). Regarding the prevalence of rodent sequences in the body fluid samples, rodents are accepted as a source of protein in the tropical world, but even there they only served as a supplement to the regular diets of humans (Fiedler 1990). Notably, rodents are of course widely used as model organisms (Wolff and Sherman 2008). Since most rodent-specific xenomiRs originate from a single study PRJNA241469 where the subjects were recruited in the USA, we speculate that the rodent xenomiRs are more likely derived from model organisms such as mouse and rat rather than from rodents supplied as a meat source. Regarding the insect sequences, it is not surprising that the human diet comprises traces of insects even in the developed world, as for instance wheat flour can harbor more than 150 insect fragments per 100 g (U.S. Food and Drug Administration). However, the human diet certainly includes many orders of magnitude more plant than insect material, and this disproportion is not reflected in the xenomiR abundances. We observe that although the abundances of plant dicot xenomiRs were statistically significantly higher than the insect (count median: three versus two, P-value = 0.004, Supplemental Fig. 4: p12), the count difference was not as huge as the disproportion of plant–insect content in diet. Last, the euphyllophyta xenomiRs like the previously reported MIR168 were present in a minority (11%) of the body fluid samples, showing that it is not commonly found in humans. These results show that the xenomiR composition does not reflect human food sources.
FIGURE 4.

Radar plots showing the overall abundances of human miRNAs, primate-specific miRNAs, and xenomiRs in 432 tissue samples (left), 392 body fluid samples (center), and all 824 samples (right). Every sample is represented by a line from center to the edge of the circle, where the height indicates the logarithm-transformed read counts of the different categories as shown in the legend. In total, the 824 data sets comprise a total of 10.0 billion sequencing reads, including 3.4 billion human miRNA reads, and 40.1 thousand xenomiR reads. Compared to the human miRNAs, the xenomiRs comprise 0.001%.
In summary, the 824 data sets comprise a total of 10.0 billion sequencing reads. We found that 3.4 billion (33%) reads are human miRNAs, of which 1.3 million reads (0.04% of human miRNAs) are primate-specific. The primate-specific miRNA reads are substantially less than the total number of human miRNAs in the samples, since the primate-specific miRNAs tend to be lowly expressed. Generally speaking, xenomiRs are lowly abundant, comprising only 0.001% (40,055 reads) of human miRNA reads (Fig. 4; Supplemental Table 3).
Human miRNA abundances are determined by body fluid type
Sequencing results are known to be influenced by technical factors that are study-specific (“batch effects”) (Akey et al. 2007; Leek 2014). To investigate if the measured human miRNA composition of the body fluid samples is more strongly influenced by biology or batch effects, we grouped the samples by principal component analysis (PCA). Since different tissues and cell types are known to have distinct miRNA profiles (Landgraf et al. 2007), we expected the body fluid samples to group according to their type (serum, exosome, etc.). Interestingly, we found that samples group both according to study (Fig. 5A) and also according to their sample type (Fig. 5B). However, hierarchical clustering revealed that the samples group primarily by sample type and secondarily by study (Supplemental Fig. 6). This is also observed in the PCA analysis where the samples grouped according to study, but only within the region primarily defined by the sample type (Fig. 5A,B). For instance, the serum samples from study PRJNA241469 clearly grouped with the other serum types, rather than with the CSF samples from the same study. These results show that the measured endogenous miRNA composition is determined primarily by the body fluid type.
FIGURE 5.

Principal component analysis (PCA) grouping of samples based on primate-specific miRNAs (upper panels) or xenomiRs (lower panels). Each dot represents one of the body fluid samples (n = 432 samples with primate-specific miRNAs present in upper panel; n = 292 samples with xenomiRs present in the lower panel). In the left panels, dot colors indicate the study that samples belong to. In the right panels, dot colors indicate the biological origin of the sample (CSF, exosome, or serum/plasma). (A) The samples separate by study when grouped according to primate miRNA profile. However, this grouping is secondary to the grouping by the biological origin (see next subfigure). (B) The first and second principal components separate the samples into three groups. The light tan dots on the top right side represent samples from CSF. The dark tan dots on the bottom side represent the serum and plasma samples that are partly overlapped with exosome samples (medium tan dots). (C) The dots are distributed into three branches that are driven by lophotrochozoa/insects, rodent, and dicot xenomiRs. The dots from each study tend to group, each along one of the three branches. (D) The light, medium, and dark tan dots are randomly distributed into three branches. There is no tendency of grouping in terms of the sample origin.
XenomiR compositions are determined by technical batch effects
We next studied the patterns of the body fluid samples when grouped by xenomiR composition. If xenomiRs originate from diet, we would expect the samples to form clear dietary groups independent of the studies. For instance, samples from individuals with a vegetarian diet would group together, and similarly with individuals who had consumed fish or chicken. In contrast, we observed that the samples clearly grouped according to studies, suggesting technical batch effects (Fig. 5C, permutation test on hierarchical clustering showed four out of eight studies were significantly grouped, P-value <0.05, Supplemental Fig. 4: p13). This is in agreement with the hierarchical clustering analysis (Supplemental Fig. 7). This batch effect was particularly pronounced for studies PRJNA241469, GSE45722, GSE58410, and GSE59565 that had not been conducted with dietary restrictions. Further, we found four features that strongly determine the grouping: the presence of dicot, insect, lophotrochozoa, and rodent xenomiRs. As mentioned before, of these only the dicot xenomiRs are likely to have dietary origins. We did not observe any tendency for the samples to group according to the body fluid type when sorted by xenomiRs (Fig. 5D). These results indicate that xenomiR composition in human body fluids is determined by technical rather than dietary factors.
Interindividual analyses of serum and CSF defy dietary origination of xenomiRs
If xenomiRs had dietary origin, we would expect individuals with xenomiRs in CSF to have the same xenomiRs in the serum, since the foreign transcripts would need to enter the brain through the blood circulatory system. In the one study where CSF and serum small RNAs were profiled from the same individuals, we tested whether there is a significant tendency for xenomiRs to co-occur in CSF and serum of the same individuals. We found no significant tendency for xenomiRs from the euphyllophyta plant (P-value = 0.16), dicot plant (P-value = 0.04), insect (P-value = 0.27), or rodent (P-value = 0.08) to co-occur in the CSF and serum from the same individual, using binomial statistics with a significant level at 0.01. These results do not support that xenomiRs detected in CSF samples have entered through the bloodstream, and thus do not support a dietary origin of xenomiRs.
Controlled feeding in rat does not support dietary transfer of xenoRNAs
To investigate the influence of diet on blood xenomiR abundances, we performed a controlled feeding study in adult rats. Three different diets were applied and for each diet group we used three biological replicates: (i) three rats were fed only monocot plant material (rice), (ii) three rats were fed only dicot material (potatoes), and (iii) three rats were fed husbandry chow containing a defined mixture of grains, cereals, vitamins, minerals, and fats. After 28 d of controlled feeding (see Materials and Methods), small RNAs were isolated from the serum and sequenced. In these sRNA-seq libraries, we profiled rat miRNAs and searched for xenomiRs using the conservative method that we previously applied to the human data (Materials and Methods). If xenomiRs are indeed dietary-dependent, we would expect to see monocot-specific miRNAs in the rice-fed rats, dicot-specific sequences in the potato-fed rats, and both types in the rats that were fed chow. As expected, we identified abundant rodent-specific miRNAs in all nine samples (Supplemental Fig. 8). Interestingly, we observed a lack of plant xenomiRs in the rat serum. Specifically, we only observed two plant euphyllophyte sequences in a single rat sample.
We applied even more sensitive computational methods, by considering not only clade-specific sequences, but also miRNAs that are conserved but differ in sequence between species (see Materials and Methods). This method can potentially cause false positives when miRNAs are edited or subjected to sequencing errors. To account for this, we included negative and positive control samples. We used public A. thaliana sRNA-seq data as negative controls and public rice and potato sRNA-seq data as positive controls. If our computational approach is sound, we would expect many of the rice and potato sequences to be flagged as belonging to their respective species, but few of the A. thaliana sequences to be flagged as rice or potato. Indeed the rice and potato positive control sRNAs were clearly identified as such, each with >20,000 reads, while the relatively few A. thaliana sequences misidentified as rice suggest relatively low false-positive rates (Fig. 6). As in the previous analysis, abundant rat miRNAs were observed (>10,000 reads summing over triplicates); however, only three rice-specific reads were seen in the rice-fed rats, and two rice-specific reads in the potato-fed rats. Given these extremely low numbers, and the fact that we observe rice-specific reads in the potato-fed rats, these are likely false positives of our sensitive computational method.
FIGURE 6.
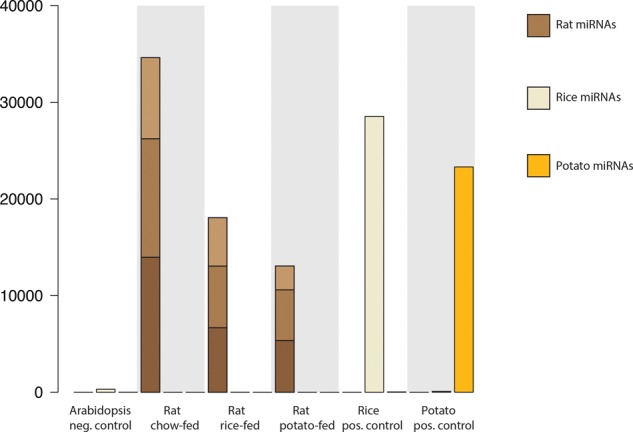
Expression of rat, rice, and potato miRNAs. Sequenced RNAs that unambiguously mapped to rat, rice, or potato miRNAs were identified and summed up. The samples include sRNAs from Arabidopsis (negative control), rats fed a regular chow diet, rats fed rice, rats fed potato, and from rice and potato (positive controls). The rat feeding was performed in triplicate, and the three brown shades show the number of rat miRNAs in each replicate.
Controlled feeding in piglets does not support transfer of milk xenomiRs
It has been suggested that miRNAs can be transferred from breast milk to the bloodstream (Munch et al. 2013; Baier et al. 2014; Izumi et al. 2015), although these results have also been contested (Laubier et al. 2015; Title et al. 2015). To investigate this, we fed piglets either with cow milk or let them feed from sow's milk for 4 wk followed by 7 wk of feeding with maize. If miRNAs can be transferred from milk to the bloodstream, we would expect to observe cow-specific miRNAs in the serum of piglets fed cow milk, but not in the piglets that were fed maize. We applied the sensitive computational approach above to detect cow or maize miRNAs in the piglet data. Our positive control data yielded >11,000 cow-specific reads, showing the sensitivity of our method (Fig. 7). In contrast, we observed few cow-specific sequences in the piglets fed cow milk (15 reads) and, surprisingly, the piglets fed maize (21 reads). Since these two numbers are comparable, they likely stem from false positives of our sensitive analysis. In summary, we do not see any evidence of dietary transfer of xenomiRs in either of our controlled animal feeding studies.
FIGURE 7.
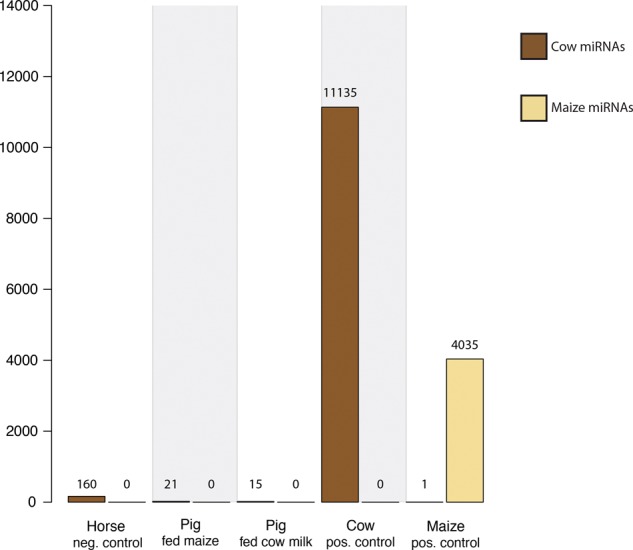
Expression of cow and maize miRNAs. Sequenced RNAs that unambiguously mapped to cow and maize miRNAs were identified and summed up. The samples include sRNAs from horse (negative control), from pigs fed maize and pigs fed cow milk, and from cow and maize (positive control). The number above each bar indicates the number of sequenced RNAs mapping to cow or maize miRNAs.
DISCUSSION
Public sequence repositories represent valuable resources in these times, when generating sequencing data is easier than providing meaningful analyses of the data. We have here analyzed 824 public human data sets for the presence of xenomiRs and have applied numerous analyses to evaluate if xenomiRs originate from diet or contamination. The data sets cover most existing sRNA-seq samples from human body fluids. We find that body fluids contain more xenomiRs than tissues, consistent with a dietary origin. However, we find several lines of evidence that xenomiRs in human samples originate from contamination: (i) XenomiRs are not enriched in tissues that are exposed to dietary intake; (ii) most xenomiRs originate from unlikely food sources like rodent and insect; (iii) xenomiR composition group by study, consistent with batch effects; and (iv) there is no co-occurrence of xenomiRs in CSF and serum from the same human individuals. In addition, we find no evidence of dietary transfer of xenomiRs in our controlled feeding studies in rat and piglet. These results lead us to conclude that dietary transfer of miRNAs into human tissues or body fluids are unlikely to be prevalent in humans.
Interestingly, we do observe a significant difference between the content of xenomiRs in tissues (present in 17% of samples) versus body fluids (present in 69% of samples). We considered possible technical sources of this difference. The standard Illumina protocol for sRNA-seq library preparation requires relatively large amounts of RNA (>1 μg of total RNA). This is easily obtained with tissue samples, but it can be difficult to extract these amounts of RNA from body fluids (Burgos et al. 2013). Therefore, sequencing of small RNAs from body fluids often use lower amounts of input material, in some cases down to 10 ng or 100 µL of input fluids for the RNA extraction (Wang et al. 2012, 2013), and this can be compensated through additional cycles of PCR amplification (Wang et al. 2012). This potentially means that very small amounts of contaminants can be amplified to yield detectable sequence read output.
Although xenomiRs were observed in most body fluid samples, we estimate that the levels are very low, at around 5 miRNA copies per cell (Materials and Methods). These low counts contrast those of individual endogenous miRNAs, which can reach 50,000 copies per cell (Lappalainen et al. 2013). It has been estimated that miRNAs need to be present at around 1000 to 10,000 copies per cell to regulate endogenous transcripts, depending on the miRNA binding strength and prevalence of targets (Denzler et al. 2014). Thus, even if the xenomiRs would be of dietary origin, they would be unlikely to be sufficiently abundant to affect transcripts in the bloodstream. On the other hand, given that the evidence suggests that xenomiRs are contaminants, they are represented by so few sequencing reads that they are unlikely to perturb any computational analyses. Thus, the xenomiRs likely represent trace contaminations that will have no consequences on the conclusions of the studies.
We realize that the numbers of clade-specific miRNAs differ from clade to clade. This reflects incomplete miRNA annotations, but also that some clades have gained more miRNAs than others in evolution (Sempere et al. 2006; Wheeler et al. 2009; Taylor et al. 2014). However, this is unlikely to confound our overall results. In particular, we have good coverage of the plant miRNAs, including MIR168, so the relative paucity of plant sequences in human biofluids cannot be attributed to our annotations. Similarly, we realize that our investigation of xenomiRs in body liquids is biased toward one comprehensive study that included more than half of our serum and CSF samples (study PRJNA241469). However, our main conclusions hold also when these samples are disregarded. Specifically, unlikely animal food sources such as insect and lophotrochozoa still dominate, while fish and bird xenomiRs are rare. Importantly, the samples still group according to the studies, suggesting batch effects. This shows that our conclusions are robust to the exclusion of particular studies.
In summary, our data support a technical rather than dietary origin of human xenomiRs. We have made the processed sequences from the data sets available, so that other researchers can extend our research. In addition, we hope that the >800 data sets, processed uniformly with a standardized pipeline, can function as a resource for the wider research community, for instance in the field of biomarker discovery.
MATERIALS AND METHODS
Sequencing data collection
GSE accession numbers were collected from NCBI GEO database using the searching strategy “((“micrornas”[MeSH Terms] OR miRNA[All Fields]) AND “Non-coding RNA profiling by high-throughput sequencing”[All Fields]) AND “Homo sapiens”[porgn]” (271 GSE IDs, 5958 sequencing data sets, 12/08/2015). According to the GSE IDs, the metadata of contained data sets (XML format) were queried using esearch and efetch from Entrez Direct v 2.50 (Kans 2011). Using bash regular expression pattern, 823 samples (from 49 GSE IDs) that originate from human blood, liver, and brain and sequenced on an Illumina platform were selected and downloaded from the Sequence Read Archive (SRA) FTP site. It is important to note that SRA data sets in this case could be any type of sequencing data such as sRNA-seq, RNA-seq, ChIP-seq, etc. An extra 395 sRNA-seq data sets on serum and CSF samples with BioProject ID PRJNA241469 (Burgos et al. 2014) were downloaded from NCBI dbGaP. In total, 1218 data sets were collected.
De novo 3′ adapter identification
The SRA format data sets were converted to FASTQ files using fastq-dump with option --split-3 from SRA Toolkit v 2.3.5. The paired-end reads were split into two FASTQ files with corresponding suffix _1.fastq and _2.fastq, while single reads were extracted into one FASTQ file. According to the file name, 75 paired-end sequencing data sets were removed. Since 3′ adapter sequences were not always provided together with FASTQ files and trimming the right adapter sequence is essential for the later efficient miRNA identification, all the remaining FASTQ files were processed for 3′ adapter identification using our in-house script in the following manner: Each FASTQ file was converted to FASTA file with collapsing duplicate reads to speed up later processing. Homo sapiens mature miRNA sequences from miRBase v 21 were mapped to the reads of each FASTA file considering all the perfect alignment using bowtie v 1.1.0. The 8 nucleotides (nt) subsequent to the aligned location in the FASTA reads were recorded and the most frequently appearing 8-mer was assigned as potential 3′ adapter sequence for that file. Besides determining the 3′ adapter sequences, the most abundant 8-mer can also approximately represent the number of miRNA reads profiled in that file.
Selection of sRNA-seq data
To exclude other types of sequencing data such as RNA-seq data, the abundance and sequences of the identified 3′ adapter were used as two filtering parameters. First, the file that has less than 100,000 identified 3′ adapter sequences (artificial cutoff) was excluded. The other types of libraries are not designed to capture miRNAs and unlikely to have a large amount of miRNA reads and the commonly used 3′ adapter sequence for sRNA-seq. Although some sRNA-seq data sets with low miRNA content might be discarded as well, these data sets are less likely to ensure a good representation of the eukaryotic small transcriptome. Second, among all the identified 3′ adapter sequences, only the data sets (n = 824) with the commonly used sRNA-seq 3′ adapter sequences (first 8-mer: TGGAATTCT, TCGTATGCC, ATCTCGTAT, AGATCGGA) were selected, as they are most likely to be sRNA-seq data (Supplemental Table 1).
sRNA-seq quality control
The raw files of these sRNA-seq data sets were processed applying the same quality control pipeline. The low quality, low complexity reads were removed using FASTX-Toolkit and custom script. The remaining reads were processed to check whether they contained the 3′ adapter sequence (8-mer) using regular expression of the Python programming language. For each adapter recognized read, the last appearing 8-mer together with subsequent nucleotides was trimmed. Reads shorter than 18 nt after adapter removal were discarded, since they are too short to be unambiguously traced back to reference sequences. The reads passing these quality control filters were collapsed to a FASTA file (Supplemental source) where the number after “_x” in the ID field indicates the read abundance. The FASTA files were used for miRNA expression analysis and clade-specific miRNA identification.
miRNA expression analysis
miRNA expression analysis was performed using Miraligner from Seqbuster (Pantano et al. 2010) with the Homo sapiens precursor miRNA (pre-miRNA) sequences and mature miRNA locations from miRBase v18 as reference. Briefly, the collapsed reads of each FASTA file were mapped to pre-miRNA sequences with allowing one mismatch (miraligner option -sub 1). Pre-miRNA and mature miRNA can be modified by extension, trimming, and substitution of nucleotides, resulting in distinct mature miRNA isoforms that have variations with respect to the reference sequences from miRBase (Ameres and Zamore 2013). The reads were also allowed to trim three nucleotides (-trim 3) or add one additional nucleotide (-add 1) in either the 3′ or 5′ end to reach the highest amount of alignments to pre-miRNA sequences. The miRNA expression matrix of 824 samples × 1787 known miRNAs (Supplemental Table 4) was generated by counting the number of reads that aligned to each annotated mature miRNA location on pre-miRNA.
Clade-specific miRNA identification and counting
According to the previous curated clade-specific miRNA family numbers (Supplemental Table 2), the reference catalog of clade-specific miRNA sequences was extracted from miRBase v21 by selecting the mature miRNAs with ID containing the family numbers using regular expression of the Perl programing language. For instance, the primate 1200 family yields two sequences with miRBase ID hsa-miR-1200 and ppy-miR-1200. A read was identified as a clade-specific miRNA read and assigned to the corresponding family such as primate_1200 if its first 20 nt are matched to the first 20 nt of the reference sequences. By counting how many reads were assigned to each family, we obtained a family matrix, including 129 clade-specific miRNA families from 16 clades × 824 samples (Supplemental Table 5). By further summing up the counts from the same clade, we got a clade matrix, including 16 clades × 824 samples (Supplemental Table 6). Note that we discarded the nematode miRNAs that were detected in samples from Bioproject PRJNA241469, where the nematode miRNAs were spiked in on purpose to normalize the human miRNA abundance. The two count matrixes were used to generate Figures 2, 3. A summary table showing the total number of raw reads, human miRNA, primate-specific miRNA, and exogenous clade-specific miRNA counts can be found in Supplemental Table 3.
Statistical analysis
The associations between the presence of xenomiRs or primate miRNAs with biological origins, study year, or sample types were evaluated with likelihood-ratio χ2 test using loglm() function from MASS package in R v 3.1.1 (R Development Core Team 2010). If the χ2 test revealed a strong relationship between multiple variables (n > 2) and outcomes, the partitioning analysis was further used to resolve which variable is associated. Since xenomiR counts were continuous variables and skewed distributed, we applied the Wilcoxon rank sum test for the comparisons that involved xenomiR abundance in different conditions; for instance, if xenomiR counts are different in body fluid versus tissue samples, we use wilcox.text() function in R. To test whether the hierarchically clustered samples are randomly distributed and whether the xenomiRs from each clade are randomly present across samples, we applied a permutation test, where the sample IDs were randomly shuffled 1000 times to get the sampling distribution of test statistics. The ranking of the real test statistic among the shuffled test statistic gives a P-value. A small P-value is assigned if the real test statistic is beyond or located to the tails of the distribution.
Principal component analysis
The counts in the family matrix (Supplemental Table 5) and the clade matrix (Supplemental Table 6) were first normalized to reads per million (RPM) for each sample.
where cr,s is the raw counts of clade-specific family r (ranged from 1 to 129) or clade r (ranged from 1 to 16) for sample s, cs represents the total number of endogenous human miRNA counts estimated by seqbuster (see section “miRNA Expression Analysis”) for sample s, nr,s is RPM of clade-specific family or clade r that normalized to endogenous miRNA counts for sample s. In order to get a clear pattern of sample grouping, the nr,s is further logarithm-transformed to log10(nr,s+1).
The principal component analysis (PCA) of primate-specific miRNA families was performed on a subset of the normalized matrix including 41 primate-specific miRNA families × 432 body fluid samples, using the prcomp() function in R v 3.1.1. The sample points were projected in a subspace formed by the first and second principal components that explained 27.3% of the variability. The sample points were colored based on the study (Fig. 5A) and the sample biological origins (Fig. 5B). The count matrix of xenomiR families was much sparser than the corresponding primate matrix, containing many zero values. Therefore we summed up the xenomiR family counts of families belonging to the same clade, and performed the PCA on the clade matrix including 15 non-primate clades × 296 body fluid samples (Fig. 5C,D). Four outliers were removed, including GSE34891_serum_A10, GSE59565_serum_ C83, PRJNA241469_CSF_C22, and PRJNA241469_CSF_B13.
Animal feeding studies
Two different animal experimental designs were examined in this paper. The experiments were conducted in two different animal facilities. All studies were performed according to animal ethical approval and current Danish legislation. The rat experiments were conducted at Glostrup Research Institute and included male Sprague-Dawley rats weighing 300 g and randomly divided into three groups (n = 3 in each group). In the first 7 d of the experiment, the two groups had access to both regular chow and either boiled potatoes or boiled rice. The next 28 d, they were given exclusively either potatoes or rice ad libitum. As control group, three rats were fed with regular chow for 35 d (#1320, Brogaarden). Rats were anesthetized by subcutaneous injection with 2.5 mL/kg of a mixture of Hypnorm–Midazolam (1:1:2) in sterile water (containing 0.079 mg/mL fentanyl, 2.50 mg/mL fluansion, Hypnorm, VetaPharma Ltd. and 1.25 mg/mL, Midazolam “Hameln”). Rats were drained for blood by punctuation of the ophthalmic venous plexus into a VacutainerSST II Advance (BD, Becton, Dickinson and Company). The piglet experiments were conducted on three female crossbred pigs (Durox × Danish landrace × Yorkshire). The piglets were weaned at 28 d of age, and then transferred to a formulated diet for 5 d (detailed in Lykke et al. 2013). After this acclimatization, the piglets were fed a pure maize diet for 49 d. In another pig experiment, three newborn piglets were kept on a bovine milk based diet for 26 d. The first 5 d, the piglets were given parenteral nutrition via the umbilical cord and bovine colostrum via an esophageal catheter. For details, the reader is referred to Andersen et al. (2016). During the 5 d, the piglets were gradually transferred to an enteral diet of bovine milk and kept on this for 21 d. Blood was collected and serum was prepared as described below.
Feeding study preparation of serum samples and RNA extraction
After coagulation for 30 min at room temperature, the blood was centrifuged at 2000g for 10 min at 4°C, and serum was collected and stored at −80°C until RNA extraction. Serum (250 µL) was centrifuged at 1000g for 5 min at 4°C. Supernatant serum (200 μL) was used for RNA extraction. QiaZol and chloroform were added to the serum, and total RNA was extracted using the Qiagen miRNeasy Mini Kit (QIAGEN). The general instructions from the manufacturer were followed with a minor addition. We added three washes with the supplied RPE wash buffer instead of ×2 and eluted in 40 µL.
Feeding study library preparation and sRNA sequencing
Extracted total serum RNA from the two different animal models was concentrated in a speedvac to a final volume of 10 µL. From this 5µL was used as the input in the libraries, which were prepared accordingly with TruSeq Small RNA Sample Preparation kit (Illumina). There was made one modification to the Illumina protocol, since we increased the number of PCR cycles from 11 to 16 for total RNA with a 1 µg as the starting material. Additionally, we applied TruSeq SR Cluster Kit v3 for cluster generation, and furthermore, for sequencing, TruSeq SBS Kit v3 was applied. Both were used according to the instructions. sRNA sequencing was conducted on an Illumina HiSeq2000 instrument at the core facility at the Centre for Genomic Regulation (CRG). We sequenced libraries as 50-bp single-end with a total fragment size of ∼150 bp reads. Base calling and quality score calculation was performed from raw intensities using Illumina's pipeline version 1.8.1.
Feeding study sRNA preprocessing and analysis
The sensitive sequence analyses applied to the feeding study data were as follows. The called rat and pig reads were trimmed with the command line: fastx_trimmer -f 1 -l 36 and low-quality reads discarded with fastx_artifacts_filter using the options -q 10 -p 50 (http://hannonlab.cshl.edu/fastx_toolkit/). Adapters were clipped using the AdRec.jar program from the Seqbuster suite with the following options: java -jar AdRec.jar 1 8 0.3. A custom search subsequently clipped shorter adapters: If there were no matches to the first 8 nt, then matches to the first 7 nt of the adapter were searched in the last 7 nt of the read, then matches of the first six to the last six positions and so on. Reads that had no matches were retained, but not clipped. Last, reads shorter than 18 nt were discarded. The nine rat data sets were analyzed with public Arabidopsis thaliana (SRR404277), potato (SRR1035231), and rice (SRR037746) sRNA-seq data, which served as controls. Each data set was mapped against the full set of miRBase miRNA precursor hairpins (version 20), using bowtie with the following options: bowtie -f -v 0 -m 1. Only reads mapping unambiguously to a single hairpin were considered, and the ones that mapped in this manner to rat, rice, or potato hairpins were identified and summed up. The two pig data sets were supplemented with public data sets from horse (SRR871532), cow (SRR3993674), and maize (SRR2089715), which served as negative, positive, and positive controls, respectively. For each data set, reads likely originating from pig were first identified and removed, by mapping against the pig genome (Sscrofa10.2) with the following options: bowtie -f -v 1 -k 1 Sscrofa10.2. Next, the remaining reads were mapped against the miRBase hairpins (version 21) with these options: bowtie -f -v 0 -m 1. As with the rat analysis, only reads mapping unambiguously to the cow and maize hairpins were considered as high confidence cow and maize miRNAs.
Estimating miRNA copies per cell
We assume that a mammalian cell contains around 100,000 endogenous miRNA molecules per cell (Calabrese et al. 2007). We then estimate the number of copies of an individual miRNA as: TPM (transcripts per million) × 100,000/1,000,000.
DATA DEPOSITION
Raw reads in the form of fastq files from the animal feeding studies have been stored in Gene Expression Omnibus GEO under accession number GSE92897. Furthermore, the processed sequence data from human tissue and body fluid in the form of fasta files can be downloaded from https://figshare.com/s/36e1c536a573011e4248.
SUPPLEMENTAL MATERIAL
Supplemental material is available for this article.
Supplementary Material
ACKNOWLEDGMENTS
Wenjing Kang and Marc R. Friedländer acknowledge funding from the Swedish Research Council and from the Strategic Research Area program of the Swedish Research Council through Stockholm University. Expenses for piglet experimentation were covered via the NEOMUNE program, the Danish Council for Strategic Research. Anna J.S. Houben was funded as a Marie Curie postdoctoral fellow supported by the European Commission 7th Framework Program under grant agreement no. 330133. The computations were performed on resources provided by SNIC through Uppsala Multidisciplinary Center for Advanced Computational Science (UPPMAX) under Project SNIC b2015182. We are grateful to Kevin Peterson from Dartmouth College for advice on the clade-specific miRNAs, and we thank Claudia Kutter from the Karolinska Institute for her constructive comments on the manuscript.
Footnotes
Article is online at http://www.rnajournal.org/cgi/doi/10.1261/rna.059725.116.
Freely available online through the RNA Open Access option.
REFERENCES
- Akey JM, Biswas S, Leek JT, Storey JD. 2007. On the design and analysis of gene expression studies in human populations. Nat Genet 39: 807–808; author reply 808–809. [DOI] [PubMed] [Google Scholar]
- Ameres SL, Zamore PD. 2013. Diversifying microRNA sequence and function. Nat Rev Mol Cell Biol 14: 475–488. [DOI] [PubMed] [Google Scholar]
- Andersen AD, Sangild PT, Munch SL, van der Beek EM, Renes IB, Ginneken Cv, Greisen GO, Thymann T. 2016. Delayed growth, motor function and learning in preterm pigs during early postnatal life. Am J Physiol Regul Integr Comp Physiol 310: R481–R492. [DOI] [PubMed] [Google Scholar]
- Auerbach A, Vyas G, Li A, Halushka M, Witwer K. 2016. Uptake of dietary milk miRNAs by adult humans: a validation study. F1000Res 5: 721. [DOI] [PMC free article] [PubMed] [Google Scholar]
- Baier SR, Nguyen C, Xie F, Wood JR, Zempleni J. 2014. MicroRNAs are absorbed in biologically meaningful amounts from nutritionally relevant doses of cow milk and affect gene expression in peripheral blood mononuclear cells, HEK-293 kidney cell cultures, and mouse livers. J Nutr 144: 1495–1500. [DOI] [PMC free article] [PubMed] [Google Scholar]
- Boudreau RL, Rodríguez-Lebrón E, Davidson BL. 2011. RNAi medicine for the brain: progresses and challenges. Hum Mol Genet 20: R21–R27. [DOI] [PMC free article] [PubMed] [Google Scholar]
- Burgos KL, Javaherian A, Bomprezzi R, Ghaffari L, Rhodes S, Courtright A, Tembe W, Kim S, Metpally R, Van Keuren-Jensen K. 2013. Identification of extracellular miRNA in human cerebrospinal fluid by next-generation sequencing. RNA 19: 712–722. [DOI] [PMC free article] [PubMed] [Google Scholar]
- Burgos K, Malenica I, Metpally R, Courtright A, Rakela B, Beach T, Shill H, Adler C, Sabbagh M, Villa S, et al. 2014. Profiles of extracellular miRNA in cerebrospinal fluid and serum from patients with Alzheimer's and Parkinson's diseases correlate with disease status and features of pathology. PLoS One 9: e94839. [DOI] [PMC free article] [PubMed] [Google Scholar]
- Byron SA, Van Keuren-Jensen KR, Engelthaler DM, Carpten JD, Craig DW. 2016. Translating RNA sequencing into clinical diagnostics: opportunities and challenges. Nat Rev Genet 17: 257–271. [DOI] [PMC free article] [PubMed] [Google Scholar]
- Calabrese JM, Seila AC, Yeo GW, Sharp PA. 2007. RNA sequence analysis defines Dicer's role in mouse embryonic stem cells. Proc Natl Acad Sci 104: 18097–18102. [DOI] [PMC free article] [PubMed] [Google Scholar]
- Chen X, Ba Y, Ma L, Cai X, Yin Y, Wang K, Guo J, Zhang Y, Chen J, Guo X, et al. 2008. Characterization of microRNAs in serum: a novel class of biomarkers for diagnosis of cancer and other diseases. Cell Res 18: 997–1006. [DOI] [PubMed] [Google Scholar]
- Denzler R, Agarwal V, Stefano J, Bartel DP, Stoffel M. 2014. Assessing the ceRNA hypothesis with quantitative measurements of miRNA and target abundance. Mol Cell 54: 766–776. [DOI] [PMC free article] [PubMed] [Google Scholar]
- Dickinson B, Zhang Y, Petrick JS, Heck G, Ivashuta S, Marshall WS. 2013. Lack of detectable oral bioavailability of plant microRNAs after feeding in mice. Nat Biotechnol 31: 965–967. [DOI] [PubMed] [Google Scholar]
- Fabris L, Calin GA. 2016. Circulating free xeno-microRNAs—the new kids on the block. Mol Oncol 10: 503–508. [DOI] [PMC free article] [PubMed] [Google Scholar]
- Fiedler LA. 1990. Rodents as a food source. In Proceedings of the Fourteenth Vertebrate Pest Conference, p. 30, University of California, Davis. [Google Scholar]
- Freedman JE, Gerstein M, Mick E, Rozowsky J, Levy D, Kitchen R, Das S, Shah R, Danielson K, Beaulieu L, et al. 2016. Diverse human extracellular RNAs are widely detected in human plasma. Nat Commun 7: 11106. [DOI] [PMC free article] [PubMed] [Google Scholar]
- Fromm B, Billipp T, Peck LE, Johansen M, Tarver JE, King BL, Newcomb JM, Sempere LF, Flatmark K, Hovig E, et al. 2015. A uniform system for the annotation of vertebrate microRNA genes and the evolution of the human microRNAome. Annu Rev Genet 49: 213–242. [DOI] [PMC free article] [PubMed] [Google Scholar]
- Ha M, Kim VN. 2014. Regulation of microRNA biogenesis. Nat Rev Mol Cell Biol 15: 509–524. [DOI] [PubMed] [Google Scholar]
- Holm A, Bang-Berthelsen CH, Knudsen S, Kornum BR, Modvig S, Jennum P, Gammeltoft S. 2014a. miRNA profiles in plasma from patients with sleep disorders reveal dysregulation of miRNAs in narcolepsy and other central hypersomnias. Sleep 37: 1525–1533. [DOI] [PMC free article] [PubMed] [Google Scholar]
- Holm A, Bang-Berthelsen CH, Knudsen S, Modvig S, Kornum BR, Gammeltoft S, Jennum PJ. 2014b. MiRNA profiles in cerebrospinal fluid from patients with central hypersomnias. J Neurol Sci 347: 199–204. [DOI] [PubMed] [Google Scholar]
- Izumi H, Tsuda M, Sato Y, Kosaka N, Ochiya T, Iwamoto H, Namba K, Takeda Y. 2015. Bovine milk exosomes contain microRNA and mRNA and are taken up by human macrophages. J Dairy Sci 98: 2920–2933. [DOI] [PubMed] [Google Scholar]
- Jung M, Schaefer A, Steiner I, Kempkensteffen C, Stephan C, Erbersdobler A, Jung K. 2010. Robust microRNA stability in degraded RNA preparations from human tissue and cell samples. Clin Chem 56: 998–1006. [DOI] [PubMed] [Google Scholar]
- Kans J. 2011. Entrez direct: E-utilities on the UNIX command line. Curr Top Med Chem 11: 2171–2179.21671877 [Google Scholar]
- Kircher M, Sawyer S, Meyer M. 2012. Double indexing overcomes inaccuracies in multiplex sequencing on the Illumina platform. Nucleic Acids Res 40: e3. [DOI] [PMC free article] [PubMed] [Google Scholar]
- Landgraf P, Rusu M, Sheridan R, Sewer A, Iovino N, Aravin A, Pfeffer S, Rice A, Kamphorst AO, Landthaler M, et al. 2007. A mammalian microRNA expression atlas based on small RNA library sequencing. Cell 129: 1401–1414. [DOI] [PMC free article] [PubMed] [Google Scholar]
- Lappalainen T, Sammeth M, Friedlander MR, ‘t Hoen PA, Monlong J, Rivas MA, Gonzalez-Porta M, Kurbatova N, Griebel T, Ferreira PG, et al. 2013. Transcriptome and genome sequencing uncovers functional variation in humans. Nature 501: 506–511. [DOI] [PMC free article] [PubMed] [Google Scholar]
- Laubier J, Castille J, Le Guillou S, Le Provost F. 2015. No effect of an elevated miR-30b level in mouse milk on its level in pup tissues. RNA Biol 12: 26–29. [DOI] [PMC free article] [PubMed] [Google Scholar]
- Leek JT. 2014. svaseq: removing batch effects and other unwanted noise from sequencing data. Nucleic Acids Res 42 10.1093/nar/gku864 [DOI] [PMC free article] [PubMed] [Google Scholar]
- Li J, Zhang Y, Li D, Liu Y, Chu D, Jiang X, Hou D, Zen K, Zhang CY. 2015. Small non-coding RNAs transfer through mammalian placenta and directly regulate fetal gene expression. Protein Cell 6: 391–396. [DOI] [PMC free article] [PubMed] [Google Scholar]
- Liang G, Zhu Y, Sun B, Shao Y, Jing A, Wang J, Xiao Z. 2014. Assessing the survival of exogenous plant microRNA in mice. Food Sci Nutr 2: 380–388. [DOI] [PMC free article] [PubMed] [Google Scholar]
- Liang H, Zhang S, Fu Z, Wang Y, Wang N, Liu Y, Zhao C, Wu J, Hu Y, Zhang J, et al. 2015. Effective detection and quantification of dietetically absorbed plant microRNAs in human plasma. J Nutr Biochem 26: 505–512. [DOI] [PubMed] [Google Scholar]
- Lykke M, Hother AL, Hansen CF, Friis H, Molgaard C, Michaelsen KF, Briend A, Larsen T, Sangild PT, Thymann T. 2013. Malnutrition induces gut atrophy and increases hepatic fat infiltration: studies in a pig model of childhood malnutrition. Am J Transl Res 5: 543–554. [PMC free article] [PubMed] [Google Scholar]
- Mitchell PS, Parkin RK, Kroh EM, Fritz BR, Wyman SK, Pogosova-Agadjanyan EL, Peterson A, Noteboom J, O'Briant KC, Allen A, et al. 2008. Circulating microRNAs as stable blood-based markers for cancer detection. Proc Natl Acad Sci 105: 10513–10518. [DOI] [PMC free article] [PubMed] [Google Scholar]
- Munch EM, Harris RA, Mohammad M, Benham AL, Pejerrey SM, Showalter L, Hu M, Shope CD, Maningat PD, Gunaratne PH, et al. 2013. Transcriptome profiling of microRNA by Next-Gen deep sequencing reveals known and novel miRNA species in the lipid fraction of human breast milk. PLoS One 8: e50564. [DOI] [PMC free article] [PubMed] [Google Scholar]
- Pantano L, Estivill X, Marti E. 2010. SeqBuster, a bioinformatic tool for the processing and analysis of small RNAs datasets, reveals ubiquitous miRNA modifications in human embryonic cells. Nucleic Acids Res 38: e34. [DOI] [PMC free article] [PubMed] [Google Scholar]
- Pardridge WM. 2005. The blood-brain barrier: bottleneck in brain drug development. NeuroRx 2: 3–14. [DOI] [PMC free article] [PubMed] [Google Scholar]
- Philip A, Ferro VA, Tate RJ. 2015. Determination of the potential bioavailability of plant microRNAs using a simulated human digestion process. Mol Nutr Food Res 59: 1962–1972. [DOI] [PubMed] [Google Scholar]
- R Development Core Team. 2010. R: a language and environment for statistical computing. R Foundation for Statistical Computing, Vienna, Austria. [Google Scholar]
- Schwarzenbach H, Nishida N, Calin GA, Pantel K. 2014. Clinical relevance of circulating cell-free microRNAs in cancer. Nat Rev Clin Oncol 11: 145–156. [DOI] [PubMed] [Google Scholar]
- Sempere LF, Cole CN, McPeek MA, Peterson KJ. 2006. The phylogenetic distribution of metazoan microRNAs: insights into evolutionary complexity and constraint. J Exp Zool B Mol Dev Evol 306: 575–588. [DOI] [PubMed] [Google Scholar]
- Simonson B, Das S. 2015. MicroRNA therapeutics: the next magic bullet? Mini Rev Med Chem 15: 467–474. [DOI] [PMC free article] [PubMed] [Google Scholar]
- Snow JW, Hale AE, Isaacs SK, Baggish AL, Chan SY. 2013. Ineffective delivery of diet-derived microRNAs to recipient animal organisms. RNA Biol 10: 1107–1116. [DOI] [PMC free article] [PubMed] [Google Scholar]
- Taylor RS, Tarver JE, Hiscock SJ, Donoghue PC. 2014. Evolutionary history of plant microRNAs. Trends Plant Sci 19: 175–182. [DOI] [PubMed] [Google Scholar]
- Title AC, Denzler R, Stoffel M. 2015. Uptake and function studies of maternal milk-derived microRNAs. J Biol Chem 290: 23680–23691. [DOI] [PMC free article] [PubMed] [Google Scholar]
- Tosar JP, Rovira C, Naya H, Cayota A. 2014. Mining of public sequencing databases supports a non-dietary origin for putative foreign miRNAs: underestimated effects of contamination in NGS. RNA 20: 754–757. [DOI] [PMC free article] [PubMed] [Google Scholar]
- U.S. Food and Drug Administration. Defect Levels Handbook. Vol. 2016. [Google Scholar]
- Wang K, Li H, Yuan Y, Etheridge A, Zhou Y, Huang D, Wilmes P, Galas D. 2012. The complex exogenous RNA spectra in human plasma: an interface with human gut biota? PLoS One 7: e51009. [DOI] [PMC free article] [PubMed] [Google Scholar]
- Wang K, Yuan Y, Li H, Cho JH, Huang D, Gray L, Qin S, Galas DJ. 2013. The spectrum of circulating RNA: a window into systems toxicology. Toxicol Sci 132: 478–492. [DOI] [PubMed] [Google Scholar]
- Weber JA, Baxter DH, Zhang S, Huang DY, Huang KH, Lee MJ, Galas DJ, Wang K. 2010. The microRNA spectrum in 12 body fluids. Clin Chem 56: 1733–1741. [DOI] [PMC free article] [PubMed] [Google Scholar]
- Wheeler BM, Heimberg AM, Moy VN, Sperling EA, Holstein TW, Heber S, Peterson KJ. 2009. The deep evolution of metazoan microRNAs. Evol Dev 11: 50–68. [DOI] [PubMed] [Google Scholar]
- Winther TN, Bang-Berthelsen CH, Heiberg IL, Pociot F, Hogh B. 2013. Differential plasma microRNA profiles in HBeAg positive and HBeAg negative children with chronic hepatitis B. PLoS One 8: e58236. [DOI] [PMC free article] [PubMed] [Google Scholar]
- Witwer KW, McAlexander MA, Queen SE, Adams RJ. 2013. Real-time quantitative PCR and droplet digital PCR for plant miRNAs in mammalian blood provide little evidence for general uptake of dietary miRNAs: limited evidence for general uptake of dietary plant xenomiRs. RNA Biol 10: 1080–1086. [DOI] [PMC free article] [PubMed] [Google Scholar]
- Wolff JO, Sherman PW. 2008. Rodent societies: an ecological and evolutionary perspective. University of Chicago Press, Chicago, IL. [Google Scholar]
- Zhang L, Hou D, Chen X, Li D, Zhu L, Zhang Y, Li J, Bian Z, Liang X, Cai X, et al. 2012. Exogenous plant MIR168a specifically targets mammalian LDLRAP1: evidence of cross-kingdom regulation by microRNA. Cell Res 22: 107–126. [DOI] [PMC free article] [PubMed] [Google Scholar]
- Zhou Z, Li X, Liu J, Dong L, Chen Q, Liu J, Kong H, Zhang Q, Qi X, Hou D, et al. 2015. Honeysuckle-encoded atypical microRNA2911 directly targets influenza A viruses. Cell Res 25: 39–49. [DOI] [PMC free article] [PubMed] [Google Scholar]
Associated Data
This section collects any data citations, data availability statements, or supplementary materials included in this article.