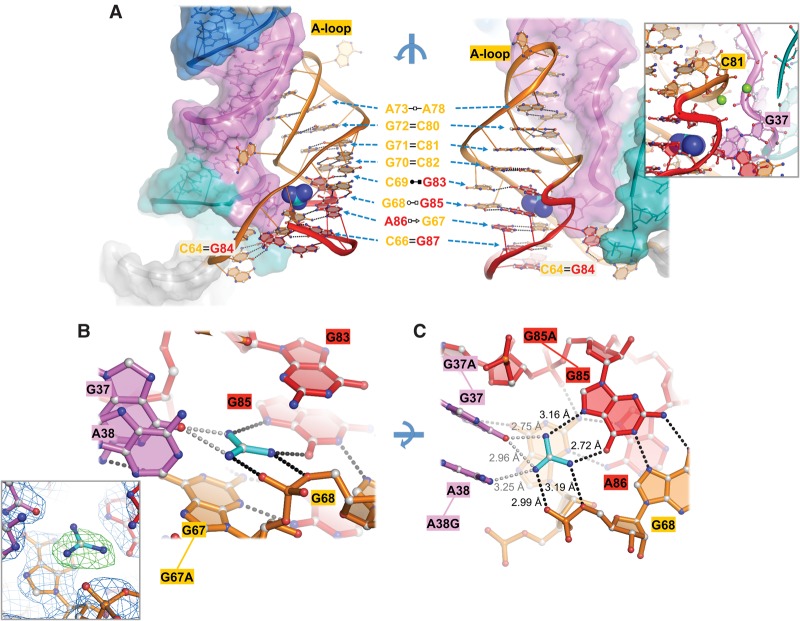
FIGURE 3.
Guanidinium recognition in the binding pocket. (A) Front (right) and rear (left) views of Dda_ykkC P3 stem. Base pairs are detailed with Leontis–Westhof notation in the middle with arrows indicating the location of the pair in front and rear views. Inset shows magnesium ions coordinated by the P1 and P3 backbones. (B) Side view of the binding pocket showing cation–π stacking interaction between guanidinium (cyan) and G67 (orange). Inset shows omit-map electron density of the binding pocket at 1.5 σ generated by simulated annealing refinement. Black dashes represent hydrogen bonds. Gray dashes represent weak electrostatic interactions. (C) Top view of the binding pocket showing hydrogen-bonding network. Mutants designed for binding affinity experiments are connected by lines to their corresponding residue labels. Interatomic distances are given next to dashes.

