

Following transfection of aquaporin into the parotid ducts of minipigs with salivary hypofunction, the resulting increase in salivary flow rates contradicts current understanding of ductal fluid transport. We show that the change in saliva electrochemistry and flow rate can be explained by changes in expression of ion transporters in the ductal cell membranes, using a mathematical model replicating a single parotid duct.
Keywords: parotid duct, aquaporin transfection, membrane transport
Abstract
Previous studies have shown that localized delivery of the aquaporin-1 (AQP1) gene to the parotid duct can restore saliva flow in minipigs following irradiation-induced salivary hypofunction. The resulting flow rate and electrochemistry of secreted saliva contradicts current understanding of ductal fluid transport. We hypothesized that changes in expression of ion transport proteins have occurred following AQP1 transfection. We use a mathematical model of ion and fluid transport across the parotid duct epithelial cells to predict the expression profile of ion transporters that are consistent with the experimental measurements of saliva composition and secretion rates. Using a baseline set of parameters, the model reproduces the data for the irradiated, non-AQP1-transfected case. We propose three scenarios which may have occurred after transfection, which differ in the location of the AQP1 gene. The first scenario places AQP1 within nonsecretory cells, and requires that epithelial sodium channel (ENaC) expression is greatly reduced (1.3% of baseline), and ductal bicarbonate concentration is increased from 40.6 to 137.0 mM, to drive water secretion into the duct. The second scenario introduces the AQP1 gene into all ductal cells. The final scenario has AQP1 primarily in the proximal duct cells which secrete water under baseline conditions. We find the change in the remaining cells includes a 95.8% reduction in ENaC expression, enabling us to reproduce all experimental ionic concentrations within 9 mM. These findings provide a mechanistic basis for the observations and will guide the further development of gene transfer therapy for salivary hypofunction.
NEW & NOTEWORTHY Following transfection of aquaporin into the parotid ducts of minipigs with salivary hypofunction, the resulting increase in salivary flow rates contradicts current understanding of ductal fluid transport. We show that the change in saliva electrochemistry and flow rate can be explained by changes in expression of ion transporters in the ductal cell membranes, using a mathematical model replicating a single parotid duct.
the parotid gland is a major salivary gland which secretes a serous solution of water, ions, and enzymes into the mouth (44). In the gland, the acini are clusters of fluid-secreting cells that produce primary saliva. This fluid is rich in sodium (Na+) and chloride (Cl−), and low in potassium (K+) and bicarbonate (), and is approximately isosmotic to the cells lining the lumen. This fluid travels into the ductal network, where the primary saliva is modified into a final saliva that is hyposmotic to the cells. In contrast to the acinar cells, the majority of the ductal cells are not permeable to water (42). Should the duct cells become water permeable, water is believed to be removed from the lumen and flow into the interstitial space, following the osmotic gradient. However, water secretion has been found to occur within the intercalated ducts which separate the acini from the striated duct, although the striated ductal cells do not transport water (14, 24, 25). Nevertheless, the rate of saliva secretion owing to the ducts is considerably lower than that from the acini (14, 19).
Oral cancers are prevalent worldwide, with 35,000 estimated new cases in the US in 2009, of which 7,600 were fatal (15). Radiotherapy is often the chosen treatment for these cancers. However, following this procedure, patients often report reduced saliva production as many acinar cells are irreversibly destroyed, resulting in lowered secretion of primary saliva (6) and “dry mouth” (9). To alleviate this, a clinical study has found that the vector transduction of the aquaporin isoform AQP1 gene into parotid ductal cells in minipigs has resulted in the partial restoration of secondary saliva production (10), but the mechanism behind this outcome contradicts the current understanding of salivary duct electrochemistry. In particular, it is generally believed that water would leave the hyposmotic duct environment through these new water channels, rather than enter (44). To explain this paradox, we hypothesize that other changes have occurred at the cell level, to enable the seemingly uphill transport of water.
A mathematical model was thus constructed and used to predict the changes that are required to explain why flow rate is partially restored during clinical trials. Currently, there is considerable work done in the mathematical modeling of the acinar cell and the creation of primary saliva (11, 22, 28, 38). However, there are few models of salivary ductal transport. Patterson et al. (31) have constructed such a model of the submandibular duct, but do not account for pH or the transport of water across the ductal cell. As such, there is a need for a new and improved model of salivary ductal fluid transport.
MODEL CONSTRUCTION
Because of the evidence showing that the duct secretes a small amount of water under baseline conditions (14, 25), we model two types of ductal epithelial cells. The secretory cell has properties mimicking the intercalated duct, including the secretion of water into the lumen (Fig. 1). The other cell type is the nonsecretory, water-impermeable cell type of the striated ducts downstream of the secretory cells (Fig. 2). The two cell types differ in the expression levels of the various protein channels in the cell membranes, notably in the presence of aquaporin (AQP) in the secretory cells.
Fig. 1.

Model of a secretory duct cell with components.
Fig. 2.

Model of an impermeable duct cell with components.
For each cell, the model solves for the concentrations of [Na+], [Cl−], [K+], [H+], [], and [CO2] in both the ductal and cell compartments. The cell volume and membrane potentials at both apical and basolateral membranes are also computed, although the interstitial compartment is treated as an infinite bath. Each cell expresses a set of protein channels which transport ions between compartments; the inclusion of the various channels were based on findings from other studies (19, 27, 29). Parameters, such as the channel conductances and densities per unit area, were likewise estimated from experimental data in the literature. When specific data were unavailable, parameters were estimated by requiring reasonable physiological behavior.
To model the duct in the spatial domain, we combine several replicated units of secretory and nonsecretory cell types into a tubular layer of cells with a fluid layer advected over the apical surface. A small segment at the proximal end of the tube (the intercalated duct) contains secretory cells, whereas the remainder of the tube (the striated duct) consists of nonsecretory cells. This models the ductal portion of a “salivary production unit” (SPU), which is a simplified model of the branching tree of ducts found in the physical gland (Fig. 3). With a given input of saliva advected at a certain velocity from the acinus, the model will solve for the spatial profiles of electrolyte concentrations, the cell volumes, and ductal fluid flow rate at the duct terminus.
Fig. 3.

Model of the Saliva Production Unit (SPU). The black ductal cells represent the water-impermeable cell type, whereas the gray cells represent the secretory. All cells are capable of ion transport. Figure is not to scale. [Adapted from Sneyd et al. (38) with permission from Elsevier. Copyright 2014.]
Model Equations
Ionic concentrations in saliva.
The model consists of a single tubular layer of cells forming the duct, which receives primary saliva from the acinus. We solve the transport equation for concentrations of ions in the saliva, which is advected at velocity v across the layer of cells:
| (1) |
for ions n = Na+, Cl−, K+, H+, , and CO2 in the apical (subscript A) and cellular (subscript C) space. RA includes the apical and paracellular ionic fluxes through ion channels of the duct cells.
Ionic concentrations in the cell.
We model the ionic composition of the cells using
| (2) |
where RC includes ionic fluxes across apical and basolateral (subscript B) membranes of a cell of volume wC.
Cell volume.
wC is defined using:
| (3) |
where the water flux Jw is dependent on the osmotic gradients either side of the apical or basolateral membrane.
Luminal fluid velocity.
When AQP is present, water fluxes across ductal cells will alter the final salivary flow rate in the lumen. The volume of the duct was assumed constant. Given the constant cross-sectional area of the duct , the velocity v of saliva is given by:
| (4) |
where is the surface area of the lumen. Each duct cell can contribute two water fluxes into the lumen: the apical membrane flux , and the paracellular flux . Pressure changes were neglected.
For further details of the model, see appendix a.
Numerical method.
The flow composition was solved by spatially discretizing Eq. 1 using an upwind scheme for the advection term, thus reducing the partial differential equation into an ordinary differential equation:
| (5) |
at the jth space step Δx.
The method of lines was selected to solve Eq. 5, given its speed and robustness. That is, we used the first-order finite differencing scheme over space within a time-stepping ODE15S solver in MATLAB.
A Dirichlet boundary condition was used at the acinar end of the duct, where the ductal ion concentrations were equal to that of primary saliva, and cellular concentrations equal to the chosen initial conditions.
Model simplifications.
Diffusion was assumed to be negligible for all ions, as the advective term was found to be several orders of magnitude larger. Pressure terms were also neglected as we assume that changes to pressure within the duct are small, and would not cause major conformational changes. We further simplify the model by having the duct be of constant volume, as any cross-sectional area changes are also assumed to be small.
Tube Dimensions
We model the duct of an SPU according to the dimensions in Table 1. Patterson et al. (31) assumes a duct length of 1,000 µm in the rat submandibular gland; we use an extended length of 5,000 µm for the minipig.
Table 1.
Ductal and fluid flow measurements
| Dimension | Value | Ref. No. |
|---|---|---|
| Total length (), µm | 5,000 | |
| Secretory duct length (), µm | 500 | |
| Tube diameter, µm | 20 | (18, 30) |
| Single cell length, µm | 10 | (40) |
| nD | 6 | (3) |
| nSPU | 3.33 × 10⁸ |
nD refers to the number of cells lining the circumference of the tube, and nSPU is the number of salivary production units employed in the whole model. See text for details.
The diameter for the intercalated duct is around 10 µm, and 20–40 µm in the striated (30, 34); we use an average diameter of 20 µm. nD, the number of cells surrounding the duct, was assumed to be 6. This is consistent with Boshell and Wilborn (3), who state that an average of 4–9 cells surround the intercalated duct.
To equate the output of the SPU to the overall flow of the entire gland as measured in Ref. 10, the total flow must be scaled according to the number of intralobular ducts per gland (nSPU). The parotid gland weighs ~20 g (43), and Gin et al. estimates 108 acinar cells per 100 g of gland (11). We use an average of 6 acinar cells present in one SPU (41), such that there are 3.33 × 10⁶ SPUs in 20 g of parotid gland. We thus multiplied our flow rate by this number. For a zero spatial gradient at the end of the duct, it was found that the number of SPUs needed to be increased 100-fold.
The secretory cell.
It is not clear whether it is either the whole duct, or only a portion of the duct, which is secretory. We assume that the majority of the duct is not involved in water secretion, so that only a small length of the duct is made of secretory cells, beginning at the acinar end. We chose the initial 500 µm to be secretory. It is otherwise implausible that the secretory segment can be longer, or nearer the end of the duct, as water cannot be secreted in these situations following the osmotic gradient. Physically, the secretory cells would be an intermediary cell type of the intercalated duct at the junction of acinar cells that secrete water, with impermeable striated ductal cells.
CLINICAL DATA
Data on changes in saliva composition of minipig parotid glands were presented in Gao et al. (10) at three different stages (see Fig. 4) under unstimulated conditions—in chronological order: 16 wk following irradiation (IR), 4 wk after AQP1 were virally transfected into the gland (A4), and finally at 8 wk following transfection (A8). The flow rates of final saliva at these points were also collected.
Fig. 4.
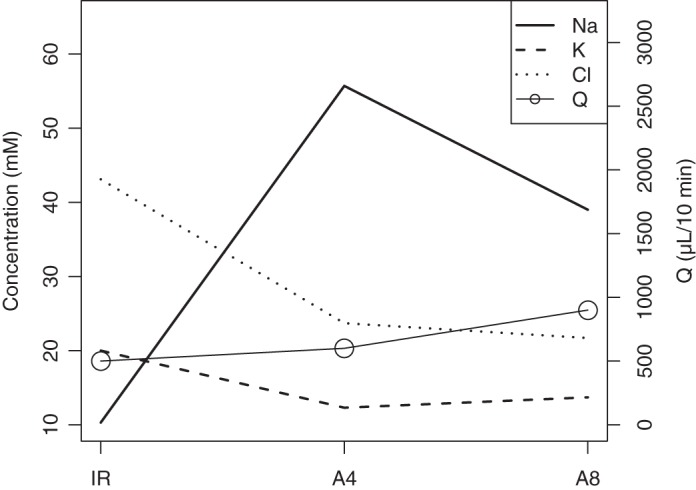
[Na+], [Cl−], and [K+] in minipig parotid gland saliva 16 wk following irradiation (IR), 4 wk following AQP1 transfection (A4), and 8 wk after transfection (A8).
We are interested in monitoring [Na+], [Cl−], and [K+] as well as the parotid flow rates Q from Fig. 4 at the IR and A8 time points, where we assume that the experimental system has reached steady state.
We propose that the presence of AQP1 causes a change in expression of ion channels in the ductal cells, leading to altered ionic absorption and secretion. Essentially, we aim to solve the inverse problem, where known ion concentrations and saliva flow rates at the duct exit are used to solve for the changes to various channel densities that can reproduce this output.
It is a point of contention whether changes to protein expression occurs across all cells identically, or at different levels for secretory and impermeable cells. This hinges on where the AQP1 gene was successfully expressed, following transfection. We theorize that cells will only be induced to change their gene expression of transporter proteins only if the AQP1 gene is present. To match the data at the A8 time point, we are thus interested in predicting the expression of protein transporters in all ductal cells given the following scenarios: 1) AQP1 is added to only the nonsecretory cells. Water permeability in the secretory cells remains unchanged; 2) AQP1 is added to both secretory and nonsecretory ductal cells in equal amounts; and 3) AQP1 is added mostly to the secretory cells, with a low AQP1 expression in nonsecretory cells.
The net flux of ions through each type of transporter in a cell depends on the number of transporters, or the density. Given a turnover rate ν of ions crossing a membrane of unit area per unit time, we calculate:
| (6) |
where, for transporter j, the density α will scale u toward finding the net current I leaving the cell. α can thus be modified to fit the model solution to data, reflecting a change in protein expression.
Preliminary Fitting
We found density values for all transporters in the secretory and nonsecretory cells, to give model solutions which fit clinical data at the IR time point. This acts as our baseline set of densities, which we perturb during the A8 case studies.
There are several combinations of αj that can reproduce the data of Fig. 4, although only a subset of these will meet the requirements for physiological pH in the cell and duct, and result in reasonable cell volume shrinkage when AQP1 are added. In particular, the pH in the cell and the duct needs to be maintained within a range of 7.2–7.4 and 5.3–7.8, respectively (8, 39). The decrease of the cell volume when AQP1 is added should be ~25%, such that it is the same order of magnitude as the parotid acinar cell shrinkage during primary saliva production (28).
The resulting solution of the baseline parameter set is shown in Fig. 5, which compares the model solution for [Na+], [Cl−], and [K+] in the ductal lumen against experimental data. Parameter values are given in appendix b.
Fig. 5.
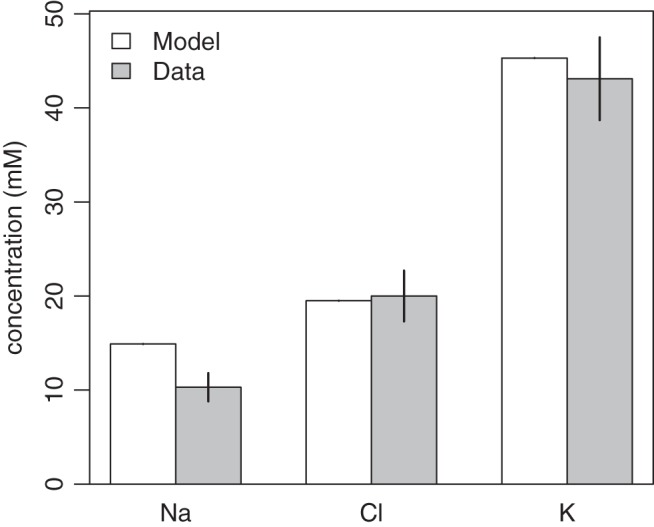
Comparing data from Ref. 10 with the model solution for the IR case for the Na+, Cl−, and K+ in the duct.
The secretory cell.
The transporter expressions in the secretory cell should allow for water secretion. The amount of fluid secreted by the ductal cells is not quantified, but known to be small (14, 19); we assume that the secretory cells contribute to an average of 10% of the total saliva flow rate. From Fig. 4, the total ductal flow rate is Q = 500 µl/10 min. Therefore, the total flow rate at the entrance of the ducts is Q0 = 450 µl/10 min. Per SPU, this is equal to 1.35 pl/10 min. The remaining nonsecretory ductal cells do not contribute to water transport at baseline.
To enable this flow, both apical and basolateral membranes of the secretory cells are made water permeable, with a baseline permeability value of LB = 2.08 × 10⁻⁸ m/s per cell. The resulting osmolarity of the ductal fluid is hence increased from primary saliva levels, to allow for fluid secretion. Once the duct transitions into nonsecretory cells, the net osmolarity of the duct then reduces, leading to the well-known hyposmoticity in the normal case (42).
In general, the requirements for water to be transported into the duct are as follows: 1) the duct fluid osmolarity is higher than the cell, causing water to flow from the cell into the duct according to the osmotic gradient; and 2) water enters basolaterally into the cell, to offset the loss of water from the apical membrane.
Scenario: Striated-Secretion
The densities of transporters in nonsecretory cells are changed from baseline, to result in a model solution in which the ductal fluid is hyperosmotic to the cells. This would allow water secretion into the saliva while meeting the clinical data at A8. Water permeability is hence introduced across the apical (LA) and basolateral (LB) membranes. As the total flow rate increased to Q = 900 µl/10 min (Fig. 4), it is necessary to find appropriate permeability values which can match this value at the end of the duct. The secretory cells are unchanged.
Scenario: Whole-Secretion
We use the same set of αj for all cells as per striated secretion, but the distribution of the AQP1 gene is uniform across all cells, resulting in different water permeability values. Due to additional AQP1 in the secretory cells, the amount of AQP1 in the nonsecretory cells is less than that of striated secretion.
The protein expressions in the secretory cells are unchanged, as it was found that the final solution at the end of the duct is not dependent on upstream ionic concentrations.
Scenario: Intercalated-Secretion
In this instance, we model the AQP1 gene being predominantly expressed in the secretory cells, with minimal expression in the nonsecretory portion. As we rely on the bulk of salivary flow recovery to be performed by the proximally located secretory cells, we remove the requirement that the distal duct needs to be hyperosmotic to the duct. This means that the nonsecretory cell type would undergo a different change in transporter expression, in comparison to the Striated-Secretion and Whole-Secretion scenarios.
Other Cases
We are interested in using the model for other conditions for which there are no data; for instance, the case where saliva has been stimulated. In this case, we assume that the primary saliva is altered, but the transporter and AQP1 expressions are unchanged. We apply the aforementioned three scenarios, with changes to the primary saliva found, to Table 2.
Table 2.
Primary saliva under unstimulated and stimulated conditions
| Unstimulated | Stimulated | |
|---|---|---|
| Na+ | 141.6 | 143.5 |
| Cl− | 112.6 | 114.2 |
| K+ | 5.6 | 5.2 |
| Q | 450.0 | 1,350.0 |
RESULTS
We change the density values from baseline to create a model solution which fits the A8 data. We simultaneously compare the solutions of each scenario in the following section.
For the Striated-Secretion and Whole-Secretion scenarios, we required a model solution which creates a hyperosmotic duct environment that would allow water flow into the ductal lumen. One combination of parameter changes required to achieve this is shown in Fig. 6. We also introduced the NBC transporter on the apical membrane. In whole secretion, there is a complete removal of the basolateral NBC and the basolateral AE2 transporters. The paracellular K+ flux was also removed.
Fig. 6.

Percentage changes in ion channel densities or fluxes from baseline (IR) to each scenario of the A8 state, within nonsecretory cells. S1, Striated-Secretion; S2, Whole-Secretion; S3, Intercalated-Secretion.
The model solution for salivary [Na+], [Cl−], and [K+] concentrations is shown in Fig. 7, compared against data (10). In the Striated-Secretion and Whole-Secretion scenarios, the model presents a much higher [Na+] at 132.3 mM, compared against a value of 39.0 mM from clinical data. In contrast, there is good agreement between the model and the data for [Cl−] and [K+]. There is also an increase in ductal bicarbonate concentration, from the baseline value of 40.6 mM, to 137.0 mM. It is evident that the solution from Intercalated-Secretion meets the clinical data more accurately than the previous scenarios. In this instance, the model solution for [Na+], [Cl−], and [K+] are within 9 mM of the experimentally measured value.
Fig. 7.
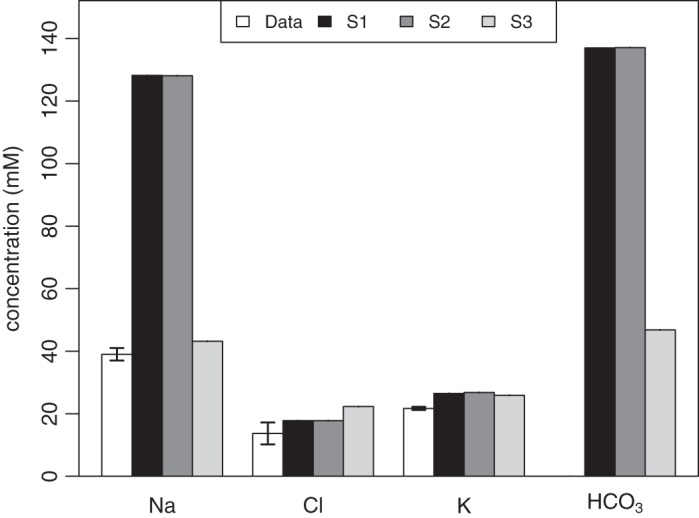
Comparing data from Gao et al. (10) with the model solution for the A8 case for the Na+, Cl−, and K+ in the duct, for each scenario. The model solutions for [] are also included, although experimental data are unavailable for this ion. S1, striated secretion; S2, whole secretion; S3, intercalated secretion.
Figure 8A shows the total osmolarity within the cell and the duct at steady state. In the Striated-Secretion and Whole-Secretion scenarios, the higher ductal osmolarity enabled water to be secreted into the ductal lumen following the osmotic gradient, resulting in the salivary flow rates reaching QS1 = 900.9 µl/10 min and QS2 = 900.1 µl/10 min (Fig. 8B). These were achieved using a basolateral permeability that was 10 times higher than that of the apical membrane, at LB = 1.68 × 10⁻⁷ m/s, and LA = 1.68 × 10⁻⁸ m/s in the nonsecretory cell.
Fig. 8.
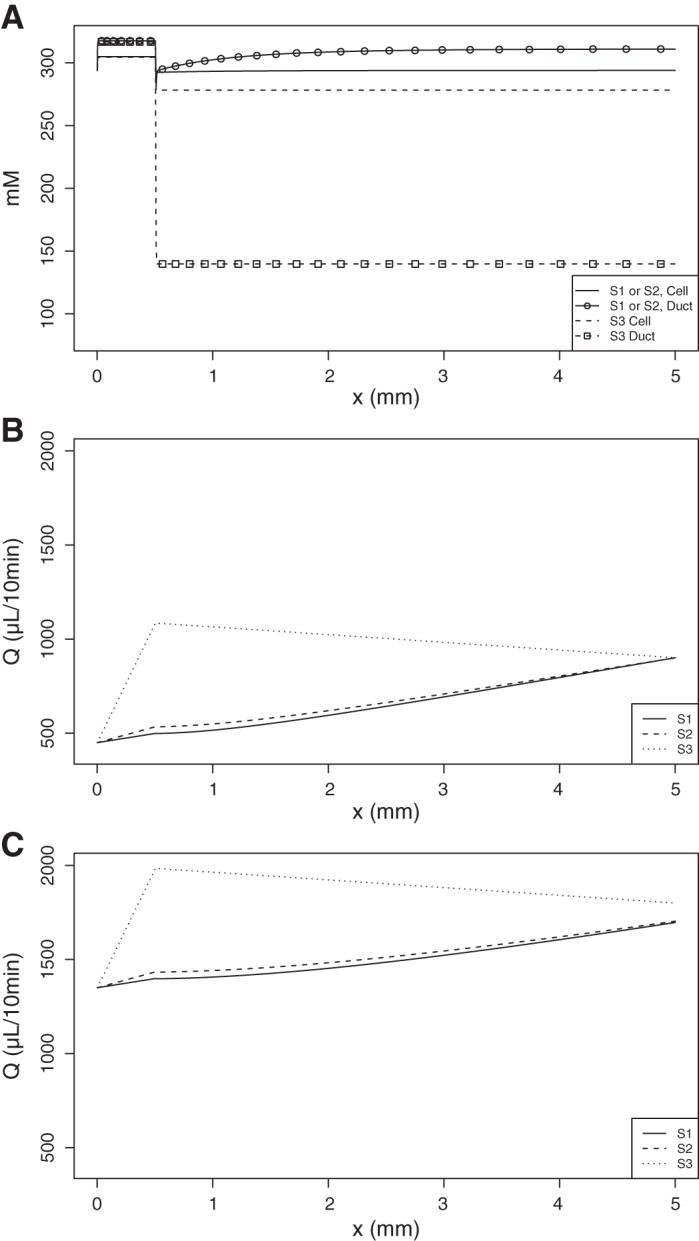
A: the total osmolarities of the ductal and cellular compartments over the length of the duct in all scenarios of the A8 case, in mM. B: salivary flow rate over the length of the duct at steady state, for each scenario, under unstimulated saliva conditions. The end of the secretory cell section occurs at x = 0.5 mm. C: salivary flow rate during stimulated saliva conditions. S1, Striated-Secretion; S2, Whole-Secretion; S3, Intercalated-Secretion.
If the same amount of new AQP1 was expressed in each cell, as per Whole-Secretion, we predict that the change in water permeability of all membranes relative to baseline is equal to ΔL = 1.52 × 10⁻⁸ m/s.
The overall salivary flow rate in Intercalated-Secretion is shown to reach QS3 = 1085.0 µl/10 min at x = , which subsequently decreases upon reaching the nonsecretory cells (Fig. 8, bottom panel) to QS3 = 900.9 µl/10 min. This is explained by the top panel Fig. 8, which shows that the ductal lumen downstream of x = is hyposmotic to the cell. We imposed a water permeability value of = 2.8 × 10⁻⁷ m/s in the secretory cell. The permeability in the basolateral membrane of the nonsecretory cell is at 2.9% of this value, at LB = 8 × 10⁻⁹ m/s.
Under stimulated saliva conditions, it was found that the saliva electrochemistry given by the model is the same as for unstimulated saliva. The flow rate of saliva at the end of the duct is increased (Fig. 8C) for each scenario to QS1 = 1,696.4 µl/10 min, QS2 = 1,703.4 µl/10 min, and QS3 = 1,799.8 µl/10 min.
The changes to the membrane water permeability values in each cell type across the three scenarios are summarized in Fig. 9.
Fig. 9.
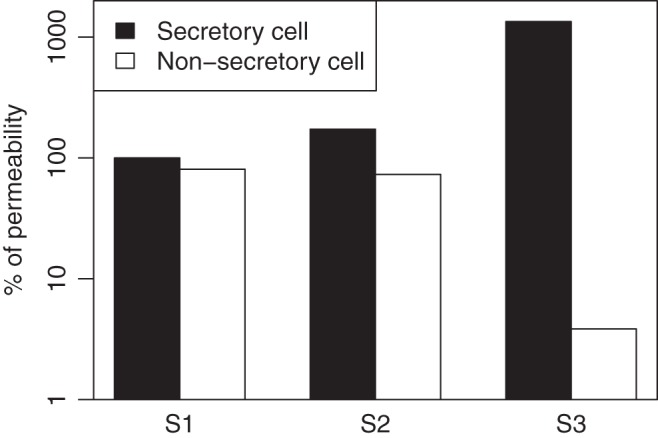
The water permeabilities of the secretory and nonsecretory cells in each scenario, as a percentage of the apical membrane permeability of the secretory cell at IR. S1, Striated-Secretion; S2, Whole-Secretion; S3, Intercalated-Secretion.
DISCUSSION
In the Striated-Secretion and Whole-Secretion scenarios, focus was on the altered expression of the transport of Na+ and , leading to the increased concentration of these ions in the final saliva. Their increases will then cause the duct to be hyperosmotic, greatly increasing water secretion by cells over the length of the duct, to increase the salivary flow rate. In these scenarios, we found that [] was needed to increase by 237.4%, from 40.6 to 137.0 mM. A direct consequence of the high efflux of is that a high positive ion flux will occur in parallel, due to the condition of electroneutrality. We opted for a high [Na+] to fit the trend of the experimental data, although the concentration predicted by the model exceeds the experimental value (Fig. 7).
It can be deduced that if a significant amount of fluid recovery is to be achieved through the previously impermeable ductal cells, the electrochemistry of the required saliva does not match the experimental values perfectly, or the flux of water will occur in the wrong direction as the environment is not hyperosmotic. This implies that there may be changes to other charged species that we have not accounted for, or that the acinar cells have also been changed after AQP1 transfection, thus changing the primary saliva electrochemistry and flow rate. If this were the case, then the increase in flow rate may be attributed to the greater increase in primary saliva flow. It could be the case that the duct cells were not transduced at all.
Striated-Secretion hypothesizes that only nonsecretory cells are transduced; Whole-Secretion states that both cell types are equally transduced. Experimentally, the latter is most likely to have occurred, assuming the cell types are not significantly dissimilar in the transfection and expression of the AQP1 gene.
From the Striated-Secretion and Whole-Secretion scenarios, it can be seen that ductal hyperosmoticity and electroneutrality cannot be satisfied if the experimental data from Gao et al. (10) are to be matched. Therefore, Intercalated-Secretion was investigated an alternative, where most of the AQP1 gene is expressed within the secretory cells of the duct, and only a small amount in the remainder. Figures 7 and 8 demonstrate that both the salivary flow and electrochemistry values are met relatively well for this scenario. The consequence of this theory is that the majority of the duct is hyposmotic, and water will continue to leave the ductal lumen once past the secretory cell portion. There is also a heavy reliance on these secretory cells being present in the duct.
Our results show that the placement of the AQP1 channel is critical. We can deduce that the likeliest locations of gene transfection are within cells toward the proximal end of the duct, whether it be within the ductal or acinar cells. Transfection of the distal duct cells would serve to either decrease the final salivary flow rate after the increase at the acinar end, as per Intercalated-Secretion or depend on a hyperosmotic fluid, as in the Striated-Secretion and Whole-Secretion scenarios.
Our findings show that to meet the experimental data, we unequivocally require a change in the nonsecretory cells following AQP1 transfection. This is evidence that the AQP1 gene will affect the nonsecretory ducts in some way other than water permeability, as our results show that we are only able to meet the new salivary ionic compositions if a change to gene expression has occurred.
The mathematical model was used to replicate data collected under unstimulated conditions. Through modifying the primary saliva composition at the acinar end, it can be used to solve for any number of different physiological conditions, provided the model assumptions are satisfied, for instance, if saliva production is instead stimulated. It was found that the saliva electrochemistry is unchanged at the end of the duct; only the flow rate is heightened (Fig. 8C). Experimental data will be required for comparison.
CONCLUSIONS
Using a mathematical model of fluid and ion transport within the ductal cells of the parotid gland, we proposed the necessary changes to protein channel expression that will be needed explain the change in salivary composition and flow rate following the viral transfection of AQP1. If fluid is required to flow into the lumen along the whole length of the duct, one model solution requires a high level of [], accompanied by [Na+], to facilitate this. This implies that the initial assumption of an unchanged primary saliva is incorrect, as there may be also a change in the acinar cells following AQP1 transfection. Alternatively, we can reproduce both the increased flow rate and the changed saliva electrochemistry values after transfection if we rely heavily on the presence of secretory cells in the proximal end of the duct, which would express the majority of the AQP1.
Overall, we require further experimental data for elucidation. The concentration of [] in the saliva secreted by the gland will reveal whether it is actually the driver for a hyperosmotic duct, and would support the Striated-Secretion and Whole-Secretion scenarios. Measurements on the nature of the primary saliva before and after AQP1 transfection is also needed. As the viral vector used for AQP1 transfection in the experimental study (10) was not entirely specific to ductal cells but was shown to also transduce acinar cells, the increased salivary flow may be a consequence of acinar cells secreting more primary saliva. The ionic composition of this primary saliva should also be measured.
An investigation into the existence and placement of these secretory cells is crucial to confirming, or discrediting, Intercalated-Secretion. If present, measurement of their water permeability after viral transfection should be performed, and compared against the permeability of the distal duct cells. A validation on the changes in the channel protein expression can also help determine which scenario is most likely to have occurred in the physical system, or hint at another scenario entirely.
GRANTS
This research was supported by the Marsden Fund (grant UOA1411) by the Royal Society of New Zealand (Recipient: V. Suresh), http://www.royalsociety.org.nz/programmes/funds/marsden/; a National Institute of Dental and Craniofacial Research (NIDCR), National Institutes of Health (NIH) intramural research grant to J. A. Chiorini; and University of Auckland Doctoral Scholarship (Recipient: S. Fong), http://www.auckland.ac.nz.
DISCLOSURES
No conflicts of interest, financial or otherwise, are declared by the author(s).
AUTHOR CONTRIBUTIONS
S.F. and J.A.C. performed experiments; S.F. analyzed data; S.F. drafted manuscript; J.A.C., J.S., and V.S. interpreted results of experiments; J.S. and V.S. edited and revised manuscript.
APPENDIX A: CELL MODEL
The following is a detailed mathematical description of the cell model, showing the equations for each ion concentration, cell volume and membrane potentials for a single cell.
Model Equations
Water flux.
The cell is assumed to be cuboidal, with the apical and basolateral surfaces being of equal area A. Although striated ductal cells are water-impermeable, the insertion of aquaporins would cause water flux across both membranes. The intercalated duct cells are also shown to secrete water into the lumen. Changes in volume are thus reflected by a change in height. The volume of the cell (wC) is governed by:
| (7) |
The water fluxes and are driven by osmotic gradients across a membrane; it is assumed that the cell membrane cannot support hydrostatic pressure gradients.
| (8) |
where LA and LB are the hydraulic conductances of the apical and basolateral membranes, VW is the partial molar volume of water, and χ− represents the moles of impermeable, negatively charged species in the cell (16). Ψ accounts for the uncharged impermeable species present in the duct, which accounts for proteins including amylase. Σ[n] is the sum of concentrations [n] = Na+, Cl−, K+, H+, , CO2 in a compartment. The positive convention for flux is defined as from basolateral to apical direction.
Ionic currents.
An ohmic model is used to determine the current I through most channels considered, as it was found that they have a linear I-V relationship (2, 13, 32). As such, the current equations require the specifications of the conductance G and density per area α for each channel. Unless otherwise stated, it is assumed that the open probability P is fixed at 1. We also assume that all G constants are independent of voltage and time. The direction for positive current is defined as out of the cell for both membranes.
chloride and bicarbonate channels.
The sole Cl− channel in the model is the cystic fibrosis transmembrane conductance regulator (CFTR) located on the apical membrane (4). The current is given by:
| (9) |
where VA refers to the apical membrane potential. The Nernst potential for Cl− on the apical membrane is given by:
| (10) |
where R universal gas constant, T is the temperature, F is Faraday’s constant, and z is the valence of the ion.
The CFTR channel also transports bicarbonate. From Poulsen et al. (32), it is found that the permeability of CFTR to is 0.25 of its permeability to Cl−. As such:
| (11) |
sodium channels.
The epithelial sodium channel (ENaC) is located on the apical membrane, and is the major transporter of Na+ ions (4).
| (12) |
The Nernst potential for Na+ on the apical membrane is then given by:
| (13) |
potassium channels.
A number of K+ channels exist on both membranes. It was found that the maxi-K channels (BK, or KCa1.1) are located on the apical membrane of duct cells; these are calcium-activated K+ channels which secrete K+ into the duct (26). It is also thought that the intermediate conductance channel IK1 exists on the basolateral membrane (19). Catalan et al. (5) gives a full review of K+ channels in the duct.
The calcium-activation only affects the channel’s open probability, given by the Hill Function:
| (14) |
where is [K+] at half of the maximum reaction rate and η is the Hill coefficient.
The BK current and Nernst potential are:
| (15) |
On the basolateral side, the IK1 current is modeled:
| (16) |
The Na-K-ATPase (NKA).
On the basolateral surface, the ubiquitous sodium-potassium ATPase (Na-K-ATPase) exists, to establish the intracellular Na+ gradient (44) by use of ATP.
The comprehensive turnover rate for the NKA pump uNKA was modeled by Crampin and Smith (37). We use the simplified four state model (28) to give:
| (17) |
JNKA represents the flux through the cotransporter, with αNKA being the cotransporter density on the membrane. The values of the remaining constants are given in appendix c.
The Na-K-2Cl cotransporter (NKCC1).
Found on the basolateral membrane of secretory epithelia, this channel was only included in the secretory ductal cell. We use the quantitative description of the cotransporter presented by Benjamin and Johnson (1) in its simplified version (28).
The cotransporter turnover rate uNKCC1 given below, and is positive directed into the cell.
| (18) |
where SC = [Na]C[K]C, the product of ion concentrations. JNKCC1 represents the flux through the cotransporter, with αNKCC1 being the cotransporter density on the membrane. The values of the remaining constants are given in APPENDIX C.
Acid transporters.
The transport of H+ and have been found to be mainly coupled to the transport of other ions, and are crucial to the regulation of pH and bicarbonate both in the cell and in ductal fluid.
Crampin and Smith (7) have developed a ‘model reduction’ approach to quantify the kinetics of these exchangers in a cardiac myocyte. We have fitted simplified 2 state models to their models for the flux of ions. The rate constants are found in appendix d, where the adjusted densities of these transporters appropriate to a parotid duct cell are also provided.
na-h exchanger (nhe).
The NHE exchanges one Na+ for one H+ ion, and is critical to the regulation of cellular and salivary pH. Luo et al. (21) have found that the NHE1 isoform exists on the basolateral membrane, and that either NHE2 or NHE3 exists on the apical membrane. For simplicity, we assume that their transport kinetics are identical for all isoforms. The simplified flux is defined as:
| (19) |
where are the rate constants. The subscript e is assigned to the exterior space, being either the apical or basolateral compartments. The positive direction of flux is defined as Na+ entering the cell, and H+ exiting.
anion exchanger (ae2).
AE is a holistic term for the group of Cl−/ exchangers of the SLC4 and SLC26 families (19). The SLC26a4 and SLC26a6 were found on the apical membrane and assist in fluid and secretion (36), and the SLC4a2 on the basolateral (19). For simplicity, our model groups all Cl−/ exchangers as electroneutral AE2 transporters. Similar to the NHE, the flux is defined:
| (20) |
na-hco3 cotransporter (nbc).
The NBC transports both Na+ and in the same direction, and plays a role in the secretion of into the duct. It was stated that the electrogenic NBCe1-B ([Na+]/2[]) exists on the basolateral membrane (29), although another study states that only electroneutral variants exist (12). For simplicity, we assume that they are electroneutral. The flux is defined:
| (21) |
where [S] denotes the product [Na+][] in a given compartment.
Paracellular currents.
The model allows for transport of the ions paracellularly, with the positive direction of current toward the apical surface. The transepithelial potential difference is defined as Vt = VA − VB, and provides the driving force for the current.
| (22) |
The conductance will be specific to ion n.
Carbon dioxide transport.
CO2 can freely diffuse across both membranes [16]. The current therefore depends only on its concentration gradient and the permeability of the membrane to its transport, which is identical on both membranes:
| (23) |
Bicarbonate buffer.
The model supports pH regulation within the cell and in the ductal fluid through the inclusion of the bicarbonate buffer in the cell, which reflects how a cell will limit deviations to their pH after a stimulus has been applied.
CO2 dissolves in water to form carbonic acid H2CO3, which in turn rapidly dissociates into bicarbonate and hydrogen ions H+ (16). It is sufficient to bypass the intermediate step when modeling this reaction. The hydration of CO2 is as follows:
| (24) |
where and constants are obtained from Kern (17) and found in appendix c. The buffer is treated as a flux for the H+, , and CO2 ions in both compartments:
| (25) |
Membrane potential.
Using the law of conservation of charge, the membrane potential can be calculated by using the sum of all ionic currents:
| (26) |
where m is either the apical or basolateral membrane, and Cm is the membrane capacitance (16). Each of the ionic currents represents the sum of the currents from the ion channels which are electrogenic, and include paracellular currents:
| (27) |
Electroneutral transporters were not included, as they do not contribute to a net flux of charge.
Ionic balance equations.
As the interstitium is treated as a sink, the ionic concentrations there are constant. However, the ion concentrations in the cellular compartment are given by:
Similarly, for the apical compartment:
| (28) |
A summary of system parameters is defined in Table 3.
Table 3.
Values of other parameters in the system
| Variable | Value | Source, (Ref. No.) |
|---|---|---|
| Interstitial compartment: | ||
| [Na+] | 140.7 mM | (23) |
| [Cl−] | 125 mM | (23) |
| [K+] | 5 mM | (23) |
| pH | 7.35 | (33) |
| [] | 42.9 mM | Electroneutrality |
| [CO2] | 1.28 mM | buffer equilibrium |
| Physical parameters: | ||
| A | 20.9 nm2 | /(cell length of 10 µm) |
| 18.05 × 10⁻⁶ m3/mol | ||
| χ | 60 mM | |
| Ψ | 0.2 mM | (10, 20) |
| R | 8.3145 J·g−1·K−1 | |
| T | 310 K | |
| F | 96,485°C/mol | |
| [Ca2+] | 60 µM | (35) |
| wC | 2,090 μm3 | (31) |
Numerical Considerations
DAE system.
When solving the system numerically, adjustments had to be made as the differential equations for the membrane potentials (Eq. 27) created a very stiff system, due to small Cm values. To circumvent this, we apply a quasi-static approximation by setting the differential terms in Eq. 27 to zero (see Ref. 28). This in turn changes the system into a differential algebraic equation (DAE) system, with 14 differential (Eqs. 7 and 28) and two algebraic equations.
Electroneutrality.
It was found that to prevent the system from yielding infinite solutions which were dependent on the initial condition, an electroneutrality constraint was introduced (16):
| (29) |
where there is no net charge in the compartment. This condition was enforced in all compartments.
Initial conditions.
The electroneutrality condition hence restricts the possible initial conditions for wC, [Na+], [K+], and [Cl−] when solving the system numerically. The value of [CO2]t=0 was found when the hydration reaction of CO2 is at equilibrium; that is, Eq. 25 was set to zero. The initial conditions for the membrane potentials then become dependent on the initial concentrations; according to Eq. 27, expressions for the VA and VB were obtained after substituting in the equations for each current (in terms of the channel conductances and potentials), and rearranging.
Nondimensionalization.
To avoid numerical errors during the solve, all variables have been nondimensionalized.
APPENDIX B: CELL CHANNEL PARAMETERS
Ion channel parameters for the baseline nonsecretory cell at IR are shown in Table 4.
Table 4.
Ion channel parameters for the baseline nonsecretory cell at IR
| Channel | Conductance | Density |
|---|---|---|
| CFTR | 90 | 1 |
| ENaC | 54.6 | 1 |
| BK | 10 | 1 |
| NKA | 5 × 10⁻⁸ | |
| NHEA | 0.1 | |
| NHEB | 1 | |
| AE2A | 1 | |
| AE2B | 5 | |
| NBCA | 0 | |
| NBCB | 1 | |
| NaP | 0.4 | |
| ClP | 1 | |
| KP | 3 | |
| 5 × 10⁻⁶ |
For most currents, a density is provided in 1/m2. For ohmic currents, conductances are presented in S/m2. is permeability in 1/s.
APPENDIX C: ION TRANSPORTER RATE CONSTANTS
Rate constants for ionic fluxes through nonlinear transporters, or from the bicarbonate buffer, are shown in Table 5.
Table 5.
Rate constants for ionic fluxes through nonlinear transporters, or from the bicarbonate buffer
APPENDIX D: ACID TRANSPORTER KINETICS
Rate constants for fluxes through acid transporters used in the cell model are shown in Table 6. These values are fitted to simplified two state models of the transporters modeled by Crampin and Smith (7).
Table 6.
Rate constants for fluxes through acid transporters used in the cell model
| k+ | k− | |
|---|---|---|
| NHE | ||
| 1 | 1.4159 × 10³ s−1 | 1.4294 × 10¹¹ s−1 |
| 2 | 2.5296 × 10⁹ s−1 | 1.7857 × 10² s−1 |
| AE2 | ||
| 3 | 5.8599 s−1 | 1.0652 × 10⁸ s−1 |
| 4 | 9.3124 × 10⁷ s−1 | 5.1418 s−1 |
| NBC | ||
| 5 | −6.039 × 10⁻¹ mM−1·s−1 | 1.0 × 10⁸ mM·s−1 |
| 6 | 1.0004 × 10⁸ mM·s−1 | −1.9352 × 10⁻¹ mM−1·s−1 |
REFERENCES
- 1.Benjamin BA, Johnson EA. A quantitative description of the Na-K-2Cl cotransporter and its conformity to experimental data. Am J Physiol Renal Physiol 273: F473–F482, 1997. [DOI] [PubMed] [Google Scholar]
- 2.Blaug S, Hybiske K, Cohn J, Firestone GL, Machen TE, Miller SS. ENaC- and CFTR-dependent ion and fluid transport in mammary epithelia. Am J Physiol Cell Physiol 281: C633–C648, 2001. [DOI] [PubMed] [Google Scholar]
- 3.Boshell JL, Wilborn WH. Histology and ultrastructure of the pig parotid gland. Am J Anat 152: 447–465, 1978. doi: 10.1002/aja.1001520402. [DOI] [PubMed] [Google Scholar]
- 4.Catalán MA, Nakamoto T, Gonzalez-Begne M, Camden JM, Wall SM, Clarke LL, Melvin JE. Cftr and ENaC ion channels mediate NaCl absorption in the mouse submandibular gland. J Physiol 588: 713–724, 2010. doi: 10.1113/jphysiol.2009.183541. [DOI] [PMC free article] [PubMed] [Google Scholar]
- 5.Catalán MA, Peña-Munzenmayer G, Melvin JE. Ca2+-dependent K+ channels in exocrine salivary glands. Cell Calcium 55: 362–368, 2014. doi: 10.1016/j.ceca.2014.01.005. [DOI] [PMC free article] [PubMed] [Google Scholar]
- 6.Cheng VS, Downs J, Herbert D, Aramany M. The function of the parotid gland following radiation therapy for head and neck cancer. Int J Radiat Oncol Biol Phys 7: 253–258, 1981. doi: 10.1016/0360-3016(81)90444-2. [DOI] [PubMed] [Google Scholar]
- 7.Crampin EJ, Smith NP. A dynamic model of excitation-contraction coupling during acidosis in cardiac ventricular myocytes. Biophys J 90: 3074–3090, 2006. doi: 10.1529/biophysj.105.070557. [DOI] [PMC free article] [PubMed] [Google Scholar]
- 8.de Almeida PV, Grégio AM, Machado MA, de Lima AA, Azevedo LR. Saliva composition and functions: a comprehensive review. J Contemp Dent Pract 9: 72–80, 2008. [PubMed] [Google Scholar]
- 9.Franzén L, Funegård U, Ericson T, Henriksson R. Parotid gland function during and following radiotherapy of malignancies in the head and neck. A consecutive study of salivary flow and patient discomfort. Eur J Cancer 28: 457–462, 1992. doi: 10.1016/S0959-8049(05)80076-0. [DOI] [PubMed] [Google Scholar]
- 10.Gao R, Yan X, Zheng C, Goldsmith CM, Afione S, Hai B, Xu J, Zhou J, Zhang C, Chiorini JA, Baum BJ, Wang S. AAV2-mediated transfer of the human aquaporin-1 cDNA restores fluid secretion from irradiated miniature pig parotid glands. Gene Ther 18: 38–42, 2011. doi: 10.1038/gt.2010.128. [DOI] [PMC free article] [PubMed] [Google Scholar]
- 11.Gin E, Crampin EJ, Brown DA, Shuttleworth TJ, Yule DI, Sneyd J. A mathematical model of fluid secretion from a parotid acinar cell. J Theor Biol 248: 64–80, 2007. doi: 10.1016/j.jtbi.2007.04.021. [DOI] [PMC free article] [PubMed] [Google Scholar]
- 12.Gresz V, Kwon T-H, Vorum H, Zelles T, Kurtz I, Steward MC, Aalkjaer C, Nielsen S. Immunolocalization of electroneutral Na(+)-HCO cotransporters in human and rat salivary glands. Am J Physiol Gastrointest Liver Physiol 283: G473–G480, 2002. doi: 10.1152/ajpgi.00421.2001. [DOI] [PubMed] [Google Scholar]
- 13.Grissmer S, Nguyen AN, Cahalan MD. Calcium-activated potassium channels in resting and activated human T lymphocytes. Expression levels, calcium dependence, ion selectivity, and pharmacology. J Gen Physiol 102: 601–630, 1993. doi: 10.1085/jgp.102.4.601. [DOI] [PMC free article] [PubMed] [Google Scholar]
- 14.Hong JH, Muhammad E, Zheng C, Hershkovitz E, Alkrinawi S, Loewenthal N, Parvari R, Muallem S. Essential role of carbonic anhydrase XII in secretory gland fluid and HCO3− secretion revealed by disease causing human mutation. J Physiol 593: 5299–5312, 2015. doi: 10.1113/JP271378. [DOI] [PMC free article] [PubMed] [Google Scholar]
- 15.Jemal A, Siegel R, Ward E, Hao Y, Xu J, Thun MJ. Cancer statistics, 2009. CA Cancer J Clin 59: 225–249, 2009. doi: 10.3322/caac.20006. [DOI] [PubMed] [Google Scholar]
- 16.Keener J, Sneyd J. Mathematical Physiology: I: Cellular Physiology. New York: Springer, 2008. [Google Scholar]
- 17.Kern D. The hydration of carbon dioxide. J Chem Educ 37: 14, 1960. doi: 10.1021/ed037p14. [DOI] [Google Scholar]
- 18.Krstic RV. Human Microscopic Anatomy: An Atlas for Students of Medicine and Biology. Berlin: Springer Science & Business Media, 2013. [Google Scholar]
- 19.Lee MG, Ohana E, Park HW, Yang D, Muallem S. Molecular mechanism of pancreatic and salivary gland fluid and HCO3 secretion. Physiol Rev 92: 39–74, 2012. doi: 10.1152/physrev.00011.2011. [DOI] [PMC free article] [PubMed] [Google Scholar]
- 20.Loo JA, Yan W, Ramachandran P, Wong DT. Comparative human salivary and plasma proteomes. J Dent Res 89: 1016–1023, 2010. doi: 10.1177/0022034510380414. [DOI] [PMC free article] [PubMed] [Google Scholar]
- 21.Luo X, Choi JY, Ko SBH, Pushkin A, Kurtz I, Ahn W, Lee MG, Muallem S. HCO3− salvage mechanisms in the submandibular gland acinar and duct cells. J Biol Chem 276: 9808–9816, 2001. doi: 10.1074/jbc.M008548200. [DOI] [PubMed] [Google Scholar]
- 22.Maclaren OJ, Sneyd J, Crampin EJ. Efficiency of primary saliva secretion: an analysis of parameter dependence in dynamic single-cell and acinus models, with application to aquaporin knockout studies. J Membr Biol 245: 29–50, 2012. doi: 10.1007/s00232-011-9413-3. [DOI] [PMC free article] [PubMed] [Google Scholar]
- 23.Mangos JA, McSherry NR, Nousia-Arvanitakis S, Irwin K. Secretion and transductal fluxes of ions in exocrine glands of the mouse. Am J Physiol 225: 18–24, 1973. [DOI] [PubMed] [Google Scholar]
- 24.Matsuzaki T, Susa T, Shimizu K, Sawai N, Suzuki T, Aoki T, Yokoo S, Takata K. Function of the membrane water channel aquaporin-5 in the salivary gland. Acta Histochem Cytochem 45: 251–259, 2012. doi: 10.1267/ahc.12018. [DOI] [PMC free article] [PubMed] [Google Scholar]
- 25.Nakamoto T, Hirono C, Sugita M, Takemoto K, Iwasa Y, Akagawa Y, Shiba Y. Forskolin-induced clearance of the fluorescent dye sulforhodamine from rat parotid intralobular duct lumen: visualization of the secretory function under a confocal laser scanning microscope. J Membr Biol 190: 189–196, 2002. doi: 10.1007/s00232-002-1036-2. [DOI] [PubMed] [Google Scholar]
- 26.Nakamoto T, Romanenko VG, Takahashi A, Begenisich T, Melvin JE. Apical maxi-K (KCa1.1) channels mediate K+ secretion by the mouse submandibular exocrine gland. Am J Physiol Cell Physiol 294: C810–C819, 2008. doi: 10.1152/ajpcell.00511.2007. [DOI] [PMC free article] [PubMed] [Google Scholar]
- 27.Novak I, Praetorius J. Fundamentals of bicarbonate secretion in epithelia. In: Ion Channels and Transporters of Epithelia in Health and Disease, edited by Hamilton KL, Devor DC. New York: Springer, 2016, p. 187–263. doi: 10.1007/978-1-4939-3366-2_5. [DOI] [Google Scholar]
- 28.Palk L. A Mathematical Study of the Role of Calcium in the Regulation of Saliva Secretion (PhD thesis) Auckland, New Zealand: University of Auckland, 2012. [Google Scholar]
- 29.Parker MD, Boron WF. The divergence, actions, roles, and relatives of sodium-coupled bicarbonate transporters. Physiol Rev 93: 803–959, 2013. doi: 10.1152/physrev.00023.2012. [DOI] [PMC free article] [PubMed] [Google Scholar]
- 30.Parks HF. On the fine structure of the parotid gland of mouse and rat. Am J Anat 108: 303–329, 1961. doi: 10.1002/aja.1001080306. [DOI] [PubMed] [Google Scholar]
- 31.Patterson K, Catalán MA, Melvin JE, Yule DI, Crampin EJ, Sneyd J. A quantitative analysis of electrolyte exchange in the salivary duct. Am J Physiol Gastrointest Liver Physiol 303: G1153–G1163, 2012. doi: 10.1152/ajpgi.00364.2011. [DOI] [PMC free article] [PubMed] [Google Scholar]
- 32.Poulsen JH, Fischer H, Illek B, Machen TE. Bicarbonate conductance and pH regulatory capability of cystic fibrosis transmembrane conductance regulator. Proc Natl Acad Sci USA 91: 5340–5344, 1994. doi: 10.1073/pnas.91.12.5340. [DOI] [PMC free article] [PubMed] [Google Scholar]
- 33.Reeves RB. Temperature-induced changes in blood acid-base status: pH and PCO2 in a binary buffer. J Appl Physiol 40: 752–761, 1976. [DOI] [PubMed] [Google Scholar]
- 34.Riva A, Valentino L, Lantini MS, Floris A, Testa Riva F. 3D-structure of cells of human salivary glands as seen by SEM. Microsc Res Tech 26: 5–20, 1993. doi: 10.1002/jemt.1070260103. [DOI] [PubMed] [Google Scholar]
- 35.Sanderson MJ, Charles AC, Dirksen ER. Mechanical stimulation and intercellular communication increases intracellular Ca2+ in epithelial cells. Cell Regul 1: 585–596, 1990. [DOI] [PMC free article] [PubMed] [Google Scholar]
- 36.Shcheynikov N, Yang D, Wang Y, Zeng W, Karniski LP, So I, Wall SM, Muallem S. The Slc26a4 transporter functions as an electroneutral Cl-/I-/HCO3− exchanger: role of Slc26a4 and Slc26a6 in I- and HCO3− secretion and in regulation of CFTR in the parotid duct. J Physiol 586: 3813–3824, 2008. doi: 10.1113/jphysiol.2008.154468. [DOI] [PMC free article] [PubMed] [Google Scholar]
- 37.Smith NP, Crampin EJ. Development of models of active ion transport for whole-cell modelling: cardiac sodium-potassium pump as a case study. Prog Biophys Mol Biol 85: 387–405, 2004. doi: 10.1016/j.pbiomolbio.2004.01.010. [DOI] [PubMed] [Google Scholar]
- 38.Sneyd J, Crampin E, Yule D. Multiscale modelling of saliva secretion. Math Biosci 257: 69–79, 2014. doi: 10.1016/j.mbs.2014.06.017. [DOI] [PMC free article] [PubMed] [Google Scholar]
- 39.Steward MC, Seo Y, Case RM. Intracellular pH during secretion in the perfused rabbit mandibular salivary gland measured by 31P NMR spectroscopy. Pflugers Arch 414: 200–207, 1989. doi: 10.1007/BF00580964. [DOI] [PubMed] [Google Scholar]
- 40.Sun T, Zhu J, Yang X, Wang S. Growth of miniature pig parotid cells on biomaterials in vitro. Arch Oral Biol 51: 351–358, 2006. doi: 10.1016/j.archoralbio.2005.10.001. [DOI] [PubMed] [Google Scholar]
- 41.Tamarin A, Sreebny LM. The rat submaxillary salivary gland. A correlative study by light and electron microscopy. J Morphol 117: 295–352, 1965. doi: 10.1002/jmor.1051170303. [DOI] [PubMed] [Google Scholar]
- 42.Turner RJ, Sugiya H. Understanding salivary fluid and protein secretion. Oral Dis 8: 3–11, 2002. doi: 10.1034/j.1601-0825.2002.10815.x. [DOI] [PubMed] [Google Scholar]
- 43.Wang SL, Li J, Zhu XZ, Sun K, Liu XY, Zhang YG. Sialographic characterization of the normal parotid gland of the miniature pig. Dentomaxillofac Radiol 27: 178–181, 1998. doi: 10.1038/sj.dmfr.4600336. [DOI] [PubMed] [Google Scholar]
- 44.Young J A, Cook DI. Comprehensive Human Physiology: From Cellular Mechanisms to Integration. Berlin: Springer, 1996. [Google Scholar]