Abstract
Phototherapy shows some unique advantages in clinical application, such as remote controllability, improved selectivity, and low bio-toxicity, than chemotherapy. In order to improve the safety and therapeutic efficacy, imaging-guided therapy seems particularly important because it integrates visible information to speculate the distribution and metabolism of the probe. Here we prepare biocompatible core-shell nanocomposites for dual-modality imaging-guided photothermal and photodynamic dual-therapy by the in situ growth of porphyrin-metal organic framework (PMOF) on Fe3O4@C core. Fe3O4@C core was used as T2-weighted magnetic resonance (MR) imaging and photothermal therapy (PTT) agent. The optical properties of porphyrin were well remained in PMOF, and PMOF was therefore selected for photodynamic therapy (PDT) and fluorescence imaging. Fluorescence and MR dual-modality imaging-guided PTT and PDT dual-therapy was confirmed with tumour-bearing mice as model. The high tumour accumulation of Fe3O4@C@PMOF and controllable light excitation at the tumour site achieved efficient cancer therapy, but low toxicity was observed to the normal tissues. The results demonstrated that Fe3O4@C@PMOF was a promising dual-imaging guided PTT and PDT dual-therapy platform for tumour diagnosis and treatment with low cytotoxicity and negligible in vivo toxicity.
Cancer becomes one of the major threats to human beings although great efforts have been done1. Chemotherapy is still the popular means for cancer therapy, but drug-resistance and bio-toxicity are its important limitations2. As a consequence, various physiotherapy strategies emerge at the right moment. Phototherapy, including photothermal therapy (PTT) and photodynamic therapy (PDT), shows unique advantages, such as remote controllability, improved selectivity, and low bio-toxicity compared with chemotherapy3,4,5. Probing the position of photoactive agent becomes important for phototherapy, so multifunctional cancer therapy platforms (MCTPs) attract much attention as they integrate imaging and therapy into a single system for imaging-guided therapy to improve the therapeutic efficiency and safety6,7. Various interesting MCTPs have been fabricated with emissive nanostructures (e.g., Au nanorods and nanoshells) and photosensitizers (e.g., chlorine e6 and indocyanine green) for imaging-synergistic-therapy8,9. However, the systems suffered from single-modality imaging, single-therapy, and/or complex post-modification. If multi-modality imaging is selected, the advantages of each imaging modality are integrated together, such as high sensitivity of fluorescence and the deep penetration and spatial resolution of magnetic resonance (MR) imaging10,11,12. The dual-therapy combination of PTT and PDT could improve the therapeutic effect significantly 13,14,15.
One of the challenges to build MCTPs is the selection of safe and biocompatible building blocks with optical and/or magnetic responses. Porphyrin and its derivatives are widely used as photosensitizers and organic ligands for bioimaging and PDT16, due to their unique optoelectronic properties17,18. However, their large hydrophobic planar structure makes porphyrin easily aggregated to quench their fluorescence and decrease the capacity of singlet oxygen generation19. Porphyrin-metal-organic frameworks (PMOFs) have the rigid structure and well retain the optoelectronic property of porphyrin.
Superparamagnetic iron oxide nanoparticles (SPIONs) are efficient imaging agents because they shorten transverse relaxation with facile synthesis and excellent biocompatibility20,21. The cluster structure of Fe3O4 nanoparticles is effective to enhance MR imaging efficiency than single-domain nanocrystals because it impairs the longitudinal relaxivity20,21. Moreover, the number and magnetic moment of nanoparticles in an assembly are proportional to transverse relaxivity (r2)20,21. Thus, selection of simple Fe3O4 cluster preparation is useful to improve T2-MR imaging efficiency19. SPIONs are biodegradable22 and ferumoxsil and ferumoxide, therefore have been approved by Food and Drug Administration as MR contrast agents23,24,25. Fe3O4 nanoparticles can convert near-infrared (NIR) irradiation to heat to enable localized damage to cancer cells or tissues. Thus, the combination of magnetic property and local photothermal effect make SPIONs interesting as imaging and therapy agents.
Herein, we report the fluorescence-MR dual-modality imaging-guided PTT-PDT dual-therapy system with novel core-shell Fe3O4@C@PMOF nanocomposites. A cluster of Fe3O4 nanoparticles were encapsulated in the carbon shell as Fe3O4@C for T2-weighted MR imaging and as PTT agent. PMOF was then post-modified on the biocompatible and stable Fe3O4@C26,27. The PMOF was constructed with highly biocompatible and stable Zr ions and TCPP [5, 10, 15, 20–Tetrakis (4-carboxyl)-21H, 23H-porphine] as fluorescence imaging and PDT agent17,28,29,30. Biocompatible core-shell Fe3O4@C@PMOF nanocomposites were therefore fabricated for T2-weighted MR and fluorescence dual-modality imaging-guided PTT and PDT dual-therapy. Tumor-bearing mice experiment demonstrated the high tumor accumulation of Fe3O4@C@PMOF as efficient MCTP after irradiated with lasers. Low cytotoxicity and bio-toxicity of Fe3O4@C@PMOF were validated as the high biocompatibility of the building blocks. To our knowledge, this is the first Fe3O4@C@PMOF reported as MCTPs for dual-modality imaging-guided dual-therapy and realized the cancer therapy without chemical drugs.
Results
Synthesis and Characterization of Fe3O4@C and Fe3O4@C@PMOF
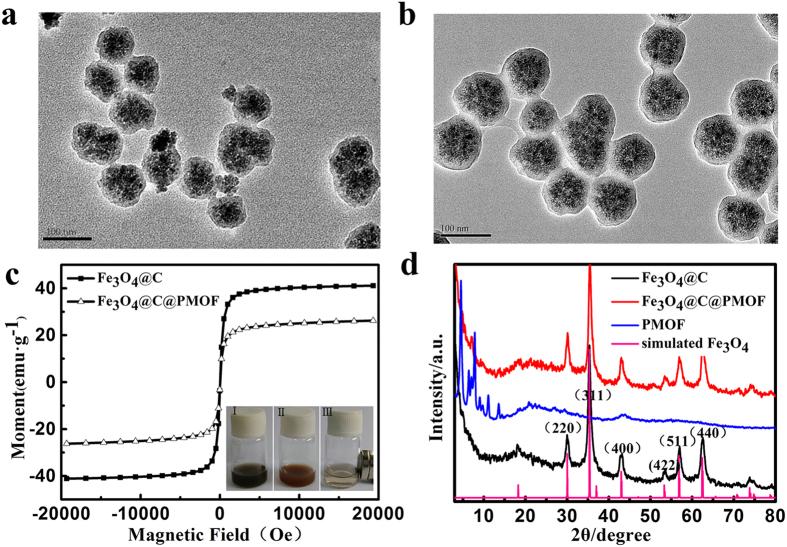
Fe3O4@C micro-structure was fabricated by one-pot solvothermal strategy according to previous report31. Fe3O4@C nanoparticles were dispersed in the DMF suspension of ZrCl4 in a hydrothermal procedure for 30 min, and then DMF solution of TCPP was added into the mixture. Fe3O4@C@PMOF was prepared by the in situ self-assembly of PMOF on the surface of Fe3O4@C to obtain the core-shell nanocomposites. The proposed method was time-saving and efficient compared with the layer-by-layer self-assembly of MOF32,33. Therefore, a simple strategy was developed to prepare the Fe3O4@C@PMOF composite. Transmission electron microscopy (TEM) images of Fe3O4@C and Fe3O4@C@PMOF revealed their well-defined micro-structure with the average diameter of 80 and 95 nm, respectively (Fig. 1a and b). Moreover, ca 7.5 nm PMOF layer was successfully coated on Fe3O4@C to form the Fe3O4@C@PMOF hybrid nanocomposites. Fe3O4@C nanoclusters consisted of numerous 10 nm Fe3O4 nanoparticles as illustrated in Fig. 1a and b, different to the solid Fe3O4 structure of ferumoxsil and ferumoxide23,24,25. Thus, improved T2-MR imaging efficiency is expected because of the altered proton relaxation effect of the nanocluster structure. The composites less than 100 nm pass through the tumor microenvironment easily and remain for a long time before blood clearance34. Moreover, the size of Fe3O4@C@PMOF was suitable for PDT because the diffusion length of singlet oxygen (1O2) was 90−120 nm in aqueous environment and 20−220 nm inside cells28.
Figure 1. TEM images, magnetic hysteresis curves, and XRD patterns of nanoparticles.
TEM images of (a) Fe3O4@C and (b) Fe3O4@C@PMOF; (c) Magnetic hysteresis curves of Fe3O4@C and Fe3O4@C@PMOF samples at 300 K. Inset: photo images of (I) Fe3O4@C, (II) Fe3O4@C@PMOF, and (III) magnetic collection of Fe3O4@C@PMOF; (d) XRD patterns of synthesized Fe3O4@C@PMOF, PMOF, Fe3O4@C, and simulated Fe3O4.
Dynamic light scattering analysis indicated that Fe3O4@C@PMOF had a relatively narrow size distribution and was well dispersed for real application (Supplementary Fig. S1). −15.7 and −3.39 mV of zeta potentials were observed for Fe3O4@C and Fe3O4@C@PMOF (Supplementary Fig. S2). Therefore, the carbon layer of Fe3O4@C was oxidized by H2O2 under solvothermal procedure to form abundant carboxylic groups, which were then used to coordinate with Zr4+ ions. The PMOF layer formed through the coordination between Zr4+ ions and TCPP as the zeta potential changed from original −15.7 mV to −3.39 mV. The near-neutral surface of the nanocomposites makes them excellent candidates for in vivo applications35.
The magnetic properties of Fe3O4@C and Fe3O4@C@PMOF were characterized by Vibrating Sample Magnetometer (VSM) at the field of ± 20 kOe (Fig. 1c). The saturation magnetization of Fe3O4@C was 39.8 emu g−1. The magnetic hysteresis curve was retained in Fe3O4@C@PMOF with the saturation magnetization of 24.5 emu g−1. Both Fe3O4@C and Fe3O4@C@PMOF were well dispersed, but they were collected easily with external magnet and the solution became transparent (Inset in Fig. 1c). Thus, the great MR imaging potential was revealed from Fe3O4@C@PMOF.
Powder X-ray diffraction (XRD) patterns of Fe3O4@C, PMOF, and Fe3O4@C@PMOF were recorded (Fig. 1d). The peaks observed at 30.1, 35.3, 42.9, 53.5, 57.0, and 62.5° were assigned to (220), (311), (400), (422), (511) and (440) planes of cubic structure of Fe3O4 crystal (JCPDS No.75-1609). The simultaneous existence of the characteristic peaks of Fe3O4 and PMOF in its XRD pattern indicates the successful formation of Fe3O4@C@PMOF nanocomposites. The formation was also confirmed by Fourier transform infrared spectroscopy (FT-IR) with the characteristic peak at 964.45 cm−1 assigned to the pyrrole ring of the ligand, TCPP (Supplementary Fig. S3). Thermogravimetric analysis (TGA) results revealed that Fe3O4@C was highly stable in the tested temperature (Supplementary Fig. S4). The gradual weight loss before 200 °C was attributed to the removal of solvents, including acetone and DMF, from both Fe3O4@C and Fe3O4@C@PMOF. The removal of carbon shell of Fe3O4@C was at around 300 °C. The large weight loss of Fe3O4@C@PMOF occurred at around 400 °C was assigned to the collapse of the PMOF skeleton upon the decomposition of TCPP.
Optical properties and MR response of Fe3O4@C@PMOF
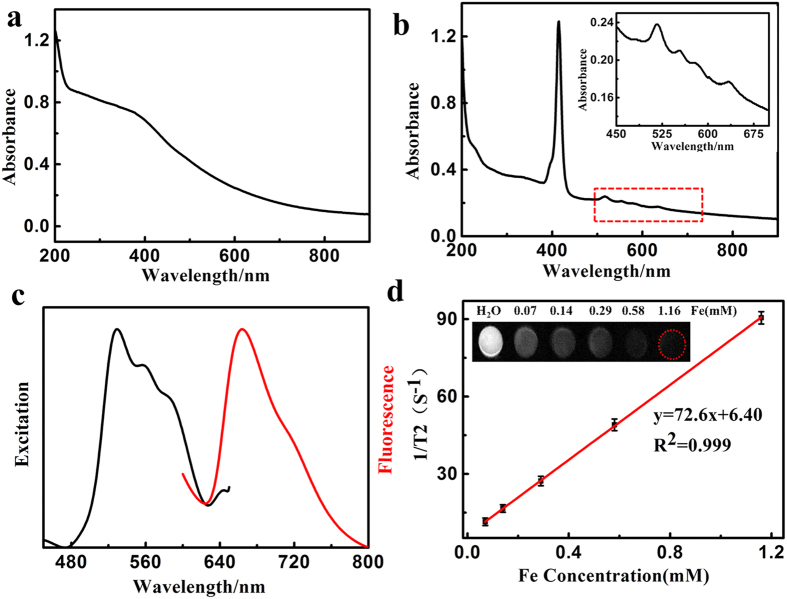
The UV–Vis spectra of Fe3O4@C and Fe3O4@C@PMOF dispersed in aqueous solution were recorded. An extended absorption band was observed in NIR region from Fe3O4@C (Fig. 2a). This feature provided efficient photothermal capacity. When PMOF shell was covered, a strong absorption peak emerged at 416 nm for Soret band (Fig. 2b) and four peaks at 517, 554, 583, and 634 nm were observed for Q band as the typical character of porphyrin (inset of Fig. 2b)16. Thus, Fe3O4@C@PMOF was potential for PDT because of its matched NIR absorption36. Single emission peak was observed at 668 nm from Fe3O4@C@PMOF with 553 nm excitation (Fig. 2c). Strong NIR emission and long Stocks shift led to a high signal/noise ratio for fluorescent image because of the low auto-fluorescence and scattering light from biological tissue37,38. The optical property of Fe3O4@C@PMOF illustrated its PTT and PDT potential and fluorescence imaging capacity.
Figure 2. Optical properties and MR response of Fe3O4@C@PMOF.
UV−Vis spectra of (a) Fe3O4@C and (b) Fe3O4@C@PMOF nanocomposites. Inset: the amplification of the part spectrum. (c) The excitation and fluorescence spectra (excitation at 553 nm) of Fe3O4@C@PMOF aqueous solution. (d) T2-weighted MR images of Fe3O4@C@PMOF at different concentrations of Fe and the plot of 1/T2 over Fe concentration of Fe3O4@C@PMOF nanocomposites. The slope indicates the specific relaxivity (r2).
T2-weighted imaging was tested to validate the MR contrast potential of Fe3O4@C@PMOF nanocomposites. The relaxation rates vary linearly with increased Fe concentration (Fig. 2d). The darkening T2 MR imaging at different Fe concentrations confirmed the T2-weighted MR efficiency (Inset of Fig. 2d). Fe content of Fe3O4@C@PMOF was tested by inductively coupled plasma-atomic emission spectroscopy, and the slope in Fig. 2d was the r2 value, which was 72.6 mM−1 s−1 (r1 = 1.23 mM−1 s−1, r2/r1 = 59.0, Supplementary Fig. S5). The r2 value was higher than that of commercial magnetic nanoparticles (10 nm, r2 = 59.91 ± 6 mM−1 s−1)39 due to the integration of numerous 10 nm Fe3O4 nanoparticles in a carbon layer for efficient T2-contrast effect21. The r2/r1 ratio was 59.0, and therefore Fe3O4@C@PMOF showed the potential for T2-weighted MR imaging.
In vitro photothermal and photodynamic properties of Fe3O4@C@PMOF.
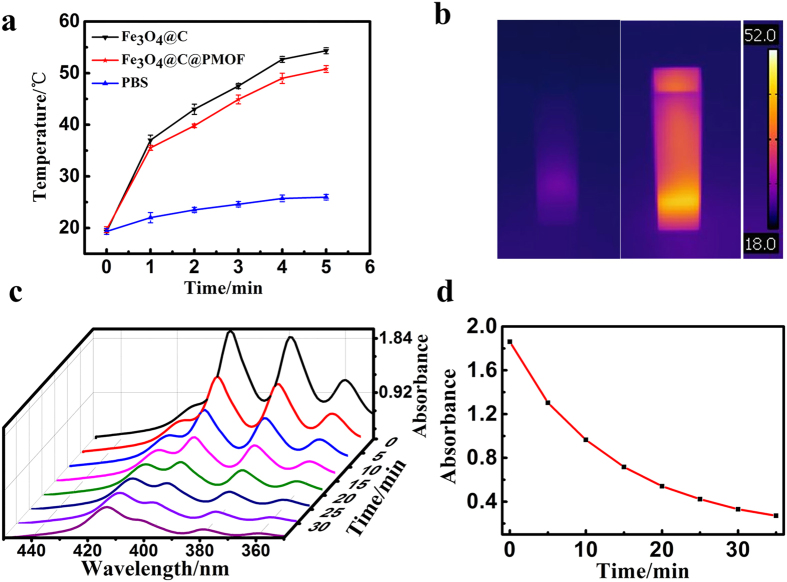
PTT efficiency of Fe3O4@C@PMOF was evaluated by measuring the temperature change under 808 nm NIR laser irradiation (Fig. 3a). After a 5 min of laser exposure, the solutions containing Fe3O4@C and Fe3O4@C@PMOF respectively were rapidly heated to higher than 50 °C because of the high NIR absorptivity of Fe3O4, while the PBS solution showed less photo-generated heating efficiency (Supplementary Fig. S6). However, when Fe3O4@C@PMOF solution was exposed to 655 nm laser for 30 min, the temperature gave rise to 29 °C, which was negligible to damage cancer cells (Supplementary Fig. S7). Infrared thermal photographs of Fe3O4@C@PMOF solution before and after 808 nm irradiation illustrated the photothermal capacity directly (Fig. 3b).
Figure 3. Photothermal and photodynamic properties of Fe3O4@C@PMOF.
(a) Temperature of Fe3O4@C, Fe3O4@C@PMOF, and PBS solutions as a function of time upon exposure to 808 nm laser at 1.0 W cm−2 within 5 min; (b) Infrared thermal photograph of Fe3O4@C@PMOF solution before and after 808 nm irradiation (1.0 W cm-2) for 5 min. (c) Absorbance spectra of ABDA (200 μmol L−1) in the presence of Fe3O4@C@PMOF nanocomposites (20 μmol L−1) over different periods under irradiation of 655 nm (0.3 W cm−2) in pH 7.4 PBS solution. (d) Absorbance values of ABDA at 379 nm against irradiation time in the presence of Fe3O4@C@PMOF nanocomposites.
Singlet oxygen (1O2) is the electronic excited state of molecular oxygen and highly reactive in the oxidization damage of biological tissues4,28. 9, 10-anthracenediyl-bis (methylene) dimalonic acid (ABDA) was used as indicator to verify the 1O2 generation capacity of Fe3O4@C@PMOF because ABDA can react with 1O2 irreversibly40. The reaction was monitored by the decreased ABDA absorption at 379 nm. The absorption spectra of ABDA in Fe3O4@C@PMOF were recorded at different exposure times (Fig. 3c), and the variation of absorbance was illustrated in Fig. 3d. The rapid decrease of ABDA absorption represented fast 1O2 generation by Fe3O4@C@PMOF under 655 nm laser irradiation. However, ABDA was stable for single Fe3O4@C@PMOF or light (Supplementary Fig. S8). The 1O2 generation rate was calculated with the following equation13,28,41:
 |
where A refers to the absorption of ABDA at 379 nm, c is fitting parameter, and t is irradiation time. The 1O2 generation rate (v) was calculated as 0.055 min−1 for Fe3O4@C@PMOF. The 1O2 quantum yield is calculated with the equation40:
 |
where h is Plank constant, c is velocity of light, λ is the wavelength of laser, nABDA is the amount of ABDA consumed by 1O2, NA is Avogadro constant, and Wlaser is the power of laser irradiated. The 1O2 quantum yield (Y) of Fe3O4@C@PMOF was 44.38%, illustrating the high efficiency of Fe3O4@C@PMOF for 1O2 generation. In the same way, the ABDA absorption peak at 379 nm was stable under 808 nm laser irradiation (Supplementary Fig. S9). Thus, their optical properties were well remained in the nanocomposites. Moreover, PTT and PDT were regarded as two independent processes from Fe3O4@C and PMOF, respectively.
Cytotoxicity and photoxicity of Fe3O4@C@PMOF
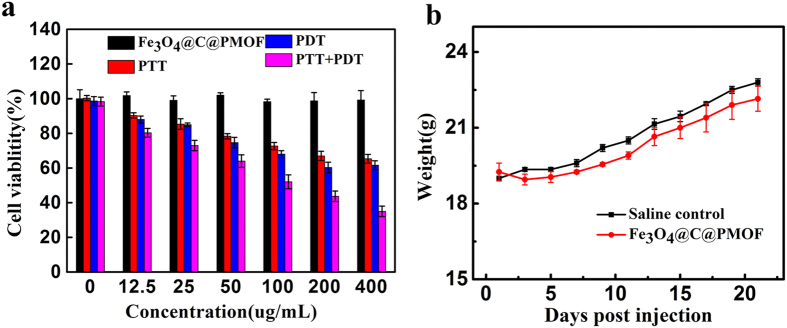
The cytotoxicity and photoxicity of Fe3O4@C@PMOF were measured with standard 3-(4, 5-dimethylthiazol-2-yl)−2, 5-diphenyltetrazolium bromide (MTT) assay (Fig. 4a). The cell viability of MCF-7 cells was recorded after incubated with Fe3O4@C@PMOF at various concentrations for 8 h. The PDT group was irradiated under 655 nm for 10 min, while the PTT group was subjected to 808 nm NIR laser for 10 min. The cell viability of irradiated groups gradually decreased with increasing the concentration of Fe3O4@C@PMOF. In contrast, the group without irradiation showed negligible cytotoxicity to MCF-7 cells, indicating the high biocompatibility of Fe3O4@C@PMOF. It is worth noting that viability of cells incubated with Fe3O4@C@PMOF was remarkably decreased to less than 35% after the co-therapy of PDT and PTT. The long-term biotoxicity of Fe3O4@C@PMOF was evaluated by monitoring the body weight trend of mice after intravenous injection of Fe3O4@C@PMOF, and the saline-injected mice was regarded as control. No sign of illness and activity changes was observed from the mice, which also showed the same weight trend to the mice in control group within 3 weeks (Fig. 4b).
Figure 4. Toxicity of Fe3O4@C@PMOF.
(a) Viability of MCF-7 cells incubated with Fe3O4@C@PMOF at varied concentrations for 8 h with or without laser irradiation. (b) The body weight trends of mice within 3 weeks after injection with saline solution (control) or Fe3O4@C@PMOF (20 mg kg−1). Error bars represent the standard deviations of three mice per group.
In vivo dual-modality imaging of mice with Fe3O4@C@PMOF as probe and clearance study
To prove the in vivo efficiency of dual-modality imaging, Fe3O4@C@PMOF nanocomposite was injected intravenously into a 20 g healthy nude mouse. In vivo T2 MR image was recorded (Supplementary Fig. S10). The liver region was darkening after being injected for 22 h. The same result was observed in fluorescence imaging simultaneously. The fluorescent spot was also observed in lymph possibly because of the high affinity between porphyrin and lymph node. Thus, the nanocomposites did transfer not only through blood circulation but also participate in the lymph circulation simultaneously. Then, it accumulated in liver. Finally, most of Fe3O4@C@PMOF was excreted through excrement within 8 days with the similar metabolic pathway to coproporphyrin42. The images in Fig. 5 illustrated the whole metabolism process of Fe3O4@C@PMOF in nude mice after intravenously injected at different time.
Figure 5. Metabolism processes of Fe3O4@C@PMOF in nude mice.
Fluorescence images of the mice were recorded at excitation of 550 nm and emission of 660 nm under different period after injection of Fe3O4@C@PMOF. After 8 days, the mice were still alive and well.
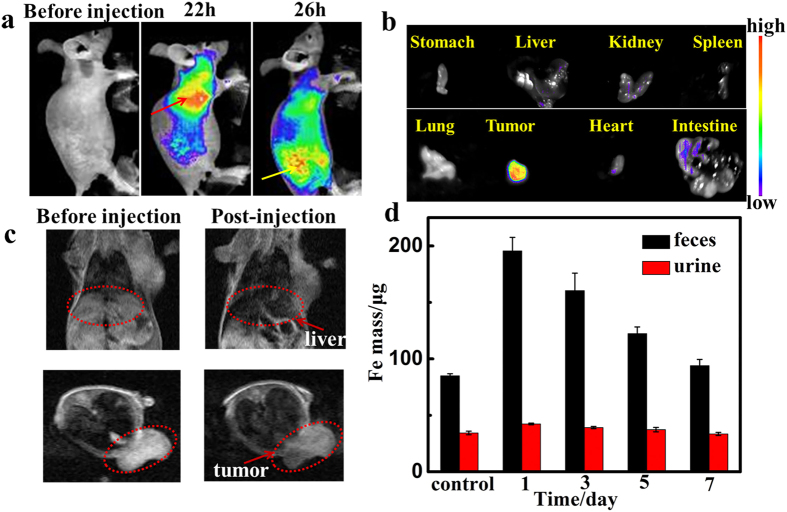
To verify the accumulation of Fe3O4@C@PMOF in tumor site, MCF-7 tumor-bearing nude mice were selected as model (Fig. 6a). After being intravenously injected with Fe3O4@C@PMOF for 22 h, fluorescent signal was localized mainly in the liver region than the other organs. The tumor region was lightened slowly and became the brightest tissue of the mice via enhanced permeability and retention (EPR) effect after 26 h. In vivo T2 MR image was also recorded simultaneously (Fig. 6c). The dramatic dimming was observed at tumor area and also demonstrated the high tumor uptake of Fe3O4@C@PMOF, which was the same as the fluorescence imaging result. To further evaluate the tissue distribution of the nanocomposites, major organs dissected from the mice were harvested and imaged ex vivo at 26 h post injection (Fig. 6b). The highest fluorescent intensity of cancer tissue indicated tumor-targeted delivery for imaging, PDT and PTT. The intestine was also lightened and indicated the potential metabolic pathway that Fe3O4@C@PMOF was excreted through excrement. To further study the excretion of the nanocomposites, high level of Fe was detected in feces of mice after injected with Fe3O4@C@PMOF (Fig. 6d). Thus, both MR and fluorescent imaging results and ex vivo fluorescence images of the tissues confirmed the efficient tumor location of our nanocomposites.
Figure 6. T2-weighted MR and fluorescent imaging of tumor-bearing mice and dissected organs.
(a) Fluorescent imaging (Ex = 550 nm, Em=660 nm) of tumor-bearing mice before and after intravenous injection of Fe3O4@C@PMOF (20 mg kg−1). The liver region was marked by red dot line and the yellow lines referred to tumor region. (b) Fluorescent imaging of dissected organs of tumor-bearing mouse.(c) T2-weighted MR imaging of tumor-bearing mice in the coronal plane (upper) and in the axial plane (lower). The liver region and tumor region were marked by red dot line. (d) The detected Fe mass in feces and urine at different time points after intravenous injection of Fe3O4@C@PMOF (20 mg kg−1).
In vivo photothermal and photodynamic synergetic therapy
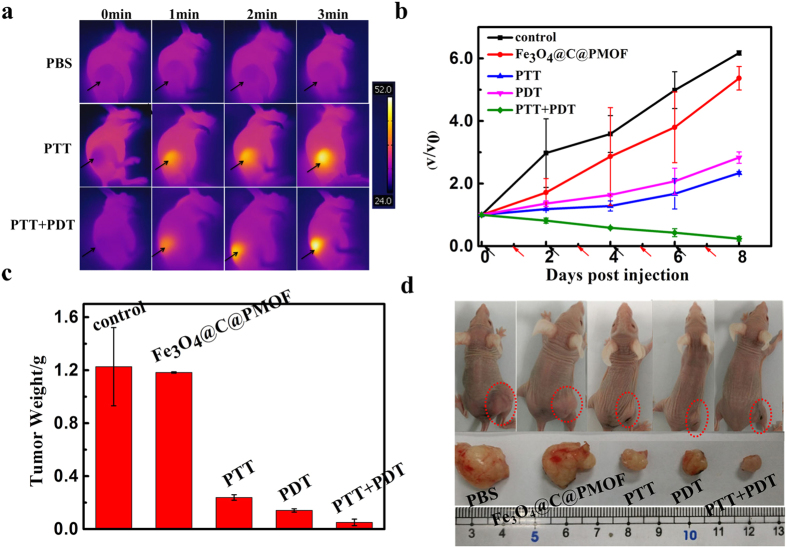
Motivated by its high tumor accumulation, Fe3O4@C@PMOF was used for in vivo imaging-guided tumor treatment. Nude mice with subcutaneous MCF-7 breast cancer xenografts were selected as model. For in vivo monitoring of the photothermal effect generated from Fe3O4@C@PMOF, the temperature change of the tumor site was recorded with infrared camera under irradiation of 808 nm laser. To study the in vivo synergetic efficiency of PTT and PDT, MCF-7 tumor-bearing mice were randomly divided into five groups. The group injected with saline was regarded as the negative control. All of the other four groups were injected with Fe3O4@C@PMOF (10 mg kg−1). The injected mice without any irradiation were used as the positive control. After the injection for 26 h, the irradiation was carried out. In PTT group, the mice after injection with Fe3O4@C@PMOF were irradiated with 808 nm laser for 10 min; the mice in PDT group were subjected to the irradiation of 655 nm laser for 10 min. In the PTT-PDT co-therapy group, the mice were firstly irradiated with 808 nm laser for 10 min, followed by the irradiation of 655 nm laser for 10 min. Upon 808 nm laser irradiation, the temperature of the tumor site in the PTT and PTT-PDT co-therapy groups rapidly increased to higher than 50 °C, which is high enough to ablate the cancer cells. For the negative control groups, the tumor tissues didn’t show any significant temperature elevation (Fig. 7a). The injection and irradiation were repeated every two days within 8 days. Tumor sizes and body weights of the mice were monitored every two day after different treatments (Fig. 7b and Supplementary Fig. S11). The size of tumors was normalized to their initial size. Experimental results indicated that the tumor sizes of mice in both negative and positive control groups became larger and larger. In contrast, the tumor growth of the mice after single PTT or PDT inhibited remarkably within 8 days. The PTT-PDT co-therapy group exhibited the highest therapeutic efficacy compared with that of the single PTT or PDT groups. (Fig. 7b and d).
Figure 7. Photothermal and photodynamic synergetic therapy.
(a) Infrared thermal images of tumor-bearing mice injected with Fe3O4@C@PMOF (10 mg kg−1) or PBS after exposed to 808 nm laser and 808 nm + 655 nm lasers recorded at different time intervals. (b) Tumor growth inhibition curve after treatment. V0 and V refer to tumor volumes before and after PTT and/or PDT treatment with Fe3O4@C@PMOF as probe. Black and red arrows refer to injection and irradiation time points, respectively. (c) Tumor weight after treatment for eight days. (d) Representative photograph of tumor-bearing mice after different treatments. Error bars represent the standard deviations of three mice per group.
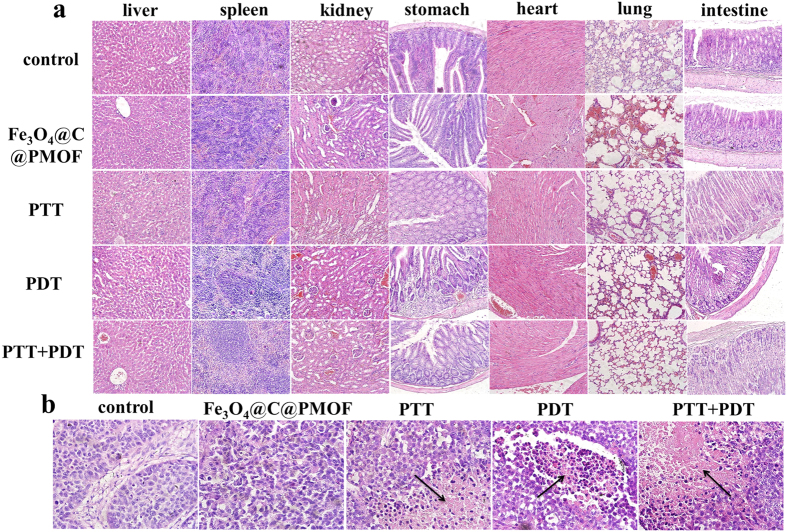
Apoptotic and necrotic tumor cells were tested to validate the photo-therapy efficiency (Fig. 8b). Intensive necrosis area was markedly stained by eosin in the dominated tumor section of PTT-PDT treatment group. The results clearly demonstrated that the synergetic therapeutic efficacy of PTT and PDT was superior to any single therapy. The mice after PTT and PDT treatment behaved normally and the weight didn’t decrease remarkably (Supplementary Fig. S11). No pathological changes was noticed for mice after 8 days after PTT and/or PDT, as revealed by hematoxylin and eosin (H&E)-stained major organ slices of the mice because of the excellent biocompatibility of the nanocomposites and the remote controllability, improved selectivity, and safety of phototherapy.
Figure 8.
Hematoxylin and eosin (H&E)-stained slices of (a) major organs and (b) tumor tissue of the mice after 8 days with different treatments. No pathological changes were noticed from the major organs after 8 days after PTT and/or PDT because of the excellent biocompatibility of the nanocomposites. The black arrows refer to necrosis part of tumor. It was obvious that intensive necrosis area was stained by eosin in the dominated tumor section of PTT-PDT treatment group.
Discussion
In summary, we developed Fe3O4@C@PMOF for fluorescence-magnetic resonance dual-modality imaging-guided photothermal and photodynamic cancer dual-therapy by in situ growth PMOF shell on Fe3O4@C core for the first time. The Fe3O4@C@PMOF nanocomposites featured with some unique advantages over common therapy agents, such as high biocompatibility and stability, and simple self-assembly process to form the MOF shell with the abundant carboxylic groups in the periphery of Fe3O4@C to interact with Zr4+ ions. Effective photothermal and photodynamic therapy of tumors was achieved by passive tumor targeting and excellent photophysical properties of the nanocomposites. Besides, the improved safety and low bio-toxicity of phototherapy, different to chemotherapy, had no damage to normal tissues because of the controllable and local irradiation of the laser. Both irradiation and emission of photo-therapy and fluorescence imaging were around infrared or NIR region, so high penetration depth achieved the efficient photo-therapy and imaging. Fe3O4@C@PMOF with low biotoxicity shows promise for future clinical translation as validated by the dual-modality imaging-guiding synergetic therapy. The results demonstrate the availability of as-synthesized MCTPs on tumor and illustrate great potential in tumor diagnosis and treatment.
Methods
Animal experiments
To validate the dual-modality imaging-guided photothermal and photodynamic dual-therapy, we used female BALB/c-nu mice with the body weight of 18–22 g as model. The mice were obtained from the Institute of Hematology & Hospital of Blood Disease, Chinese Academy of Medical Sciences & Peking Union Medical College with the license No. SCXK-2014-0013, Tianjin, China. The mice were housed one per cage in a specific pathogen-free environment and had free access to standard solid pellet food (HFK, Beijing, China) and water. We confirmed that all experimental protocols were approved by the Institutional Animal Care Committee of Nankai University and all methods were carried out in accordance with the relevant guidelines and regulations from the Institutional Animal Care Committee of Nankai University.
Synthesis of Fe3O4@C nanospheres
Fe3O4@C micro-structure was fabricated by one-pot solvothermal strategy according to previous report31. Briefly, 0.08 g of ferrocene was dissolved in 32 mL acetone. 0.4 mL of 30% hydrogen peroxide was added and the mixture solution was transferred to a 50 mL Teflon-lined stainless autoclave. The mixture was then kept at 210 °C for 24 h. After the autoclave was cooled to room temperature, the products were collected by a magnet after ultrasonication for 20 min. Black solid was washed with acetone and ethanol three times and dried in vacuum at 40 °C for 24 h to obtain Fe3O4@C nanospheres.
Preparation of Fe3O4@C@PMOF
1 mL of ZrCl4 dimethyl formamide (DMF) solution (2.6 mmol L−1) was added to the suspension of 10 mg Fe3O4@C nanospheres in 5 mL DMF. The mixture was transferred to a 25 mL three-necked flask and kept at 120 °C with vigorous stirring for 30 min. Then, 100 μL of TCPP DMF solution (38 μmol L−1) was added drop-wise into the mixture in 2 min. The reaction proceeded for another 3 h at 120 °C. The product was collected magnetically and washed with DMF and ethanol and dried for further use.
In vitro singlet oxygen generation
The singlet oxygen (1O2) generation capacity of Fe3O4@C@PMOF was tested using 9, 10-anthracenediyl-bis (methylene) dimalonic acid (ABDA) method after laser irradiation. 1O2 generated from Fe3O4@C@PMOF oxidizes ABDA to decrease its UV absorption. PBS (pH 7.4) containing 20 μmol L−1 Fe3O4@C@PMOF and 200 μmol L−1 ABDA was therefore irradiation with 655 nm laser (0.3 W cm−2). The absorbance spectra of solution were recorded at different time points. The stability of ABDA to PBS, light, and single Fe3O4@C@PMOF was also tested as control.
Cytotoxicity and photoxicity of Fe3O4@C@PMOF
The cytotoxicity and photoxicity of Fe3O4@C@PMOF were evaluated by the viability of MCF-7 cells using a standard methyl thiazolyl tetrazolium (MTT) assay. Four groups were tested separately with different treatments. Briefly, the cells were incubated to 96-well culture plates at a density of 5 × 10³ cells per well in culture medium. Fe3O4@C@PMOF was introduced to the medium at the concentration between 0 and 400 μg mL−1 and incubated for 8 h after MCF-7 cells reached 90–95% confluences. Then, the PDT and PTT groups were under 655 nm for 10 min (0.3 W cm−2) and 808 nm irradiation for 10 min (1.0 W cm−2), respectively. The PDT-PTT dual-therapy group was firstly under 808 nm irradiation for 10 min and then 655 nm for 10 min. N, N’-dimethyl sulfoxide (150 μL) was used to completely liberate the formazan crystals. The absorbance at 490 nm was measured to calculate the cell viability.
In vitro MR test with Fe3O4@C@PMOF as probe
In vitro MR imaging with Fe3O4@C@PMOF as probe was carried out at different Fe concentrations (0.07, 0.14, 0.28, 0.56, 1.12 mM) with a 1.2 T MR Imaging System, Huantong, Shanghai, China. The T2 value could be tested directly with the 1.2 T MR imaging system, and Fe content of Fe3O4@C@PMOF was determined by inductively coupled plasma-atomic emission spectroscopy. The slope of the linear fitting equation between 1/T2 and Fe content was the r2 value. Images were recorded using a 50 mm animal coil and a 2D gradient imaging sequence. The MR parameters were described as follows: spin-echo T2-weighted MR sequence, TR/TE = 5000/64.6 ms, FOV = 50 × 80 mm2, matrix = 512 × 256, slice thickness = 0.4 mm, 30.0 °C.
In vivo MR imaging
In vivo MR imaging was performed on the mice or MCF-7 tumor-bearing mice anesthetized with 4% chloral hydrate (6 mL kg−1). After intravenous injection of Fe3O4@C@PMOF solution (20 mg kg−1) into the mice, the MR images were recorded by positioning the mice on the animal plate of imaging system. The MR imaging was recorded on a 1.2 T MR imaging system, Huantong, Shanghai, China. Images were obtained using a small animal coil, before and at subsequent intervals following injection with the imaging sequence: TR/TE = 300/32.6 ms; FOV = 50 mm × 80 mm; matrix = 512 × 256; slice thickness = 0.4 mm without gap; 128 coronal or axial slices. To study the contents of nanocomposites in excretion of mice, mice after intravenous injection with Fe3O4@C@PMOF were housed in metabolic cages to collect their urine and feces. The collected urine and feces were digested by chloroazotic acid and measured by ICP-AES.
In vivo fluorescence imaging
In vivo fluorescence images of nude mice and tumor-bearing mice were recorded after anesthetized with 4% chloral hydrate (6 mL kg−1). After intravenous injection of Fe3O4@C@PMOF solution (20 mg kg−1) into the mice, the fluorescence images were recorded with NightOWL LB 983 small animal in vivo imaging system (Berthold Technologies GmbH & Co. KG, Germany) with the optimal wavelength of PMOF (Ex = 550 nm, Em = 660 nm). The data were treated with IndiGO software.
PTT-PDT dual-therapy of tumor-bearing mice with Fe3O4@C@PMOF as probe
The efficiency of PTT-PDT dual-therapy of Fe3O4@C@PMOF was tested with tumor-bearing mice (18−22 g, n = 3 per group) as model after anesthetized with 4% chloral hydrate (6 ml kg−1). The mice were separated into five groups. The mice injected intravenously with saline were used as negative control, while the mice injected with Fe3O4@C@PMOF (10 mg kg−1) without any laser irradiation were used as positive control. The other mice injected with Fe3O4@C@PMOF were subjected to laser irradiation for PTT, PDT, and PTT-PDT dual-therapy, respectively. The distribution of Fe3O4@C@PMOF was monitored with fluorescent imaging. When the signal of Fe3O4@C@PMOF reached zenith at the tumor site, the tumor site of the mice in PDT group were irradiated with 655 nm laser for 10 min (0.3 W cm−2), while the mice in PTT group were irradiated under 808 nm laser for 10 min (1.0 W cm−2). The mice in PTT-PDT dual-therapy group were firstly irradiated under 808 nm laser for 10 min (1.0 W cm−2) and then 655 nm laser (0.3 W cm−2) for 10 min, respectively. The weights and tumor sizes of the mice were monitored simultaneously. The tumor volumes were calculated as (width2 × length)/2 based on the previous report28. The main organs of mice were collected after treatment for 8 days. Hematoxylin and eosin (H&E) stained images were used to investigate the biotoxicity. The body weights of the mice were assessed with a counter balance within 8 days.
Additional Information
How to cite this article: Zhang, H. et al. Fluorescence and Magnetic Resonance Dual-Modality Imaging-Guided Photothermal and Photodynamic Dual-Therapy with Magnetic Porphyrin-Metal Organic Framework Nanocomposites. Sci. Rep. 7, 44153; doi: 10.1038/srep44153 (2017).
Publisher's note: Springer Nature remains neutral with regard to jurisdictional claims in published maps and institutional affiliations.
Supplementary Material
Acknowledgments
This work was supported by National Natural Science Foundation of China (Grants 21675090, 21435001, and 21375064), 973 projects (2015CB932001), and Tianjin Natural Science Foundation (15ZCZDSF00060).
Footnotes
The authors declare no competing financial interests.
Author Contributions X.B.Y. and H.Z. conceived and designed the study. X.B.Y. supervised the work. H.Z., Y.H.L., and Y.C. conducted the experiments. X.B.Y., H.Z., M.M.W., and X.S.W. analyzed the data. X.B.Y. and H.Z. wrote the paper. All authors discussed the results and commented on the manuscript and the manuscript reflected the contributions of all the authors.
References
- Torre L. A. et al. Global cancer statistics, 2012. CA- Cancer J. Clin. 65, 87–108, doi: 10.3322/caac.21262 (2015). [DOI] [PubMed] [Google Scholar]
- Yang P., Gai S. & Lin J. Functionalized mesoporous silica materials for controlled drug delivery. Chem. Soc. Rev. 41, 3679–3698, doi: 10.1039/C2CS15308D (2012). [DOI] [PubMed] [Google Scholar]
- Cheng L., Wang C., Feng L., Yang K. & Liu Z. Functional nanomaterials for phototherapies of cancer. Chem. Rev. 114, 10869–10939, doi: 10.1021/cr400532z (2014). [DOI] [PubMed] [Google Scholar]
- Zhang M. et al. Fabrication of ZnPc/protein nanohorns for double photodynamic and hyperthermic cancer phototherapy. Proc. Natl. Acad. Sci. USA 105, 14773–14778, doi: 10.1073/pnas.0801349105 (2008). [DOI] [PMC free article] [PubMed] [Google Scholar]
- Jang B., Park J.-Y., Tung C.-H., Kim I.-H. & Choi Y. Gold nanorod−photosensitizer complex for near-infrared fluorescence imaging and photodynamic/photothermal therapy in vivo. ACS Nano 5, 1086–1094, doi: 10.1021/nn102722z (2011). [DOI] [PubMed] [Google Scholar]
- Chung U. S. et al. Dendrimer porphyrin-coated gold nanoshell for synergistic combination of photodynamic and photothermal therapy. Chem. Commun. 52, 1258–1261, doi: 10.1039/C5CC09149G10.1039/x0xx00000x (2016). [DOI] [PubMed] [Google Scholar]
- Lin J. et al. Photosensitizer-loaded gold vesicles with strong plasmonic coupling effect for imaging-guided photothermal/photodynamic therapy. ACS Nano 7, 5320–5329, doi: 10.1021/nn4011686 (2013). [DOI] [PMC free article] [PubMed] [Google Scholar]
- He F. et al. A new single 808 nm NIR light-induced imaging-guided multifunctional cancer therapy platform. Adv. Funct. Mater. 25, 3966–3976, doi: 10.1002/adfm.201500464 (2015). [DOI] [Google Scholar]
- Chen Y. et al. Polydopamine-based coordination nanocomplex for T1/T2 dual mode magnetic resonance imaging-guided chemo-photothermal synergistic therapy. Biomaterials 77, 198–206, doi: 10.1016/j.biomaterials.2015.11.010 (2016). [DOI] [PubMed] [Google Scholar]
- Yang G. et al. Two-dimensional magnetic WS2@Fe3O4 nanocomposite with mesoporous silica coating for drug delivery and imaging-guided therapy of cancer. Biomaterials 60, 62–71, doi: 10.1016/j.biomaterials.2015.04.053 (2015). [DOI] [PubMed] [Google Scholar]
- Harrison V. S. R., Carney C. E., MacRenaris K. W., Waters E. A. & Meade T. J. Multimeric near IR–MR contrast agent for multimodal in vivo imaging. J. Am. Chem. Soc. 137, 9108–9116, doi: 10.1021/jacs.5b04509 (2015). [DOI] [PMC free article] [PubMed] [Google Scholar]
- Kim J. S. et al. Self-assembled hybrid nanoparticles for cancer-specific multimodal imaging. J. Am. Chem. Soc. 129, 8962–8963, doi: 10.1021/ja073062z (2007). [DOI] [PMC free article] [PubMed] [Google Scholar]
- Ju Q. et al. Amine-functionalized lanthanide-doped KGdF4 nanocrystals as potential optical/magnetic multimodal bioprobes. J. Am. Chem. Soc. 134, 1323–1330, doi: 10.1021/ja2102604 (2012). [DOI] [PubMed] [Google Scholar]
- Wang S. et al. Single continuous wave laser induced photodynamic/plasmonic photothermal therapy using photosensitizer-functionalized gold nanostars. Adv. Mater. 25, 3055–3061, doi: 10.1002/adma.201204623 (2013). [DOI] [PMC free article] [PubMed] [Google Scholar]
- Kuo W. S. et al. Gold nanorods in photodynamic therapy, as hyperthermia agents, and in near-infrared optical imaging. Angew. Chem. Int. Ed. 49, 2711–2715, doi: 10.1002/anie.200906927 (2010). [DOI] [PubMed] [Google Scholar]
- Gao W. Y., Chrzanowski M. & Ma S. Metal-metalloporphyrin frameworks: a resurging class of functional materials. Chem. Soc. Rev. 43, 5841–5866, doi: 10.1039/c4cs00001c (2014). [DOI] [PubMed] [Google Scholar]
- Ethirajan M., Chen Y., Joshi P. & Pandey R. K. The role of porphyrin chemistry in tumor imaging and photodynamic therapy. Chem. Soc. Rev. 40, 340–362, doi: 10.1039/b915149b (2011). [DOI] [PubMed] [Google Scholar]
- Xu H. et al. Nanoscale optical probes for cellular imaging. Chem. Soc. Rev. 43, 2650–2661, doi: 10.1039/c3cs60309a (2014). [DOI] [PubMed] [Google Scholar]
- Yuan Y., Zhang C.-J., Xu S. & Liu B. A self-reporting AIE probe with a built-in singlet oxygen sensor for targeted photodynamic ablation of cancer cells. Chem. Sci. 7, 1862–1866, doi: 10.1039/c5sc03583j (2016). [DOI] [PMC free article] [PubMed] [Google Scholar]
- Sun C., Lee J. S. & Zhang M. Magnetic nanoparticles in MR imaging and drug delivery. Adv. Drug. Deliv. Rev 60, 1252–1265, doi: 10.1016/j.addr.2008.03.018 (2008). [DOI] [PMC free article] [PubMed] [Google Scholar]
- Lee N. & Hyeon T. Designed synthesis of uniformly sized iron oxide nanoparticles for efficient magnetic resonance imaging contrast agents. Chem. Soc. Rev. 41, 2575–2589, doi: 10.1039/c1cs15248c (2012). [DOI] [PubMed] [Google Scholar]
- Sun C. et al. PEG-mediated synthesis of highly dispersive multifunctional superparamagnetic nanoparticles: their physicochemical properties and function in vivo. ACS Nano 4, 2402–2410, doi: 10.1021/nn100190v (2010). [DOI] [PMC free article] [PubMed] [Google Scholar]
- Kievit F. M. & Zhang M. Surface engineering of iron oxide nanoparticles for targeted cancer therapy. Acc. Chem. Res. 44, 853–862, doi: 10.1021/ar2000277 (2011). [DOI] [PMC free article] [PubMed] [Google Scholar]
- Chen H. W. et al. Highly crystallized iron oxide nanoparticles as effective and biodegradable mediators for photothermal cancer therapy. J. Mater. Chem. B 2, 757–765, doi: 10.1039/c3tb21338b (2014). [DOI] [PubMed] [Google Scholar]
- Chu M. et al. Near-infrared laser light mediated cancer therapy by photothermal effect of Fe3O4 magnetic nanoparticles. Biomaterials 34, 4078–4088, doi: 10.1016/j.biomaterials.2013.01.086 (2013). [DOI] [PubMed] [Google Scholar]
- Fang Y. et al. A low-concentration hydrothermal synthesis of biocompatible ordered mesoporous carbon nanospheres with tunable and uniform size. Angew. Chem. Int. Ed. 49, 7987–7991, doi: 10.1002/anie.201002849 (2010). [DOI] [PubMed] [Google Scholar]
- Lu A.-H., Hao G.-P., Sun Q., Zhang X.-Q. & Li W.-C. Chemical synthesis of carbon materials with intriguing nanostructure and morphology. Macromol. Chem. Phys. 213, 1107–1131, doi: 10.1002/macp.201100606 (2012). [DOI] [Google Scholar]
- Lu K., He C. & Lin W. Nanoscale metal-organic framework for highly effective photodynamic therapy of resistant head and neck cancer. J. Am. Chem. Soc. 136, 16712–16715, doi: 10.1021/ja508679h (2014). [DOI] [PMC free article] [PubMed] [Google Scholar]
- Hu J. et al. Nanocomposite-based photodynamic therapy strategies for deep tumor treatment. Small 11, 5860–5887, doi: 10.1002/smll.201501923 (2015). [DOI] [PubMed] [Google Scholar]
- Feng D. et al. A highly stable porphyrinic zirconium metal-organic framework with shp-a topology. J. Am. Chem. Soc. 136, 17714–17717, doi: 10.1021/ja510525s (2014). [DOI] [PubMed] [Google Scholar]
- An Q. et al. Multifunctional magnetic Gd3+−based coordination polymer nanoparticles: combination of magnetic resonance and multispectral optoacoustic detections for tumor-targeted imaging in vivo. Small 11, 5675–5686, doi: 10.1002/smll.201501491 (2015). [DOI] [PubMed] [Google Scholar]
- Ke F., Qiu L.-G., Yuan Y.-P., Jiang X. & Zhu J.-F. Fe3O4@MOF core–shell magnetic microspheres with a designable metal–organic framework shell. J. Mater. Chem. 22, 9497–9500, doi: 10.1039/c2jm31167d (2012). [DOI] [Google Scholar]
- Zhang N. et al. Synthesis of metal-organic-framework related core-shell heterostructures and their application to ion enrichment in aqueous conditions. Chem. Commun. 50, 7686–7689, doi: 10.1039/c4cc00900b (2014). [DOI] [PubMed] [Google Scholar]
- Chiarelli P. A., Kievit F. M., Zhang M. & Ellenbogen R. G. Bionanotechnology and the future of glioma. Surg. Neurol. Int. 6, S45–58, doi: 10.4103/2152-7806.151334 (2015). [DOI] [PMC free article] [PubMed] [Google Scholar]
- Alexis F., Pridgen E., Molnar L. K. & Farokhzad O. C. Factors affecting the clearance and biodistribution of polym eric nanoparticles. Mol. Pharmaceutics 5, 505–515, doi: 10.1021/mp800051m (2008). [DOI] [PMC free article] [PubMed] [Google Scholar]
- Antoni P. M. et al. (Metallo) porphyrins as potent phototoxic anti-cancer agents after irradiation with red light. Chem. Eur. J. 21, 1179–1183, doi: 10.1002/chem.201405470 (2015). [DOI] [PubMed] [Google Scholar]
- Liu J. et al. Real-time in vivo quantitative monitoring of drug release by dual-mode magnetic resonance and upconverted luminescence imaging. Angew. Chem. Int. Ed. 53, 4551–4555, doi: 10.1002/anie.201400900 (2014). [DOI] [PubMed] [Google Scholar]
- Liu J. et al. A high-performance imaging probe with NIR luminescence and synergistically enhanced T1-T2 relaxivity for in vivo hepatic tumor targeting and multimodal imaging. Chem. Commun. 51, 13369–13372, doi: 10.1039/c5cc04911c (2015). [DOI] [PubMed] [Google Scholar]
- Zhao Z. et al. Octapod iron oxide nanoparticles as high-performance T2 contrast agents for magnetic resonance imaging. Nat. Commun. 4, 2266, doi: 10.1038/ncomms3266 (2013). [DOI] [PubMed] [Google Scholar]
- Xu J., Zeng F., Wu H., Yu C. & Wu S. Dual-targeting nanosystem for enhancing photodynamic therapy efficiency. ACS Appl. Mater. Interfaces 7, 9287–9296, doi: 10.1021/acsami.5b02297 (2015). [DOI] [PubMed] [Google Scholar]
- Planas O., Macia N., Agut M., Nonell S. & Heyne B. Distance-dependent plasmon-enhanced singlet oxygen production and emission for bacterial inactivation. J. Am. Chem. Soc. 138, 2762–2768, doi: 10.1021/jacs.5b12704 (2016). [DOI] [PubMed] [Google Scholar]
- Krivosheev A. B., Kondratova M. A., Krivosheeva T. A., Kupriianova L. & Khvan L. A. The porphyrin metabolism in liver cirrhosis. Ter Arkh 85, 48–55, (2013). [PubMed] [Google Scholar]
Associated Data
This section collects any data citations, data availability statements, or supplementary materials included in this article.


