

Abstract
Background and Purpose
Cathepsin K (CatK) is a major drug target for the treatment of osteoporosis. Potent active site‐directed inhibitors have been developed and showed variable success in clinical trials. These inhibitors block the entire activity of CatK and thus may interfere with other pathways. The present study investigates the antiresorptive effect of an exosite inhibitor that selectively inhibits only the therapeutically relevant collagenase activity of CatK.
Experimental Approach
Human osteoclasts and fibroblasts were used to analyse the effect of the exosite inhibitor, ortho‐dihydrotanshinone (DHT1), and the active site inhibitor, odanacatib (ODN), on bone resorption and TGF‐ß1 degradation. Cell cultures, Western blot, light and scanning electron microscopy as well as energy dispersive X‐ray spectroscopy, molecular modelling and enzymatic assays were used to evaluate the inhibitors.
Key Results
DHT1 selectively inhibited the collagenase activity of CatK, without affecting the viability of osteoclasts. Both inhibitors abolished the formation of resorption trenches, with DHT1 having a slightly higher IC50 value than ODN. Maximal reductions of other resorption parameters by DHT1 and ODN were comparable, respectively 41% and 33% for total resorption surface, 46% and 48% for resorption depths, and 83% and 61% for C‐terminal telopetide fragment (CTX) release. DHT1 did not affect the turnover of fibrosis‐associated TGF‐ß1 in fibroblasts, whereas 500 nM ODN was inhibitory.
Conclusions and Implications
Our study shows that an exosite inhibitor of CatK can specifically block bone resorption without interfering with other pathways.
Abbreviations
- CatK
cathepsin K
- CTX
C‐terminal telopetide fragment
- DHT1
dihydrotanshinone 1
- GAGs
glycosaminoglycans
- OC
osteoclast
- ODN
odanacatib
- SEM
scanning electron microscopy
- TRACP
tartrate‐resistant acid phosphatase
Tables of Links
| TARGETS |
| Cathepsin K (CatK) |
| Collagenase |
| Gelatinase |
These Tables list key protein targets and ligands in this article which are hyperlinked to corresponding entries in http://www.guidetopharmacology.org, the common portal for data from the IUPHAR/BPS Guide to PHARMACOLOGY (Pawson et al., 2014) and are permanently archived in the Concise Guide to PHARMACOLOGY 2013/14 (Alexander et al., 2013).
Introduction
During physiological bone remodelling, multinucleated osteoclasts (OCs) and mononuclear osteoblasts balance bone resorption and formation (Delaisse, 2014; Sims and Ng, 2014). In contrast, excessive osteoclastic bone resorption leads to osteoporosis (Feng and McDonald, 2011). Cathepsin K (CatK), a lysosomal cysteine protease and the predominant collagenase expressed in OCs, is responsible for the bulk of organic bone matrix degradation. Thus, it was identified as an important drug target for the development of antiresorptives (Stoch and Wagner, 2008; Leung et al., 2011). To date, a multitude of CatK‐selective irreversible and reversible inhibitors has been synthesized and evaluated in various in vivo models (Helali et al., 2013; Chapurlat, 2014). Odanacatib (ODN) is currently the most promising and advanced reversible inhibitor of human CatK (Gauthier et al., 2008) that has been successfully tested in a phase III clinical trial (Costa et al., 2011; Chapurlat, 2014), but due to safety concerns, its regulatory approval remains on hold (http://www.mercknewsroom.com/news‐release/research‐and‐development‐news/merck‐announces‐data‐pivotal‐phase‐3‐fracture‐outcomes‐st). An intrinsic problem of active site‐directed inhibitors is the blockage of the entire proteolytic activity of a target protease such as CatK, potentially causing side effects during long‐term treatment of osteoporosis (Bromme and Lecaille, 2009). For example, recent studies have linked CatK deficiency in mice to neurobehavioural malfunctions (Dauth et al., 2011), increased susceptibility to lung fibrosis (Buhling et al., 2004) and alterations in the airway morphology (Zhang et al., 2011). These findings indicate non‐skeletal functions of CatK, where the protease is involved in pathways independent of matrix degradation (Bromme and Lecaille, 2009). Therefore, we hypothesized that inhibitors, which only block the collagenase activity of CatK, would avoid these potential problems.
Interestingly, the degradation of triple helical fibril collagen by CatK requires the formation of complexes between CatK and glycosaminoglycans (GAGs) (Li et al., 2002, 2008; Aguda et al., 2014). This opens a new approach to inhibiting collagenolysis by preventing the formation of CatK‐GAG complexes, rather than by blocking the active site of the protease. Screening natural product libraries (Guo et al., 2014), we have previously identified para‐dihydrotanshinone (DHT) as a specific collagenase inhibitor of CatK that did not interfere with the degradation of other biologically relevant substrates (Sharma et al., 2015). Molecular docking and binding experiments suggested that DHT binds to a specific exosite in CatK, which is crucial for the formation of collagenolytically active oligomers in the presence of GAGs (Cherney et al., 2011; Sharma et al., 2015). Here, we showed that the exosite inhibitor ortho‐dihydrotanshinone (DHT1) can effectively block the in vitro degradation of both soluble and insoluble collagen by CatK and inhibits OC‐mediated bone resorption with a similar morphological outcome as ODN. Moreover, we demonstrated that DHT1 does not affect the degradation of skin fibrosis‐associated TGF‐ß1, whereas ODN prevents the hydrolysis of the growth factor at pharmacologically relevant concentrations.
Methods
Collagenase assay
Soluble bovine type I collagen (0.6 mg mL‐1) was incubated with 400 nM human recombinant CatK, in the presence or absence of 200 nM chondroitin 4‐sulfate in 100 mM sodium acetate buffer, pH 5.5, containing 2.5 mM DTT and EDTA and incubated at 28°C. Soluble bovine type I collagen was purchased from USB (Cleveland, OH, USA); chondroitin 4‐sulfate was purchased from Sigma‐Aldrich (St. Louis, MO, USA). Recombinant human CatK was expressed in Pichia pastoris and purified as previously described (Linnevers et al., 1997). DHT1 inhibitor was purchased from ChemFaces (Wuhan, China) and ODN from Selleckchem.com (Houston, TX, USA). The cathepsin inhibitor E‐64 [L‐3‐carboxy‐trans‐2‐3‐epoxypropionyl‐leucylamido‐(4guanidino)‐butane] was purchased from Bio Basic Inc. (Markham, ON, Canada). The concentration of the solvents in the reaction assay was kept below 1%, where no solvent effect is observed. For the collagenase inhibition assay, various concentrations of DHT1 (0.5 to 100 μM) and ODN (0.05 to 50 μM) were tested to obtain IC50 values. Inhibitors and CatK were added at the same time at the beginning of collagenase reaction. After 4 h of incubation, 1 μM E‐64 was added to each reaction to inhibit residual activity of CatK, and samples were analysed on 10% SDS‐PAGE gels. Coomassie‐stained bands representing the residual amount of α‐collagen chains were quantitatively assessed using the GeneSnap programme (Syngene Inc., Frederick, MD, USA) and plotted against the appropriate inhibitor concentration to determine IC50 values. All assays were carried out in five independent experiments.
Gelatinase assay
Gelatin [prepared by heating soluble bovine type I collagen (0.6 mg mL‐1) at 95°C for 30 min] was incubated with 5 nM human CatK in 100 mM sodium acetate buffer, pH 5.5, containing 2.5 mM DTT and EDTA in the presence DHT1 and ODN (25 μM) at 28°C. After 1 h, 1 μM E‐64 was added to each reaction to inhibit the remaining CatK activity. Gelatin alone and gelatin with CatK with corresponding solvents were used as controls. Samples were analysed on 10% SDS‐PAGE gels. The density of the α1 band was quantified to obtain the percentage of inhibition. All assays were carried out in five independent experiments.
Molecular docking of DHT1 to CatK
The 3‐D structure of the DHT1 inhibitor was constructed using the Sybyl‐X programme (version 2.0, Tripos, St. Louis, MO, USA) and minimized using the Gasteiger–Hückel charge assignment. The resulting structure was exported to the mol2 format and used in the docking protocol. Molecular docking was performed on the CatK structure (Protein Data Base ID#: 4DMX) (Dossetter et al., 2012) using the GLIDE programme (Friesner et al., 2004) (version 6.2, Schrodinger, LLC, New York, NY, USA, 2014). To execute the docking protocol and to analyse the docking results, the Maestro user interface (version 9.7, Schrodinger, LLC, New York, NY, USA, 2014) and PyMOL (version 1.6 Schrödinger, LLC) were employed. Ligands and water molecules from structures were removed from the binding pockets. For the docking calculations, hydrogen atoms were added in standard geometry; histidine, glutamine and asparagine residues in the binding site were manually checked for orientation, protonation and tautomeric states using PyMOL 1.6 side‐chain wizard script. GLIDE grid generation wizard was used to define the docking space. The binding site was within a radius sphere of 12 Å centred on C‐γ of the Tyr87. Docking was performed using XP (Extra Precision mode) docking protocol (Friesner et al., 2006), and visual inspection was employed to select the representative conformation for the exosite inhibitor.
Insoluble collagen degradation
Collagen fibres were isolated from mouse tails and incubated with 1 μM CatK with or without 12.5 μM DHT1 and ODN in 100 mM sodium acetate buffer, pH 5.5, containing 2.5 mM DTT and EDTA at 28°C for 10 h. The reaction was stopped by adding 1 μM E‐64. The reaction mixture was analysed by 10% SDS‐PAGE analysis, and collagenase activity was quantified on the basis of released α‐chains using a densitometry method and hydroxyproline assay. For each of the assays, four independent experiments were performed. For scanning electron microscopy (SEM) analysis, fibres were rinsed with nanopure water and fixed with 2.5% glutaraldehyde, followed by extensive washing. Subsequently, fibres were dried by passing through increasing concentrations of ethanol and transferred into a critical point dryer. Upon drying, fibres were mounted on metal stubs using double‐sided carbon tape and coated with Au/Pd in Leica EM MED020 coating system (Leica Microsystems Inc., Concord, Ontario, Canada). Images form 20 fibres of each category were taken using a Helios NanoLabTM 650 (FEI, Hillsboro, OR, USA) scanning electron microscope at operating voltages between 2 and 10 KV (Panwar et al., 2013).
Cathepsin K binding assay
Insoluble murine collagen (1 mg) was incubated with 1 μM CatK in assay buffer (100 mM acetate buffer, pH 5.5, containing 2.5 mM DTT and 2.5 mM EDTA) in the absence or presence of 12.5 mM DHT1 and ODN. At time 0 and after 30 min, reaction supernatants were collected and separated by 12% SDS‐PAGE, and the amount of CatK was quantified by densitometry in four independent experiments.
Osteoclast resorption assay
Buffy coats obtained from blood donations of healthy volunteers (approved by the local ethics committee, 2007‐0019; informed consent was obtained for each donor) were used to isolate CD14+ mononuclear cells. These cells were differentiated into multinucleated OCs using α‐MEM (Invitrogen, Carlsbad, CA, USA) containing 10% FBS (Biological Industries, Kibbutz Beit‐Haemek, Israel), 1% penicillin/streptomycin, 25 ng mL‐1 M‐CSF (R&D, Abingdon, UK) and 25 ng mL‐1 RANKL (R&D) as described previously (Soe and Delaisse, 2010). For resorption assays differentiated OCs were seeded on bovine cortical bone slices (Boneslices.com, Jelling, Denmark) in 96‐well plates at a density of 100 000 cells per bone slice. Shortly thereafter, inhibitors or vehicle were added. The vehicles, DMSO and ethanol, were added at a final concentration of 0.1 and 1%, respectively, to the controls to maintain the same concentration of solvents throughout the assay. The plates were incubated for 72 h in a humidified atmosphere at 5% CO2 and 37°C. All OC assays were performed on average on four different bone slices (three to seven) for each of the donors (2–10 donors). Detailed n numbers are shown Figure Legend 4.
Analysis of bone resorption
At the end of the incubation period, aliquots from cell culture media were collected and stored at −20°C for subsequent determination of C‐terminal telopetide fragment (CTx) concentration (according to the instructions of the supplier: CrossLaps for Culture, IDS, Frankfurt, Germany) and tartrate‐resistant acid phosphatase (TRACP) activity (Boissy et al., 2005). The metabolic activity of OCs in culture medium was determined using CellTiter‐Blue Viability Assay (performed according to the instructions of the supplier; Promega, Madison, WI, USA) to compare the effects of the inhibitors on cell survival. Cells on three of the bone slices from each condition (DHT1‐treated, ODN‐treated and control group) were fixed in 4% formaldehyde and subsequently stained for TRACP activity [using acid phosphatase, leukocyte (TRAP) kit according to the manufacturer's instructions, Sigma‐Aldrich]. The bone slices were used to determine the total number of OCs (2 nuclei or more) per bone slice in all conditions. Four bone slices from each condition were incubated in filtered H2O to lyse the cells and were individually polished using a cotton stick. Subsequently, the resorption cavities were stained with toluidine blue and analysed by light microscopy. The number of resorption events, eroded bone surface area, and maximum erosion depth after hypochlorite treatment were determined as described previously (Soe and Delaisse, 2010). The resorption events were categorized into two distinct groups: round cavities were termed ‘pits’, and elongated excavations were termed ‘trenches’ (at least twice as long as wide) as described previously (Soe and Delaisse, 2010). The reasoning behind these categories is that they recently showed a marked difference in sensitivity to CatK inhibition (Soe et al., 2013). The eroded bone surface area was determined using a 100‐point grid eyepiece graticule. All light microscopic analyses were performed using an Olympus BX53 microscope (Olympus, Tokyo, Japan). The IC50 values were determined from five bone slices per inhibitor concentration from three donors for ODN and two donors for DHT1.
Ultrastructural and microchemical analysis of resorption cavities
Resorption lacunae formed by OCs in the presence or absence of inhibitors were analysed by SEM. After 72 h incubation with OCs, bone slices were washed in water, and OCs were detached carefully with a cotton swab. Bone slices were fixed in 2.5% glutaraldehyde, and samples for SEM were prepared as previously described for collagen fibres (Panwar et al., 2013). Microchemical analysis of hydroxyapatite elements present in the lacunae in both untreated and inhibitor‐treated conditions was performed using a scanning electron microscope equipped with energy dispersive X‐ray spectroscopy at an accelerating voltage of 8 kV and beam current of 6.4 nA. Bone discs were mounted on a metal stub with adhesive tape, coated with carbon, and energy dispersive X‐ray spectroscopy spectra were collected using point analysis and whole scan method to quantify the amount of calcium and phosphorous (Bertazzo et al., 2013). A total of 25 resorption cavities in each condition were analysed at 10 spots per cavity for elemental quantification.
TGF‐ß1 degradation by fibroblasts
Human skin fibroblasts were kindly provided by Dr Hakkinen (Faculty of Dentistry, University of British Columbia, Canada). Fibroblasts were cultured in DMEM medium containing 10% FBS at 37°C in a humidified atmosphere containing 5% CO2. To enhance matrix synthesis, 10 μg mL‐1 ascorbic acid was added. Cells were seeded in a six‐well plate for each condition. After 24 h, incubation media were removed, and cells were washed twice with warm PBS to remove any traces of serum. Inhibitor treatment was given at the same time when cells were switched to serum‐free medium. Concentrations between 100 nM and 10 μM of DHT1 and ODN were tested in these experiments to see the effect of inhibitors on the fibroblasts’ viability, structure, growth, function and accumulation of TGF‐β1 under different conditions. Additionally, a protease inhibitor cocktail (Sigma) was also tested to compare its effects with active and exosite inhibitors. Cell titre blue assay was used to determine cell viability. For structural analysis, cells were stained with phalloidin and DAPI stain. Total protein of fibroblasts (5 × 10⁶) treated with DHT1, ODN and protease inhibitors at different concentrations were collected after 48 h and quantified using the micro BSA method (Bio‐Rad, Richmond, CA, USA). Cells were lysed using RIPA buffer containing a protease inhibitor cocktail to obtain endogenous proteins, and cell lysates containing 30 μg of protein in each condition were subjected to SDS‐PAGE analysis. After electrophoresis, proteins were electroblotted onto the nitrocellulose membrane and blocked for 2 h at room temperature in 10 mmol L‐1 Tris (pH 8.0) containing 150 mmol L‐1 NaCl, 0.1% Tween 20, 5% skimmed milk or 1% BSA. Detection of TGF‐β1 and β‐actin was performed after overnight incubation at 4°C, with human anti‐TGF‐β1 primary antibody (G1221, Promega BioSciences, LLC San Luis Obispo, CA, USA) and anti‐β‐actin antibody (622102, BioLegend, San Diego, USA) diluted at 1:1000. After extensive washes, HRP‐conjugated anti‐IgG antibody (W4018, Promega) was added at 1:2500 dilution and incubated for 2 h at room temperature. After five washes proteins were visualized using an enhanced chemiluminescence assay kit (GE Healthcare Life Sciences, Piscataway, NJ, USA). Densitometry analysis was carried out to compare the active TGF‐β1 band intensity under different conditions. The TGF‐β1 content in cell culture supernatants was determined by ELISA. Fibroblasts were grown in six‐well plates for 48 h, and cells supernatant was removed; protease inhibitor cocktail was added to prevent further degradation and concentrated using 3 K concentrators. Both supernatants and cell lysate were analysed for TGF‐β1 using a human TGF‐β1 ELISA kit (R&D Systems, Minneapolis, MN, USA). Results are dexpressed as pg TGF‐β1 μg‐1 total cell protein measured by the micro BSA method. All assays were carried out in four independent experiments.
Statistical analyses
We have used one‐way ANOVA for the statistical analyses of osteoclastic bone resorption assays in Figure 4. In Figure 4A to G, a Kruskal–Wallis test was used for ODN and DHT1 data sets separately [this non‐parametric one‐way ANOVA was used due to the low number of samples per condition (5 or less), thus the statistics indicate if inhibition with the two doses tested was statistically different compared with the respective control]. In Figure 4, a Mann–Whitney test was used [this non‐parametric test was used due to the low number of samples per condition (7), thus the statistics indicate whether the difference between the control and the inhibitor concentration used is statistically significant]. In Figure 5, non‐linear regression analyses were used to find the best fitting curve to the data set using an F‐test to compare and chose the best fitting equation. In the figure legend, which non‐linear fit was used to analyse the inhibition profile of ODN and DHT1, respectively, is highlighted. We have used one‐way ANOVA to determine the statistical difference in Figure 2 and E. In Figure 7, we have used one‐way ANOVA analyses to determine the inhibition with different doses of inhibitors tested were statistically different compared with the respective control. In Figure 7 and H data points were fitted to Boltzmann sigmoidal curves using non‐linear regression analyses. graphpad Prism version 4.01 was used for these statistical tests. P < 0.05 or smaller was taken as the significance level. Data are presented as mean ± SD.
Figure 4.
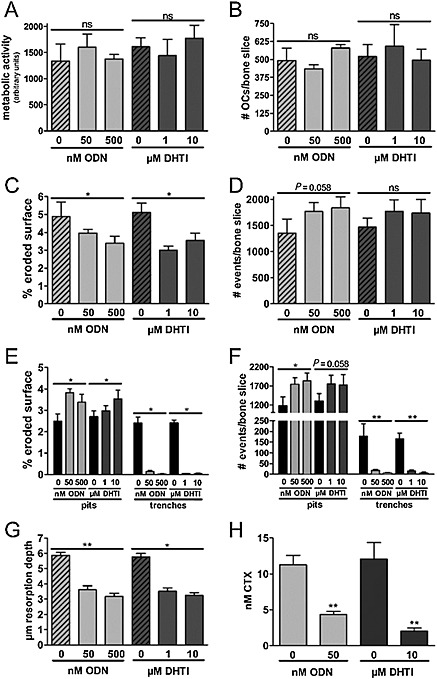
Effect of DHT1 and ODN on bone resorption parameters. The effect of DHT1 and ODN at different concentrations was observed on the basis of resorption cavities generated by human OCs, cultured on bovine bone slices for 72 h. (A–H) Represent data obtained from the same experiment. (A) Metabolic activity of OCs after treatment with DHT1 (three bone slices for each of three donors) and ODN (three bone slices for each of six donors) when compared with untreated OCs (three bone slices for each of six donors). (B) TRAP‐positive OCs with two nuclei or more were counted manually using light microscopy (three bone slices for each of three donors for each condition). The number of TRACP‐positive multinucleated OCs was unaffected by the use of either inhibitor. (C) Effect of DHT1 (five bone slices for each of six donors) and ODN (five bone slices for each of 10 donors) on the % eroded surface. (D) Effect of inhibitors on total number of resorption events (ODN: five bone slices for each of four donors. DHT1: five bone slices for each of four donors). (E) Effect of inhibitors on the % of eroded surface in terms of trenches and pits (ODN: five bone slices for each of 10 donors. DHT1: five bone slices for each of six donors). (F) Effect of inhibitors on the proportion of pits and trenches expressed in the number of resorption events per bone slice (ODN: five bone slices for each of four donors. DHT1: five bone slices for each of four donors). (G) Maximum depth measurements of resorption cavities formed by OCs showed a significant and similar reduction in maximum depth after treatment with DHT1 (five bone slices for each of three donors) and ODN (five bone slices for each of four donors). (H) Effect of both inhibitors on CTX concentration in conditioned media after 72 h in untreated, ODN (seven bone slices for each of three donors) and DHT1 (seven bone slices for each of two donors) treated cultures. Statistics (A–G) Kruskal–Wallis test; (H) Mann–Whitney test. ‘ns’, not significant; * P < 0.05; ** P < 0.01; *** P < 0.001.
Figure 2.
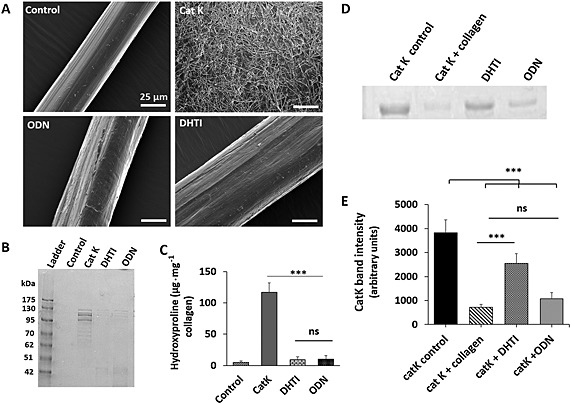
Inhibition of insoluble collagen fibre degradation by DHT1 and ODN. (A) Scanning electron micrograph of control (untreated), CatK digested (1 μM for 10 h at 28°C) and ODN (25 μM) and DHT1 (25 μM) inhibited collagen fibres. Scale bars = 25 μm. (B, C) The medium was analysed by SDS‐PAGE for degradation products, and collagenase activity was quantified on the basis of hydroxyproline levels in the medium (n = 4). (D) Binding efficacy of CatK to collagen fibres in the presence and absence of both DHT1 and ODN was analysed by SDS‐PAGE to visualize unbound CatK remaining in the medium. A representative SDS gel from four independent assays was chosen for presentation. (E) Quantification of the relative amounts of CatK from gel analysis. Statistical significance was tested with ANOVA, *** P < 0.001 versus CatK control. The binding of CatK to collagen fibres in presence of ODN was non‐significant (ns) compared with DHT1 (*** P < 0.001).
Figure 7.
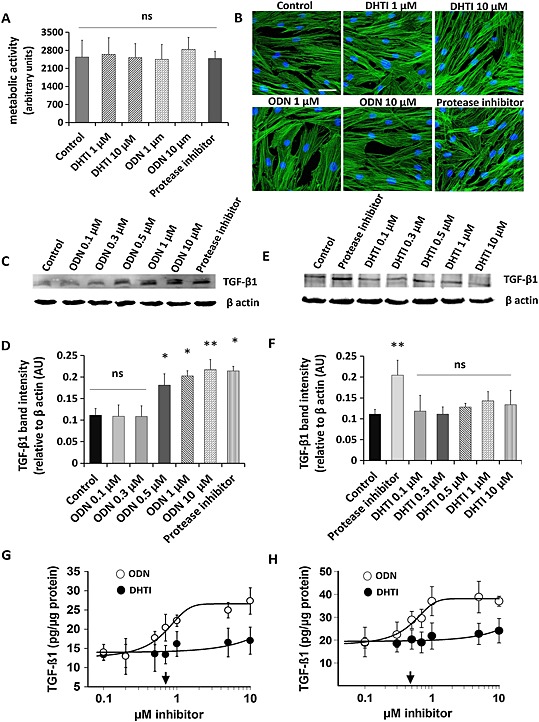
Comparative effect of DHT1 and ODN on TGF‐β1 accumulation in fibroblast cultures. (A) Effect of DHT1 and ODN inhibitors on the viability of fibroblasts. Cells were grown for 48 h under different conditions and cell viability was assayed using cell titer blue assay. (B) Control and inhibitors‐treated fibroblasts were stained with phalloidin and DAPI to observe any changes in morphology. (C–D) Western blot analysis and quantification for TGF‐β1 protein from the cell lysates isolated from fibroblasts treated with ODN and protease inhibitor cocktail at different concentration for 48 h. (E–F) Western blot analysis and quantification for TGF‐β1 protein from the cell lysates isolated from fibroblasts treated with DHT1 and protease inhibitor cocktail at different concentration for 48 h. Representative blots from four experiments are shown. Relative density of the TGF‐β1 bands normalized to β actin. TGF‐β1 quantification under control and inhibitors‐treated conditions in culture media (G) and cell lysate (H) was measured by ELISA. Total protein was corrected by total cell protein. The dose response curves revealed IC50 values of 0.711 ± 0.21 μM for ODN (arrow) in culture medium and of 0.487 ± 0.13 μM for ODN (arrow) in cell lysate. Both ELISA and Western blot analysis showed no dose response on inhibition of TGF‐β1 by DHT1 up to 10 μM, and no significant difference was observed when compared with the control (untreated condition). AU, arbitrary unit. Values are expressed as the average ± SD of four determinations. ‘ns’, not significant; * P < 0.05, ** P < 0.01, significantly different from untreated samples.
Results
Verification of DHT1 as an exosite inhibitor
Screening a natural product library and related commercially available compounds (unpublished results, D. B.), we identified DHT1 as an exosite inhibitor of CatK. The effectiveness of DHT1 as an exosite inhibitor was evaluated by assessing how well DHT1 blocks the degradation of soluble triple helical collagen, and how poorly it inhibits the CatK‐mediated degradation of non‐helical gelatin. First, we compared the response of the collagenolytic activity of CatK to increasing doses of DHT1 and the active site inhibitor, ODN. Both DHT1 and ODN inhibited collagen degradation, with IC50 values of 6.2 ± 0.7 and 0.21 ± 0.05 μM respectively (Figure 1A and B). Based on a CatK concentration of 0.4 μM in the degradation assay, the theoretical limit for an IC50 value is 0.2 μM, which would translate into a molar CatK to inhibitor ratio for DHT1 of 1:16 and ODN of 1:0.5. As expected, ODN was highly potent and reflected the maximal possible inhibition. Next, the response of CatK gelatinolytic activity in presence of DHT1 and ODN was compared. DHT1 did not inhibit gelatin hydrolysis even at a 5 000‐fold molar excess of the inhibitor (Figure 1 and Table 1). In contrast, ODN induced ~100% inhibition at the same or a much lower concentration range. This suggests that in contrast to ODN, DHT1 does not act as an active site inhibitor but rather as an exosite inhibitor.
Figure 1.
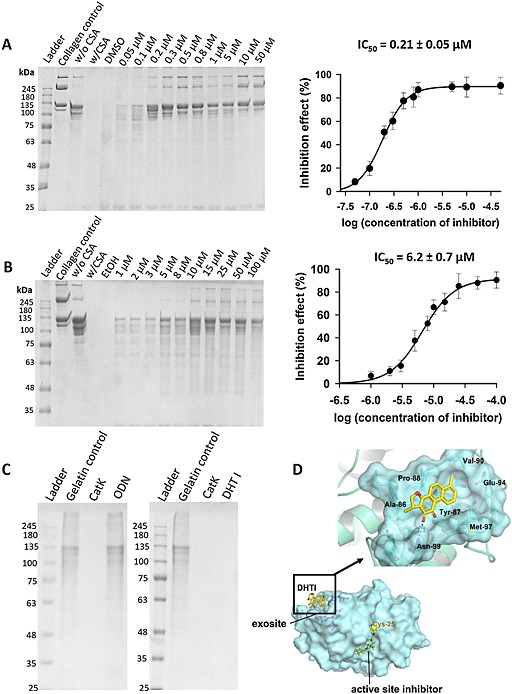
Inhibition of soluble collagen and gelatin degradation by DHT1 and ODN. SDS‐PAGE analyses and IC50 plots for type I collagen degradation with (A) active site inhibitor (ODN) and (B) exosite inhibitor (DHT1). CatK concentration was 400 nM, and digestion was performed at pH 5.5 and 28°C for 4 h. The IC50 of DHT1 was 6.2 ± 0.7 μM, and for ODN 0.21 ± 0.05 μM (n = 5). (C) SDS‐PAGE analysis of gelatin degradation with DHT1 and ODN. CatK concentration was 5 nM, and digestion was performed at pH 5.5 and 28°C for 1 h (n = 5). (D) Putative docking site of DHT1 on CatK: molecular structure of human CatK based on PDB ID, 4DMX indicates the binding site with DHT1 in the exosite region, shown in yellow. The binding site of DHT1 is remote from the active site of CatK, where an active site‐bound inhibitor is shown in green.
Table 1.
Inhibition parameters of the degradation of soluble collagen and gelatin by cathepsin K for dihydrotanshinone I (exosite inhibitor) and odanacatib (active site inhibitor)
| Inhibitor | Structure | Inhibition of collagen degradation IC50 (μM) | Inhibition of gelatin degradation (%) (25 μM) |
|---|---|---|---|
| Dihydrotanshinone I |

|
6.2 ± 0.7 | No inhibition |
| Odanacatib |

|
0.21 ± 0.05 | 95.5 ± 3.8 |
Molecular docking of DHT1 to cathepsin K
The isomer of DHT1, DHT, has been previously shown to bind in exosite 1 of CatK (Sharma et al., 2015). Exosite 1 is located in the L‐domain of the protease, and Figure 1D shows the putative binding of DHT1 in exosite 1. The exosite is remote from the active site and is thought to be critical for protein–protein interactions of collagenolytically active CatK oligomers (Cherney et al., 2011; Aguda et al., 2014). The calculated best pose of DHT1 within the CatK exosite is shown in Figure 1. A polar interaction is predicted between the side‐chain of Asn99 and the inhibitor. Specifically, the 2‐carbonyl substituent of ring C is favourably orientated to accept a hydrogen bond (3.1 Å) from the gamma nitrogen of the amide side chain of Asn99. Additionally, the non‐polar parts of DHT1 make van der Waals contacts with several structural elements of the protein, some of them establishing hydrophobic interactions with the macromolecular counterparts, which contribute to the stability of the complex. Here, aromatic rings A and B with methyl substituents are docked into the hydrophobic pocket formed by the amino acids Tyr87, Pro88 and Val90. The binding of the exosite inhibitor would prevent the dimerization of CatK into a collagenolytically active complex, which binds via collagen associate GAGs to collagen fibrils (Aguda et al., 2014).
DHT1 inhibits the degradation of insoluble fibrillar collagen
As bone collagen is organized in fibres, we analysed the inhibitory effect of DHT1 on the capability of CatK to disintegrate the collagen fibre structure. SEM analyses revealed that collagen fibres isolated from mouse tails have an average diameter of ~50 μm organized in a parallel assembly of microfibrils (Figure 2). After digestion with 1 μM CatK at 28°C for 10 h, fibril bundles were no longer tightly packed and disintegrated into nano‐fibrillar structures as previously described (Panwar et al., 2013). In the presence of either DHT1 or ODN, CatK‐treated collagen fibres remained intact but showed a slight increase in diameter (Figure 2A). Minor superficial nicks were observed, which were similar to those when collagen fibres were incubated with other non‐collagenolytic cathepsins (Panwar et al., 2013). Based on SDS‐PAGE and hydroxyproline analysis, the degradation of insoluble collagen fibres was inhibited by DHT1 and ODN by more than 95% (Figure 2B and C). The inhibitory activity of DHT1 is partially due to the prevention of CatK binding to the collagen fibres. Whereas ODN has no effect on CatK binding to collagen, DHT1 prevents ~70% of CatK binding (Figure 2D and E).
DHT1 inhibits bone resorption activity of osteoclasts
Because DHT1 and ODN prevented the collagenolytic activity of CatK in in vitro assays, we compared the effect of both inhibitors on the bone resorption activity of OCs. Figure 3 shows representative images of TRACP stained OCs (panels A and B) and resorption events on bone surfaces (panels C and D) in the absence and presence of DHT1 and ODN. In untreated cultures, OCs made long deep excavation trenches and smaller round excavation pits (Figure 3C and D at 0 M inhibitor). Increasing concentrations of DHT1 and ODN strongly affected the resorptive pattern so that only distinct clusters of small, circular pits were formed (Figure 3C and D at 50 and 500 nM ODN and 1 and 10 μM DHT1). These resorption pattern changes are a typical response of OCs to CatK inhibition as previously reported (Soe et al., 2013; Zhuo et al., 2014).
Figure 3.
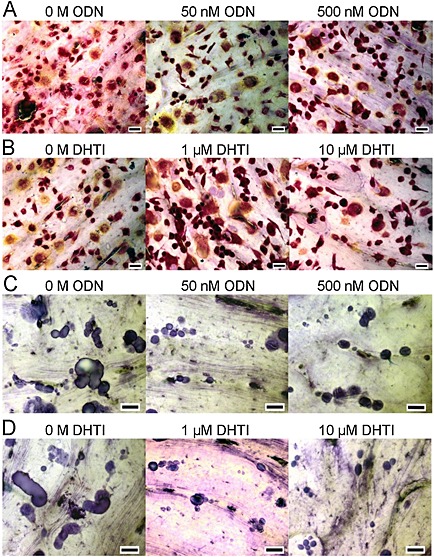
Effects of DHT1 on survival of OCs and bone resorption. OCs generated from CD14+ human mononuclear cells were cultured on bovine bone slices for 72 h (n = 7 per condition). DHT1 (at 1 and 10 μM) and ODN (at 50 and 500 nM) were added at the beginning when OCs had been allowed to attach to the bone surface. After 72 h, bone slices were processed for TRACP positive cells and resorption events quantified. Representative images of TRACP positive cells in (A) ODN‐treated (0, 50 and 500 nM) and (B) DHT1‐treated (0, 1 and 10 μM) cultures (n = 3). (C, D) The morphology of resorption pits and trenches was examined after staining with toluidine blue (n = 4 bone slices per condition). Micrographs of resorption cavities formed by OCs in untreated, DHT1‐ and ODN‐treated cultures at different concentrations. Scale bar (black line) 40 μM.
The determination of the overall metabolic activity (Figure 4) and the quantification of the total number of OCs (Figure 4) indicate that neither DHT1 nor ODN affects OC viability. However, both drugs had a pronounced effect on the resorptive activity of these cells (Figure 4). Evaluation of the resorption parameters revealed that 1 and 10 μM DHT1 very effectively reduced the total eroded surface area between 31 and 41% respectively, which was slightly better than the 19 to 33% inhibition obtained at 50 and 500 nM ODN (Figure 4). Quantification of the total number of resorption cavities showed that cultures treated with both DHT1 and ODN actually increased the total number of resorption cavities (Figure 4). This is in line with the previously reported induction of intermittent resorption (pits) at the expense of long‐duration resorption events (trenches) upon CatK inhibition (Leung et al., 2011; Soe et al., 2013; Zhuo et al., 2014). Therefore, the resorption events appearing as trenches and pits were quantified separately. Both Figure 4 (eroded surface) and F (number of events) shows that the formation of trenches was almost completely abolished in the presence of either DHT1 or ODN. In contrast, neither of the compounds inhibited the formation of pits as both the resorbed surface and number of pits increased. Thus, CatK inhibition does not seem to affect all types of OC resorption activities but rather seems to primarily block the formation of long elongated resorption trenches. This was observed with the exosite as well as with the active site‐directed inhibitor.
To compare both inhibitors in greater detail, we determined the concentrations required for obtaining half of their maximal effect on total eroded surface, trench and pit formation. The IC50 values for the overall reduction of the eroded surface were 51.5 ± 5.2 nM (DHT1) and 15.3 ± 8.8 nM (ODN) (Figure 5). Trench formation was inhibited by DHT1 with an IC50 value of 60.1 ± 0.4 nM and by ODN with an IC50 value of 14.2 ± 4.4 nM (Figure 5). Pit formation was increased, and the concentrations required for obtaining half of the maximal increase were 63.7 ± 18.7 nM for DHT1 and 17.2 ± 3.2 nM for ODN (Figure 5).
Figure 5.
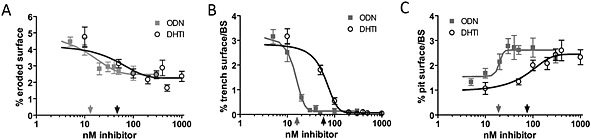
Effect of a dose titration with ODN and DHT1 on the extent of eroded surface, trench and pit formation. (A) Dose‐response curves for effects of ODN and DHT1 on eroded surface per bone surface. The data points were fitted to a one phase exponential decay curve (ODN: R 2 = 0.55; DHT1: R 2 = 0.43) and used to determine the respective IC50 concentrations of ODN: 15.3 ± 8.8 nM (indicated by light grey arrow above X‐axis) and DHT1: 51.5 ± 5.2 nM (indicated by dark grey arrow below X‐axis). (B) Effect of increasing doses of ODN and DHT1 on the extent of trench and (C) pit surface per bone surface. The data points were fitted to Boltzmann sigmoidal curves (trench response to ODN: R 2 = 0.92 and to DHT1: R 2 = 0.93; pit response to ODN: R 2 = 0.38 and to DHT1: R 2 = 0.54). These curves revealed an IC50 of 14.2 ± 4.4 nM for ODN (light grey arrow) and of 60.1 ± 0.4 nM for DHT1 (dark grey arrow) on trenches (B), and a half effect concentrations of 17.2 ± 3.2 nM for ODN (light grey arrow) and of 63.7 ± 18.7 nM for DHT1: (dark grey arrow) on pits (C). The graphs shown are from one representative experiment performed using five bone slices for each condition. The IC50 values were determined from three donors for ODN or from two for DHT1 tested in independent experiments (mean ± SD).
To assess more thoroughly how much bone resorption is affected by the inhibitors, it is important to analyse the resorption depth and in particular the demineralization depth. The maximum demineralization depth of an average resorption cavity is shown in Figure 4. It can be seen that both DTHI and ODN decreased the average resorption depth to a similar extent. DHT1, 1 and 10 μM reduced the maximum demineralization depth by 39% and 46%, respectively, and 50 and 500 nM ODN by 38% and 45% respectively. Taken together with the data obtained on the eroded surface and the number of events, this indicates that DHT1 and ODN reduce the overall resorption volume. The drop of the C‐terminal telopeptide CTx, a marker of CatK‐mediated type I collagen degradation (Garnero et al., 2003), by 83% with 10 μM DHT1 and 61% with 50 nM ODN (Figure 4) also supports the ability of DHT1 to inhibit collagen degradation by CatK.
Structural and microchemical analysis of resorption cavities
Scanning electron microscopy examination of bone slices revealed clear differences in the resorption pattern in the absence or presence of DHT1 and ODN (Figure 6). The inserts represent higher magnifications of trenches and pits marked by a red arrow. Figure 6 E–H shows highly magnified areas in a distinct resorption event (shown by * in the inserts in A–D). After analysing 25 resorption cavities in each condition, we found that deep trenches in the absence of inhibitors showed only very little demineralized collagen fibrils. Most of the surface of trenches was fully mineralized (Figure 6). In contrast, the majority of pits under the same condition revealed a substantial amount of fully demineralized and shredded collagen fibrils of larger diameters (Figure 6). This is in line with previously published data (Soe and Delaisse, 2010; Soe et al., 2013). As shown in Figure 6, resorption trenches reflecting high collagenolytic activity disappeared upon inhibition with both DHT1 and ODN, and only the cavities reflecting minor collagenolytic activity, that is, pits, remained. Figure 6 shows that in the presence of either DHT1 or ODN, a massive layer of demineralized and non‐degraded collagen fibrils accumulated in shallow pits, which was identical to the shallow pits observed in the inhibitor‐free controls (Figure 6). These visual observations were further supported by microchemical analyses of the mineral and protein content at the surface of cavities. Figure 6 shows that there is a much higher proportion of calcium and phosphate on the surfaces of trenches compared with the pits generated under control conditions or in the presence of DHT1 or ODN (Figure 6). These high carbon content cavities were primarily covered with organic material, which contrasts the very low carbon content observed in trenches (Figure 6).
Figure 6.

SEM micrographs of resorption lacunae generated by OCs under (A, B) untreated, (C) DHT1‐ and (D) ODN‐treated conditions. In untreated cultures observed at low magnification (A, B; scale bar 100 μm), both pits and trenches are visible; however, after treatment with DHT1 and ODN, only pits are visible. The inserts in A–D images are high magnification images of single resorption cavities indicated by the arrow (scale bar 20 μm trenches and 5 μm for pits). (E–F) Highly magnified micrographs of resorption cavities (at sites marked by *in inserts of A–D) clearly display the differences in accumulated collagen fibrils in pits and trenches under control and inhibitor‐treated conditions (scale bar 500 nm). (I–L) show the energy dispersive X‐ray spectroscopy spectra taken at the point of the resorption cavities indicated by an asterisk in the inserted micrographs (10 points per pit in each condition for 25 pits). (I) Energy dispersive X‐ray spectroscopy analysis shows high amounts of P and Ca at the bottom of trenches and only a minor signal for carbon, which is reflected by the lack of exposed demineralized fibrils (E). J–L show pits under control and DHT1‐ and ODN‐treated conditions with lesser amounts of P and Ca and higher yields of carbon. This is also corroborated by the well‐exposed collagen fibrils shown in F–H. (M) Quantification of carbon, oxygen, nitrogen, calcium and phosphorous in resorption cavities. *** P < 0.001, significantly different for elements in trenches under untreated conditions compared with pits in untreated, DHT1‐ and ODN‐treated conditions.
Effect of DHT1 and ODN on fibroblast‐mediated TGF‐ß1 degradation
We have previously shown that CatK deficiency in mice leads to an increase in TGF‐ß1 concentration in the lung, which correlated with a fibrotic phenotype (Zhang et al., 2011). DHT, an isomer of DHT1, does not inhibit the degradation of TGF‐ß1 in in vitro assays (Sharma et al., 2015). Here, we analysed whether CatK‐mediated degradation of TGF‐ß1 produced by skin fibroblasts (Quintanilla‐Dieck et al., 2009) is modulated by DHT1 and ODN. Both inhibitors had no effect on cell viability and their morphology up to a concentration of 10 μM (Figure 7). However, fibroblasts cultured in the presence of ODN (0.1 to 10 μM) revealed a significant dose‐dependent increase in intracellular and extracellular TGF‐β1 levels after 48 h (Figure 7), whereas no change was observed in the presence of DHT1 (up to 10 μM, Figure 7). A similar increase in TGF‐ß1 concentration was observed after the addition of a protease inhibitor cocktail (Figure 7). A dose‐response analysis revealed an IC50 value of 711 ± 210 nM for the inhibition of TGF‐ß1 degradation by ODN in the culture supernatant (Figure 7). The appropriate IC50 value for the intracellular degradation was 487 ± 130 nM indicating that ODN is also capable of inhibiting lysosomal protein degradation (Figure 7). This clearly shows that an active site‐directed inhibitor such as ODN affects TGF‐ß1 turnover in skin fibroblasts whereas the exosite inhibitor does not have an effect on this variable, even at an approximately 200‐fold higher concentration than the effective antiresorptive dose.
Discussion
Cathepsin K is a major drug target for osteoporosis and arthritic diseases (Bromme and Lecaille, 2009). Several highly potent inhibitors have been evaluated in clinical trials with different outcomes (Costa et al., 2011). Trial failures have been attributed to low specificity and toxicity of relacatib in phase I and for balicatib, a highly potent and selective lysosomotropic CatK inhibitor, due to morphea‐like skin lesions in a phase II trial (Runger et al., 2012). In contrast, ODN, a non‐lysosomotropic CatK inhibitor, successfully completed an efficacy phase III trial (Bone et al., 2015). However, detailed evaluation of the Long‐term Odanacatib Fracture Trial revealed some serious adverse side effects, which included increased numbers of patients with morphea skin lesions, atrial fibrillation, strokes, cerebrovascular events and overall mortality in the ODN treatment group when compared with the placebo group (http://www.mercknewsroom.com/news‐release/research‐and‐development‐news/merck‐announces‐data‐pivotal‐phase‐3‐fracture‐outcomes‐st). In order to understand the potential side effects of CatK inhibitors, it is important to know whether these effects are due to (i) off‐target, (ii) off‐substrate or (iii) the inhibition of CatK‐mediated collagen degradation in cell types other than OCs. CatK‐deficient mouse models have revealed some off‐substrate effects. For example, the lack of CatK expression is correlated with lung and brain abnormalities (Buhling et al., 2004; Dauth et al., 2011). We have previously demonstrated that TGF‐ß1 is increased in CatK‐deficient mouse lungs and may contribute to a fibrotic phenotype (Zhang et al., 2011). If TGF‐ß1 and other substrates are relevant targets for CatK activity, their degradation will be blocked by inhibitors such as ODN. Therefore, inhibitors selectively blocking the degradation of fibrillar collagens should be devoid of these side effects.
Here, we show for the first time that an exosite inhibitor of CatK can effectively inhibit osteoclastic bone resorption. DHT1 belongs to a large family of triterpenoids produced in Salvia miltiorrhiza, a herb widely used in the treatment of osteoporosis in traditional Chinese medicine (Guo et al., 2014). We have previously demonstrated that a related tanshinone derivative binds in exosite 1 of CatK and prevents the binding of CatK to elastin and subsequently elastinolysis (Sharma et al., 2015). Exosite 1, which is located in the L‐domain of elastolytic cathepsins, is essential for the binding of cathepsins to fibrillar elastin (Du et al., 2013; Sharma et al., 2015). Interestingly, exosite 1 is also involved in the dimerization of CatK molecules whose disruption leads to a selective inhibition of its collagenase activity (Cherney et al., 2011; Sharma et al., 2015). Based on our molecular docking simulations, DHT1 binds in exosite 1 and thus prevents collagenolysis. DHT1 blocks the binding to fibrillar collagen, whereas ODN fails to do this (Figure 2). As DHT1 does not bind to the active site of the enzyme, it does not inhibit the degradation of a general protease substrate such as gelatin. In contrast, ODN as a potent active site‐directed inhibitor completely blocks gelatin degradation. As suggested previously, this is highly relevant because an antiresorptive inhibitor should not interfere with the degradation of non‐matrix proteins such as regulatory TGF‐ß1. Deregulation of TGF‐ß1 expression and metabolism has been associated with fibrotic diseases including morphea (Leask and Abraham, 2004), which was the terminating factor of the balicatib clinical trial (Runger et al., 2012). This may pose a similar potential problem for ODN as our findings indicate that ODN inhibits TGF‐ß1 degradation by skin fibroblasts at concentrations similar to those present in the plasma of osteoporosis patients in the ODN trials. Although the IC50 values of ODN for intracellular and extracellular TGF‐ß1 degradation are about 25–50 times higher than the IC50 values for osteoclastic bone resorption, the plasma concentration of ODN has been reported to be about 200 nM 1 day after the administration of 25 mg, p.o. (Sun et al., 2012). At the therapeutic dose of 50 mg, plasma concentrations are expected to be twice as high (Bone et al., 2015) and thus close to the IC50 values for the TGF‐ß1 degradation. CatK has been previously demonstrated to be expressed in various fibroblast types including synovial and skin fibroblasts (Hou et al., 2001; Quintanilla‐Dieck et al., 2009). In contrast, DHT1 had no effect on TGF‐ß1even at a 200‐fold excess of its IC50 antiresorptive dose (Figure 7). It is noteworthy that intracellular TGF‐ß1 degradation was affected by ODN despite its non‐lysosomotropic nature (Desmarais et al., 2008). This may indicate that ODN is taken up by fibroblasts in significant amounts. The intra‐lysosomal activity of ODN is also supported by previous findings of a dramatic increase in the number of undigested collagen fragment‐containing vesicles in ODN‐treated OCs (Leung et al., 2011). The term ‘non‐lysosomotropic’ implies that a drug does not accumulate in lysosomes but it does not exclude its reduced lysosomal presence due to diffusion. Lysosomal degradation of endocytosed TGF‐ß1 receptor complexes has been described (Chen, 2009; Bai et al., 2014).
The selective inhibition of the collagenase activity of CatK by DHT1 in osteoclasts revealed a similar outcome when compared with ODN. The efficacy for the inhibition of trench formation in terms of IC50 values was only about four times better for ODN when compared with DHT1 (Figure 5). Moreover, the morphology of the remaining pits after the inhibition of osteoclastic bone resorption was indistinguishable in the presence of either inhibitor (Figures 3, 6). Both inhibitors specifically prevented trench formation. Trenches are the long bone cavities left behind when collagen fibre degradation by osteoclasts is almost complete. Neither inhibitor interfered with the initiation of the demineralization activity, as reflected by the comparable number of demineralized pits after treatment. Accordingly, inhibition of CatK stops the resorption process prematurely, and this results in an increase in the number of pits at the expense of trenches. Furthermore, neither inhibitor affected the viability of mature osteoclasts (Figure 4), which is an advantage over the osteoclast apoptosis‐inducing bisphosphonates (Rogers, 2003). It is surprising that the ratios of the IC50 values for DHT1 and ODN were different in the in vitro collagenase and the OC‐based resorption assays. The larger difference in the soluble collagen degradation assay (28‐fold) and the only fourfold difference in the OC assay might be caused by (i) different permeabilities of the inhibitors into the OCs and (ii) by different affinities of DHT1 towards the dimer form of CatK responsible for collagen fibre degradation (Aguda et al., 2014) and oligomeric forms responsible for the degradation of soluble collagen fragments (unpublished data, D. B.).
Conclusions
We have shown for the first time that an exosite inhibitor of CatK is a viable alternative to the classical active site‐directed inhibitors presently evaluated in clinical osteoporosis trials. Exosite inhibitors have the intrinsic advantage of not blocking the active site of CatK and thus not interfering with physiologically relevant non‐collagen substrates of this protease such as TGF‐ß1, which in part may account for some of the side effects seen.
Author contributions
D. B. and P. P. designed research; P. P. and K. S. performed research. R. V. C. G. and R. V. B did the docking experiments. P. P., D. B., K. S., and J. M. D. analysed the data and wrote the manuscript. All authors reviewed the results and approved the final version of the manuscript.
Conflict of interest
The authors have no conflict of interest.
Acknowledgements
This work was supported by the Canadian Institutes of Health Research grants MOP89974 and MOP201209 (D. B.). D. B. was supported by a Canada Research Chair award and funding by Vejle Hospital/Lillebaelt Hospital, Denmark. We are grateful to the CFI‐supported UBC Centre for High‐Throughput Phenogenomics facility for the use of the SEM.
Panwar, P. , Søe, K. , Guido, R. VC. , Bueno, R. V. C. , Delaisse, J.‐M. , and Brömme, D. (2016) A novel approach to inhibit bone resorption: exosite inhibitors against cathepsin K. British Journal of Pharmacology, 173: 396–410. doi: 10.1111/bph.13383.
References
- Aguda AH, Panwar P, Du X, Nguyen NT, Brayer GD, Bromme D (2014). Structural basis of collagen fiber degradation by cathepsin K. Proc Natl Acad Sci U S A 111: 17474–17479. [DOI] [PMC free article] [PubMed] [Google Scholar]
- Alexander SPH, Benson HE, Faccenda E, Pawson AJ, Sharman JL, Spedding M, et al. (2013). The concise guide to PHARMACOLOGY 2013/14: enzymes. Br J Pharmacol 170: 1797–1867. [DOI] [PMC free article] [PubMed] [Google Scholar]
- Bai X, Jing L, Li Y, Li Y, Luo S, Wang S, et al. (2014). TMEPAI inhibits TGF‐beta signaling by promoting lysosome degradation of TGF‐beta receptor and contributes to lung cancer development. Cell Signal 26: 2030–2039. [DOI] [PubMed] [Google Scholar]
- Bertazzo S, Gentleman E, Cloyd KL, Chester AH, Yacoub MH, Stevens MM (2013). Nano‐analytical electron microscopy reveals fundamental insights into human cardiovascular tissue calcification. Nat Mater 12: 576–583. [DOI] [PMC free article] [PubMed] [Google Scholar]
- Boissy P, Andersen TL, Abdallah BM, Kassem M, Plesner T, Delaisse JM (2005). Resveratrol inhibits myeloma cell growth, prevents osteoclast formation, and promotes osteoblast differentiation. Cancer Res 65: 9943–9952. [DOI] [PubMed] [Google Scholar]
- Bone HG, Dempster DW, Eisman JA, Greenspan SL, McClung MR, Nakamura T, et al. (2015). Odanacatib for the treatment of postmenopausal osteoporosis: development history and design and participant characteristics of LOFT, the Long‐Term Odanacatib Fracture Trial. Osteoporos Int 26: 699–712. [DOI] [PMC free article] [PubMed] [Google Scholar]
- Bromme D, Lecaille F (2009). Cathepsin K inhibitors for osteoporosis and potential off‐target effects. Expert Opin Investig Drugs 18: 585–600. [DOI] [PMC free article] [PubMed] [Google Scholar]
- Buhling F, Rocken C, Brasch F, Hartig R, Yasuda Y, Saftig P, et al. (2004). Pivotal role of cathepsin K in lung fibrosis. Am J Pathol 164: 2203–2216. [DOI] [PMC free article] [PubMed] [Google Scholar]
- Chapurlat RD (2014). Treatment of postmenopausal osteoporosis with odanacatib. Expert Opin Pharmacother 15: 559–564. [DOI] [PubMed] [Google Scholar]
- Chen YG (2009). Endocytic regulation of TGF‐beta signaling. Cell Res 19: 58–70. [DOI] [PubMed] [Google Scholar]
- Cherney MM, Lecaille F, Kienitz M, Nallaseth FS, Li Z, James MN, et al. (2011). Structure‐activity analysis of cathepsin K/chondroitin 4‐sulfate interactions. J Biol Chem 286: 8988–8998. [DOI] [PMC free article] [PubMed] [Google Scholar]
- Costa AG, Cusano NE, Silva BC, Cremers S, Bilezikian JP (2011). Cathepsin K: its skeletal actions and role as a therapeutic target in osteoporosis. Nat Rev Rheumatol 7: 447–456. [DOI] [PubMed] [Google Scholar]
- Dauth S, Sirbulescu RF, Jordans S, Rehders M, Avena L, Oswald J, et al. (2011). Cathepsin K deficiency in mice induces structural and metabolic changes in the central nervous system that are associated with learning and memory deficits. BMC Neurosci 12: 74. [DOI] [PMC free article] [PubMed] [Google Scholar]
- Delaisse JM (2014). The reversal phase of the bone‐remodeling cycle: cellular prerequisites for coupling resorption and formation. BoneKEy reports 3: 561. [DOI] [PMC free article] [PubMed] [Google Scholar]
- Desmarais S, Black WC, Oballa R, Lamontagne S, Riendeau D, Tawa P, et al. (2008). Effect of cathepsin K inhibitor basicity on in vivo off‐target activities. Mol Pharmacol 73: 147–156. [DOI] [PubMed] [Google Scholar]
- Dossetter AG, Beeley H, Bowyer J, Cook CR, Crawford JJ, Finlayson JE, et al. (2012). (1R,2R)‐N‐(1‐cyanocyclopropyl)‐2‐(6‐methoxy‐1, 3, 4, 5‐tetrahydropyrido[4, 3‐b]indole−2‐carbonyl)cyclohexanecarboxamide (AZD 4996): a potent and highly selective cathepsin K inhibitor for the treatment of osteoarthritis. J Med Chem 55: 6363–6374. [DOI] [PubMed] [Google Scholar]
- Du X, Chen NL, Wong A, Craik CS, Bromme D (2013). Elastin degradation by cathepsin V requires two exosites. J Biol Chem 288: 34871–34881. [DOI] [PMC free article] [PubMed] [Google Scholar]
- Feng X, McDonald JM (2011). Disorders of bone remodeling. Annu Rev Pathol 6: 121–145. [DOI] [PMC free article] [PubMed] [Google Scholar]
- Friesner RA, Murphy RB, Repasky MP, Frye LL, Greenwood JR, Halgren TA, et al. (2006). Extra precision glide: docking and scoring incorporating a model of hydrophobic enclosure for protein‐ligand complexes. J Med Chem 49: 6177–6196. [DOI] [PubMed] [Google Scholar]
- Friesner RA, Banks JL, Murphy RB, Halgren TA, Klicic JJ, Mainz DT, et al. (2004). Glide: a new approach for rapid, accurate docking and scoring. 1. Method and assessment of docking accuracy. J Med Chem 47: 1739–1749. [DOI] [PubMed] [Google Scholar]
- Garnero P, Ferreras M, Karsdal MA, Nicamhlaoibh R, Risteli J, Borel O, et al. (2003). The type I collagen fragments ICTP and CTX reveal distinct enzymatic pathways of bone collagen degradation. J Bone Miner Res 18: 859–867. [DOI] [PubMed] [Google Scholar]
- Gauthier JY, Chauret N, Cromlish W, Desmarais S, Duong le T, Falgueyret JP, et al. (2008). The discovery of odanacatib (MK‐0822), a selective inhibitor of cathepsin K. Bioorg Med Chem Lett 18: 923–928. [DOI] [PubMed] [Google Scholar]
- Guo Y, Li Y, Xue L, Severino RP, Gao S, Niu J, et al. (2014). Salvia miltiorrhiza: an ancient Chinese herbal medicine as a source for anti‐osteoporotic drugs. J Ethnopharmacol . [DOI] [PubMed] [Google Scholar]
- Helali AM, Iti FM, Mohamed IN (2013). Cathepsin K inhibitors: a novel target but promising approach in the treatment of osteoporosis. Curr Drug Targets 14: 1591–1600. [DOI] [PubMed] [Google Scholar]
- Hou WS, Li Z, Gordon RE, Chan K, Klein MJ, Levy R, et al. (2001). Cathepsin K is a critical protease in synovial fibroblast‐mediated collagen degradation. Am J Pathol 159: 2167–2177. [DOI] [PMC free article] [PubMed] [Google Scholar]
- Leask A, Abraham DJ (2004). TGF‐beta signaling and the fibrotic response. FASEB J 18: 816–827. [DOI] [PubMed] [Google Scholar]
- Leung P, Pickarski M, Zhuo Y, Masarachia PJ, Duong LT (2011). The effects of the cathepsin K inhibitor odanacatib on osteoclastic bone resorption and vesicular trafficking. Bone 49: 623–635. [DOI] [PubMed] [Google Scholar]
- Li Z, Hou WS, Escalante‐Torres CR, Gelb BD, Bromme D (2002). Collagenase activity of cathepsin K depends on complex formation with chondroitin sulfate. J Biol Chem 277: 28669–28676. [DOI] [PubMed] [Google Scholar]
- Li Z, Kienetz M, Cherney MM, James MN, Bromme D (2008). The crystal and molecular structures of a cathepsin K:chondroitin sulfate complex. J Mol Biol 383: 78–91. [DOI] [PubMed] [Google Scholar]
- Linnevers CJ, McGrath ME, Armstrong R, Mistry FR, Barnes M, Klaus JL, et al. (1997). Expression of human cathepsin K in Pichia pastoris and preliminary crystallographic studies of an inhibitor complex. Protein Sci 6: 919–921. [DOI] [PMC free article] [PubMed] [Google Scholar]
- Panwar P, Du X, Sharma V, Lamour G, Castro M, Li H, et al. (2013). Effects of cysteine proteases on the structural and mechanical properties of collagen fibers. J Biol Chem 288: 5940–5950. [DOI] [PMC free article] [PubMed] [Google Scholar]
- Pawson AJ, Sharman JL, Benson HE, Faccenda E, Alexander SP, Buneman OP, et al. NC‐IUPHAR(2014). The IUPHAR/BPS Guide to PHARMACOLOGY: an expert‐driven knowledgebase of drug targets and their ligands. Nucl. Acids Res. 42 (Database Issue): D1098–D1106. [DOI] [PMC free article] [PubMed] [Google Scholar]
- Quintanilla‐Dieck MJ, Codriansky K, Keady M, Bhawan J, Runger TM (2009). Expression and regulation of cathepsin K in skin fibroblasts. Exp Dermatol 18: 596–602. [DOI] [PubMed] [Google Scholar]
- Rogers MJ (2003). New insights into the molecular mechanisms of action of bisphosphonates. Curr Pharm Des 9: 2643–2658. [DOI] [PubMed] [Google Scholar]
- Runger TM, Adami S, Benhamou CL, Czerwinski E, Farrerons J, Kendler DL, et al. (2012). Morphea‐like skin reactions in patients treated with the cathepsin K inhibitor balicatib. J Am Acad Dermatol 66: e89–e96. [DOI] [PubMed] [Google Scholar]
- Sharma V, Panwar P, O'Donoghue AJ, Cui H, Guido RV, Craik CS, et al. (2015). Structural requirements for the collagenase and elastase activity of cathepsin K and its selective inhibition by an exosite inhibitor. Biochem J 465: 163–173. [DOI] [PubMed] [Google Scholar]
- Sims NA, Ng KW (2014). Implications of osteoblast‐osteoclast interactions in the management of osteoporosis by antiresorptive agents denosumab and odanacatib. Curr Osteoporos Rep 12: 98–106. [DOI] [PubMed] [Google Scholar]
- Soe K, Delaisse JM (2010). Glucocorticoids maintain human osteoclasts in the active mode of their resorption cycle. J Bone Miner Res 25: 2184–2192. [DOI] [PubMed] [Google Scholar]
- Soe K, Merrild DM, Delaisse JM (2013). Steering the osteoclast through the demineralization‐collagenolysis balance. Bone 56: 191–198. [DOI] [PubMed] [Google Scholar]
- Stoch SA, Wagner JA (2008). Cathepsin K inhibitors: a novel target for osteoporosis therapy. Clin Pharmacol Ther 83: 172–176. [DOI] [PubMed] [Google Scholar]
- Sun L, Forni S, Schwartz MS, Breidinger S, Woolf EJ (2012). Quantitative determination of odanacatib in human plasma using liquid–liquid extraction followed by liquid chromatography‐tandem mass spectrometry analysis. J Chromatogr B Analyt Technol Biomed Life Sci 885‐886: 15–23. [DOI] [PubMed] [Google Scholar]
- Zhang D, Leung N, Weber E, Saftig P, Bromme D (2011). The effect of cathepsin K deficiency on airway development and TGF‐beta1 degradation. Respir Res 12: 72. [DOI] [PMC free article] [PubMed] [Google Scholar]
- Zhuo Y, Gauthier JY, Black WC, Percival MD, Duong LT (2014). Inhibition of bone resorption by the cathepsin K inhibitor odanacatib is fully reversible. Bone 67: 269–280. [DOI] [PubMed] [Google Scholar]