Abstract
Background and Purpose
Endothelin‐1 (ET‐1) reduces insulin‐stimulated glucose uptake in skeletal muscle, inducing insulin resistance. Here, we have determined the molecular mechanisms underlying negative regulation by ET‐1 of insulin signalling.
Experimental Approach
We used the rat L6 skeletal muscle cells fully differentiated into myotubes. Changes in the phosphorylation of Akt was assessed by Western blotting. Effects of ET‐1 on insulin‐stimulated glucose uptake was assessed with [3H]‐2‐deoxy‐d‐glucose ([3H]2‐DG). The C‐terminus region of GPCR kinase 2 (GRK2‐ct), a dominant negative GRK2, was overexpressed in L6 cells using adenovirus‐mediated gene transfer. GRK2 expression was suppressed by transfection of the corresponding short‐interfering RNA (siRNA).
Key Results
In L6 myotubes, insulin elicited sustained Akt phosphorylation at Thr308 and Ser473, which was suppressed by ET‐1. The inhibitory effects of ET‐1 were prevented by treatment with a selective ETA receptor antagonist and a Gq protein inhibitor, overexpression of GRK2‐ct and knockdown of GRK2. Insulin increased [3H]2‐DG uptake rate in a concentration‐dependent manner. ET‐1 noncompetitively antagonized insulin‐stimulated [3H]2‐DG uptake. Blockade of ETA receptors, overexpression of GRK2‐ct and knockdown of GRK2 prevented the ET‐1‐induced suppression of insulin‐stimulated [3H]2‐DG uptake. In L6 myotubes overexpressing FLAG‐tagged GRK2, ET‐1 facilitated the interaction of endogenous Akt with FLAG‐GRK2.
Conclusions and Implications
Activation of ETA receptors with ET‐1 suppressed insulin‐induced Akt phosphorylation at Thr308 and Ser473 and [3H]2‐DG uptake in a GRK2‐dependent manner in skeletal muscle cells. These findings suggest that ETA receptors and GRK2 are potential targets for overcoming insulin resistance.
Abbreviations
- ET‐1
endothelin‐1
- FCS
fetal calf serum
- GLUT
glucose transporter
- GRK2
GPCR kinase 2
- GRK2‐ct
C‐terminus region of GPCR kinase 2
- [3H]2‐DG
[1,2–3 H(N)]‐2‐deoxy‐d‐glucose
- HRP
horseradish peroxidase
- HS
horse serum
- InsR
insulin receptor
- IRS
insulin receptor substrate
- PTX
Pertussis toxin
- siRNA
short interfering RNA
Tables of Links
| TARGETS |
|---|
| GPCRs a |
| ETA receptor |
| ETB receptor |
| Catalytic receptors b |
| InsR, insulin receptor |
| Transporters c |
| GLUT4, SLC2A4 |
| Enzymes d |
| Akt |
| GRK2, GPCR kinase 2 (BARK1) |
These Tables list key protein targets and ligands in this article which are hyperlinked to corresponding entries in http://www.guidetopharmacology.org, the common portal for data from the IUPHAR/BPS Guide to PHARMACOLOGY (Pawson et al., 2014) and are permanently archived in the Concise Guide to PHARMACOLOGY 2015/16 (a,b,c,dAlexander et al., 2015a, 2015b, 2015c, 2015d).
Introduction
Endothelin‐1 (ET‐1) is a potent vasoconstrictor and pro‐inflammatory peptide (Yanagisawa et al., 1988), which has been implicated in the pathophysiology of various diseases, including diabetes mellitus (Pernow et al., 2012), systemic and pulmonary hypertension (Rodríguez‐Pascual et al., 2011) and atherosclerosis (Pernow et al., 2012). Plasma levels of ET‐1 are elevated in patients with these diseases (Ferri et al., 1995; Lerman et al., 1991; Takahashi et al., 1990; Touyz and Schiffrin, 2003). Excessive production of ET‐1 causes a prolonged vasoconstriction mediated mainly through ETA receptors (Horinouchi et al., 2013), endothelial dysfunction resulting from down‐regulation of ETB receptors (Rubin, 2012) and insulin resistance (Shemyakin et al., 2011; Usui et al., 2005).
Insulin resistance is a condition where the sensitivity to insulin of the cells expressing insulin receptors (InsR) is decreased because of a functional disturbance of insulin‐mediated intracellular signalling. The most important tissue involved in the lowering of blood glucose levels by insulin is skeletal muscle, accounting for approximately 70% of total glucose uptake in healthy subjects (DeFronzo, 1988). Accordingly, disturbance of insulin‐stimulated glucose uptake into skeletal muscle is mainly responsible for elevated blood glucose levels in patients with type 2 diabetes (DeFronzo, 1988), where there is no significant change in glucose transporter 4 (GLUT4) protein levels (Schalin‐Jäntti et al., 1994).
Insulin increases glucose uptake in skeletal muscle cells through facilitating translocation of GLUT4 from intracellular storage vesicles to the plasma membrane, as detailed below and reviewed by Leto and Saltiel (2012). Activation of InsRs induces phosphorylation of the corresponding substrate protein (IRS), resulting in the recruitment and activation of PI3K. PI3K converts phosphatidylinositol‐4,5‐diphosphate to phosphatidylinositol‐3,4,5‐trisphosphate, which is involved in the recruitment of phosphoinositide‐dependent kinase 1 and Akt (Shisheva, 2008). Akt translocated to the plasma membrane is activated by phosphorylation at Thr308 by phosphoinositide‐dependent kinase 1 and at Ser473 by mammalian target of rapamycin complex 2 (Laplante and Sabatini, 2012; Sarbassov et al., 2005). Activated Akt facilitates the translocation of GLUT4 to the plasma membrane by phosphorylation and subsequent inactivation of the Rab‐GTPase‐activating protein, AS160. The decreased Rab‐GTPase activity increases the ratio of the GTP‐bound form (active form) of Rab to the GDP‐bound form (inactive form), leading to facilitation of GLUT4 translocation and cell membrane fusion. This sequence of events demonstrate that Akt activation is essential for insulin‐stimulated glucose uptake via GLUT4 in skeletal muscle.
Several studies have suggested that ET‐1 induces insulin resistance through a direct action on skeletal muscle, rather than reduced insulin delivery to the skeletal muscle resulting from vasoconstriction. In healthy subjects, administration of exogenous ET‐1 reduces insulin‐stimulated glucose uptake in skeletal muscle without decreasing skeletal muscle blood flow (Ottosson‐Seeberger et al., 1997). In addition, prolonged treatment of primary culture of human skeletal muscle cells with ET‐1 impairs insulin‐stimulated Akt phosphorylation and glucose uptake (Shemyakin et al., 2011). However, the signalling pathways underlying the inhibitory effects of ET‐1 on the insulin‐induced facilitation of Akt phosphorylation and glucose uptake in skeletal muscle cells are not yet known.
Growing evidence shows that the GPCR kinase 2 (GRK2), a ubiquitous Ser/Thr protein kinase, can function as a negative regulator of insulin signalling in a phosphorylation‐independent manner, although it was originally identified as a kinase, which specifically phosphorylates and desensitizes agonist‐stimulated GPCRs (Evron et al., 2012). Several lines of evidence demonstrate that GRK2 binds to a range of signalling molecules including Akt (Liu et al., 2005) and Gβγ subunits (Evron et al., 2012). A direct interaction of GRK2 with Akt impairs Akt activation, causing negative regulation of Akt signalling (Liu et al., 2005). Binding of GRK2 to Gβγ subunits is essential for translocation of GRK2 to the plasma membrane (Evron et al., 2012). These data encouraged us to assume that activation of ET receptors in skeletal muscle cells induced insulin resistance through inhibition of Akt signalling, namely, activation of ET receptors promoted dissociation of receptor‐coupled G protein into its subunits, Gα and Gβγ; the increase in the local concentration of Gβγ subunit in turn recruited GRK2 to the plasma membrane, leading to the augmented interaction of GRK2 with Akt at the plasma membrane and the resulting inhibition of Akt signalling.
The purpose of this study was to determine molecular mechanisms underlying negative regulation by ET‐1 of insulin signalling in rat L6 myotubes, with particular attention to the possible involvement of GRK2. Because both GLUT4 protein and insulin‐stimulated glucose uptake via GLUT4 were increased during myogenesis in L6 cells (Mitsumoto and Klip, 1992), L6 myoblasts were highly differentiated into myotubes with a modified method to estimate insulin‐stimulated glucose uptake.
Methods
Construction of retrovirus vector
The pcDNA3 mammalian expression vector encoding FLAG‐tagged GRK2 (FLAG‐GRK2) was generously provided by Dr. Hitoshi Kurose (Kyusyu University, Fukuoka, Japan). The vector was digested with two restriction enzymes (BamHI and NotI) simultaneously to obtain the insert cDNA of FLAG‐GRK2. The cDNA fragment was ligated into the BamHI/NotI‐treated pMXrmv5 retrovirus vector to yield the pMXrmv5 vectors encoding FLAG‐GRK2.
Cell culture
Rat L6 skeletal muscle cell line was obtained from the Health Science Research Resources Bank (Osaka, Japan) and cultured in low‐glucose DMEM supplemented with 5% (v·v−1) fetal calf serum (FCS), penicillin (100 units·mL−1) and streptomycin (100 μg·mL−1) at 37°C in humidified air with 5% CO2. For differentiation of myoblasts into myotubes, myoblasts were seeded into six‐well plates at a density of approximately 106 cells per well and cultured in low‐glucose DMEM supplemented with 5% FCS for 2 days. To induce differentiation, the cells were maintained in low‐glucose DMEM supplemented with 2% horse serum (HS) and 10 μg·mL−1 human insulin for 7 days with medium change every 2 days (Figure 1A). For Western blot analysis and [3H]2‐DG uptake assay, the differentiated myotubes (Day 7) were serum starved in low‐glucose DMEM for 2 or 3 days with daily medium change prior to performing the examination (unless indicated otherwise).
Figure 1.
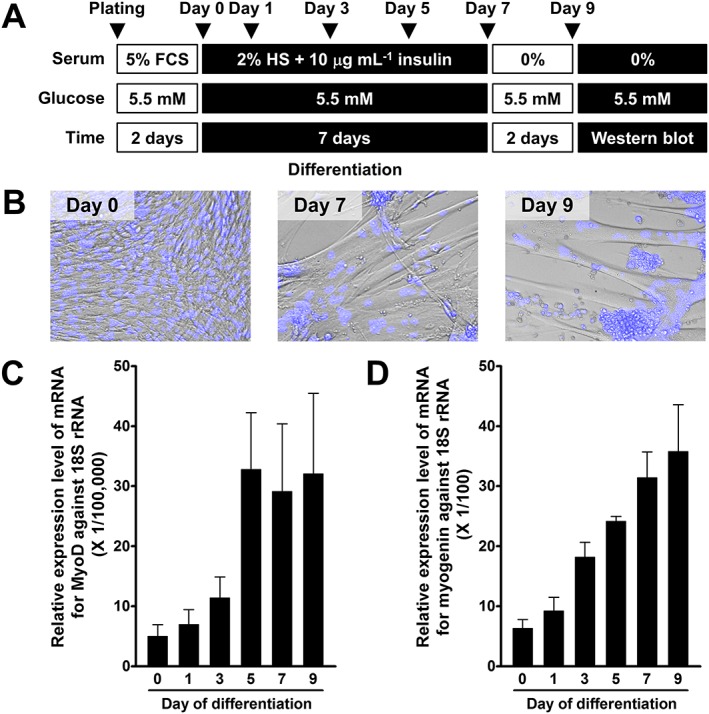
Differentiation of L6 myoblasts into myotubes. (A) Protocol for differentiation of L6 myoblasts into myotubes. (B) Phase contrast images of undifferentiated myoblasts (Day 0) and differentiated myotubes (Days 7 and 9) obtained at the same magnification. The nucleus was stained with Hoechst 33342 dye as shown in blue. (C and D) Changes in mRNA levels of differentiation marker genes, MyoD (C) and myogenin (D), during differentiation. Ordinate represents relative expression levels against 18S rRNA as an internal control gene. Data are presented as means ± SEM of the results obtained from five experiments.
Stable expression of FLAG‐GRK2 in L6 cells
To generate L6 cells stably expressing FLAG‐GRK2, the gene was introduced into L6 myoblasts by retroviral gene transfer as described previously (Horinouchi et al., 2012).
Adenovirus infection
Recombinant adenoviruses encoding GFP and the carboxyl terminal region of GRK2 (GRK2‐ct) were kindly provided by Dr. Hitoshi Kurose (Kyusyu University). L6 myotubes (Day 7) maintained in six‐well plates were infected by recombinant adenoviruses encoding GFP or GRK2‐ct for 2 h. After infection, the cells were cultured in low‐glucose DMEM containing 2% HS for 12 h. Subsequently, L6 myotubes were cultured in serum‐free, low‐glucose DMEM for 2 days for Western blot analysis or 3 days for assay of [3H]‐2‐deoxy‐d‐glucose ([3H]2‐DG) uptake.
Transfection of siRNA
Control and GRK2 siRNAs were transfected into L6 myotubes (Day 6) maintained in six‐well plates using Lipofectamine RNAiMAX Transfection Reagent according to the manufacturer's protocol with minor modifications. Briefly, 40 pmol of siRNA was diluted in 0.5 mL of Opti‐MEM I without serum. The Lipofectamine RNAiMAX Transfection Reagent (7.5 μL) was diluted in the diluted siRNA solution, and the mixture was incubated at room temperature for 20 min. Cell culture medium was removed from wells of six‐well plates, and the mixture of siRNA and Lipofectamine RNAiMAX Transfection Reagent was added to each well. Then, 0.5 mL of low‐glucose DMEM containing 0.5% FCS was added to the well without removing the transfection mixture, and the cells were incubated for 72 h. During 72 h incubation, 0.5 mL of low‐glucose DMEM was added to each well every 24 h without removing the transfection mixture. For Western blot analysis and assay of [3H]2‐DG uptake, the cells were serum starved in low‐glucose DMEM for 24 h prior to performing the experiments.
Visualization of cell nuclei and imaging of spontaneously contracting myotubes
L6 myoblasts (Day 0) and myotubes (Days 7 and 9) were incubated with a DNA‐specific fluorescent dye, Hoechst 33342 (1 μg·mL−1), for 30 min in culture medium at 37°C in humidified air with 5% CO2. The fluorescent images for Hoechst 33342 and the phase contrast images were obtained using a fluorescence microscopy (IX‐71, Olympus Corp., Tokyo, Japan) equipped with ×20 objective lens (LUCPLFLN, NA = 0.45, Olympus).
Measurement of mRNA expression levels for MyoD, myogenin, and 18S rRNA by quantitative RT‐PCR
Total RNA of L6 cells was extracted at indicated days (Figure 1C and D) and purified by using total RNA purification kit (RNeasy Mini Kit, QIAGEN, Tokyo, Japan) following the manufacturer's instructions. Quantitative RT‐PCR was performed by using both SuperScript III First‐Strand Synthesis System (Thermo Fisher Scientific Inc.) for RT and FastStart Essential DNA Green Master kit (Roche Diagnostics GmbH, Mannheim, Germany) with gene‐specific primers for quantitative PCR (Table 1). Synthesized cDNA was heated for 10 min at 95°C and then amplified by 45 cycles (95°C for 10 s, 60°C for 10 s and 72°C for 15 s) using a programmable thermal cycler (LightCycler Nano; Roche Diagnostics GmbH). The PCR products were confirmed by a single band on electrophoresis and by the single melting temperature. The 18S rRNA gene was used as an internal control for normalization of the data. Expression levels of mRNAs for MyoD and myogenin were represented as a ratio to 18S rRNA.
Table 1.
Oligonucleotides used as PCR primers
| Gene | Forward Primer (5′ to 3′) | Reverse Primer (5′ to 3′) | Product size (bp) | References |
|---|---|---|---|---|
| Rat MyoD | GGAGACATCCTCAAGCGATGC | AGCACCTGGTAAATCGGATTG | 105 | (Gomes et al., 2006) |
| Rat myogenin | ACTACCCACCGTCCATTCAC | TCGGGGCACTCACTGTCTCT | 233 | (Kamikawa et al., 2013) |
| Rat 18S rRNA | CACGGGTGACGGGGAATCAG | CGGGTCGGGAGTGGGTAATTTG | 105 | (Kim et al., 2011) |
| Rat ETA receptor | ATGGGTGTCCTTTGCTTTCTGGCGT | TTAGTTCATGCTGTCCTTGTGGCTG | 1281 | – |
| Rat Gq protein | ATGACTCTGGAGTCCATCATGGCGT | TTAGACCAGATTGTACTCCTTCAGG | 1080 | – |
| Rat G11 protein | ATGACTCTGGAGTCCATGATAGCGT | TCAGACCAGGTTGTACTCCTTCAGG | 1080 | – |
| Rat GRK2‐ct | GCCAAAAACAAACAGCTGGGC | ACTGCCACGCTGAATCAGTGG | 432 | – |
| Rat InsR | CAGGATTGGCGCTGTGTAAAC | CACAGCTGCCTCAGGTTCTG | 491 | (Obici et al., 2002) |
| Rat Akt2 | ATGAATGAGGTATCTGTCATCAAAG | TCACTCTCGGATGCTGGCTGAGTAG | 1446 | – |
| Rat GLUT4 | ATGCCGTCGGGTTTCCAGCAGATCGGC | TCAGTCATTCTCATCTGGCCCTAAGTATTC | 1530 | – |
Western blot analysis
Western blot analysis was carried out as described previously (Harada et al., 2014). The primary antibodies [phospho‐Akt (Thr308), phospho‐Akt (Ser473), total Akt (pan), phospho‐ERK1/2, total‐ERK1/2 and IRS‐1] bound to proteins on membranes were detected with a secondary HRP‐conjugated anti‐rabbit IgG antibody and Pierce Western blotting Substrate (Thermo Fisher Scientific Inc.). The blots were exposed to Amersham Hyperfilm ECL (GE Healthcare Ltd., Little Chalfont, Buckinghamshire, UK). OD on the film was analysed with National Institutes of Health Image J1.37 software. The phosphorylation levels of Akt at Thr308 and Ser473 were routinely expressed as the ratio of phosphorylated Akt to total Akt. Akt phosphorylation responses were normalized to the level of insulin‐stimulated Akt phosphorylation in L6 myotubes without treatment with ET‐1, vehicle, antagonist, inhibitor, adenovirus or siRNA.
Co.‐immunoprecipitation assay
Co.‐immunoprecipitation experiment and subsequent Western blot analysis were carried out as described previously (Horinouchi et al., 2012). The primary antibody [total Akt (pan) and IRS‐1] bound to proteins on membranes was detected with Clean‐Blot IP Detection Reagent HRP for immunoprecipitated samples or a secondary HRP‐conjugated anti‐rabbit IgG antibody for whole cell lysates. The Clean‐Blot reagent and HRP‐conjugated antibody were detected with ImmunoStar LD (Wako Pure Chemical Industries, Ltd.) and Pierce Western blotting Substrate (Thermo Fisher Scientific Inc.), respectively. The membranes were then stripped with stripping buffer [62.5 mM Tris–HCl (pH 7.0), 2% SDS, 1% 2‐mercaptoethanol] for 1 h at 50°C and reprobed with an anti‐FLAG HRP antibody. The blots were exposed to Amersham Hyperfilm ECL (GE Healthcare Ltd.). The amounts of immunoprecipitated proteins were analysed with National Institutes of Health Image J1.37 software.
[3H]2‐DG uptake assay
L6 myotubes (Day 7) maintained in six‐well plates were serum starved in low‐glucose DMEM for 3 days (unless indicated otherwise) prior to performing [3H]2‐DG uptake assay. The cells were incubated in serum‐free DMEM supplemented with 1.0 mM d‐glucose and 1.0 mM sodium pyruvate (assay medium) for 30 min before each experiment. To estimate insulin‐stimulated [3H]2‐DG uptake, the cells were treated with insulin and 100 nM [3 H]2‐DG in serum‐free assay medium. [3H]2‐DG uptake was terminated by rapid washing three times with 3 mL of PBS (37°C) containing 20.0 mM d‐glucose. For quantitation of [3H]2‐DG uptake, the cells were collected with 1.0 mL of 0.5 M NaOH (60°C) and completely digested with shaking at 150 rpm for 60 min at 60°C. The radioactivity in the lysate was counted in a liquid scintillation counter (LC‐3500; Aloka, Tokyo, Japan) using a scintillation fluid (Clear‐sol II; Nacalai Tesque Inc., Kyoto, Japan). The protein content in the lysate was determined with the method of Bradford (1976) using BSA as standard.
Data analysis
These studies comply with the recommendations on experimental design and analysis in pharmacology (Curtis et al., 2015). The results are presented as means ± SEM, where n refers to the number of experiments. The significance of the difference between mean values was evaluated with GraphPad prism (version 3.00, GraphPad software Inc., San Diego, CA, USA) by unpaired t‐test or one‐way ANOVA followed by Tukey's multiple comparison test. A P‐value less than 0.05 was considered to indicate significant differences.
Materials
YM‐254890 was kindly provided by Astellas Pharma Inc. (Tokyo, Japan). The following drugs and reagents were used in the present study: synthetic human ET‐1, BQ‐123 [cyclo(d‐trp‐d‐asp‐l‐pro‐d‐val‐l‐leu)], BQ‐788 (N‐cis‐2,6‐dimethyl‐piperidinocarbonyl‐l‐γ‐methylleucyl‐d‐1‐methoxycarbonyltryptophanyl‐d‐norleucine) (Peptide Institute, Osaka, Japan); human insulin (Cell Science and Technology Institute, Inc., Miyagi, Japan); BSA, Hoechst 33342 (Sigma‐Aldrich Co., St. Louis, MO, USA.); LY294002 [2‐(4‐morpholinyl)‐8‐phenyl‐4 H‐1‐benzopyran‐4‐one], Pertussis toxin (PTX) (Calbiochem, San Diego, CA, USA); [1,2–3 H(N)]‐2‐deoxy‐d‐glucose ([3H]2‐DG; specific activity: 8.0 Ci·mmol−1, 1.0 mCi·mL−1 in aqueous solution, PerkinElmer, Inc., Boston, MA, USA); FCS, HS, d‐glucose‐free and sodium pyruvate‐free DMEM, EDTA‐free, protease inhibitor cocktail (Thermo Fisher Scientific Inc., Waltham, MA, USA); low‐glucose (5.5 mM) DMEM (Wako Pure Chemical Industries, Ltd., Osaka, Japan); GSK2126458 [2,4‐difluoro‐N‐(2‐methoxy‐5‐(4‐(pyridazin‐4‐yl)quinolin‐6‐yl)pyridin‐3‐yl)benzenesulfonamide] (Selleck Chemicals, Houston, TX, USA); NF449 (4,4′,4″,4″′‐[carbonylbis(imino‐5,1,3‐benzenetriyl‐bis(carbonylimino))]tetrakis‐1,3‐benzenedisulfonic acid, octasodium salt) (Tocris Bioscience, Bristol, UK); ON‐TARGETplus Rat Adrbk1 (25238) short‐interfering RNA (siRNA) – SMARTpool (L‐090990‐02‐0005), ON‐TARGETplus non‐targeting Pool (D‐001810‐10‐05) (GE Healthcare Dharmacon Inc., Lafayette, CO, USA); and Lipofectamine RNAiMAX Transfection Reagent, Opti‐MEM I Reduced Serum Medium (Thermo Fisher Scientific Inc.). Primary antibodies for phospho‐Akt (Thr308), phospho‐Akt (Ser473), total Akt (pan), phospho‐ERK1/2 (Thr202/Tyr204), total ERK1/2, and IRS‐1, and a secondary horseradish peroxidase (HRP)‐conjugated anti‐rabbit IgG antibody were obtained from Cell Signalling Technology Inc. (Beverly, MA, USA). Primary antibodies for FLAG peptide, HRP‐conjugated FLAG peptide (HRP‐FLAG) and GFP were obtained from Sigma‐Aldrich, Medical and Biological Laboratories Co., Ltd. (Aichi, Japan) and Clontech Laboratories, Inc. (Mountain View, CA, U.S.A.) respectively. GRK2 antibody (C‐15) and normal mouse IgG were obtained from Santa Cruz Biotechnology, Inc. (Dallas, TX, USA). Clean‐Blot IP Detection Reagent HRP was obtained from Thermo Fisher Scientific Inc. The other reagents used were of analytical grade.
Results
Differentiation of mononucleated myoblasts into contractile, multinucleated myotubes
Figure 1B shows that mononucleated myoblasts (Day 0) are differentiated into multinucleated myotubes (Day 7) during culture in the differentiation medium. Some of the myotubes (Day 7) were able to constrict spontaneously (Supporting Information Movie S1). The myotubes (Day 7) were resistant to serum starvation for at least 3 days (Figure 1B, Day 9 after serum starvation for 2 days). Quantitative RT‐PCR analysis has demonstrated that mRNA expression levels for differentiation marker genes, MyoD and myogenin (Bentzinger et al., 2012), are increased during differentiation for 9 days with a different time course (Figure 1C and D). The maximal mRNA expression level of MyoD was observed at Day 5 and was maintained for at least 4 days (Figure 1C). On the other hand, the mRNA expression level of myogenin was increased with time and reached its maximum at Day 9 (Figure 1D).
As shown in Supporting Information Fig. S1, the expression level of mRNA for ETA receptors was slightly but significantly decreased after differentiation. On the other hand, mRNA expression levels of GRK2 and GLUT4 were increased after differentiation. There was no statistically significant difference in mRNA expression levels of Gq protein, G11 protein, InsR and Akt2 between Day 0 and Day 7.
Characterization of insulin‐induced Akt phosphorylation in L6 myotubes
Treatment of L6 myotubes with insulin at concentrations ranging from 1 nM to 3 μM for 5 min elicited phosphorylation of Akt at Thr308 and Ser473 in a concentration‐dependent manner with pEC50 values of 7.59 ± 0.08 for Thr308 and 7.63 ± 0.08 for Ser473 (n = 6 for each) (Figure 2A). There was no difference in the pEC50 values for phosphorylation of Thr308 and Ser473. The phosphorylation of Akt induced by 300 nM insulin was increased rapidly after insulin stimulation and reached its maximal level at around 5 min and was kept at that level for up to 15 min. The level of phosphorylation declined slightly at 30 min and remained constant up to 60 min (Figure 2B). The Akt phosphorylation at Thr308 and Ser473 in response to stimulation with 300 nM insulin for 5 min was significantly inhibited by two PI3K inhibitors, GSK2126458 (Knight et al., 2010) or LY294002 (Shepherd et al., 1997) (Figure 2C and D).
Figure 2.
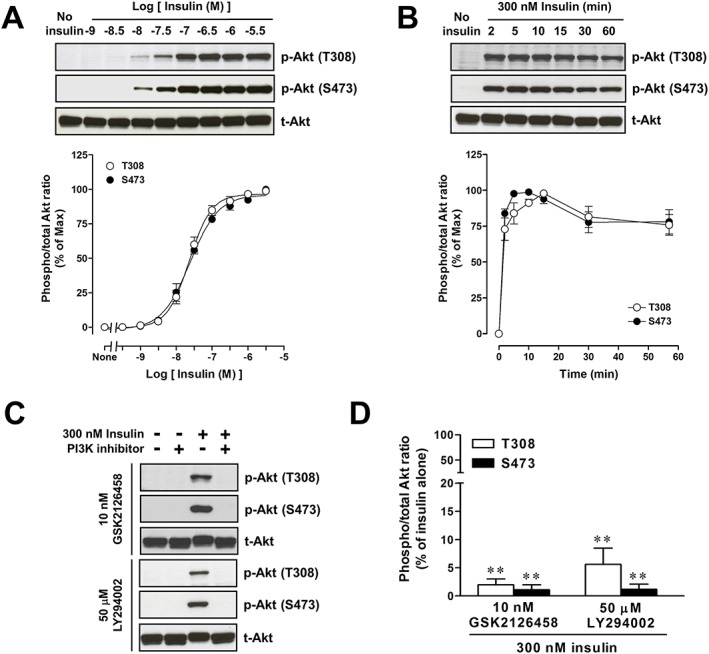
Characterization of Akt phosphorylation in response to insulin in L6 myotubes. (A) Concentration‐response curves for Akt phosphorylation in response to 5 min exposure to insulin with representative immunoblots using antibodies to phospho‐Akt at Thr308 [p‐Akt (T308)], phospho‐Akt at Ser473 [p‐Akt (S473)] and total Akt (t‐Akt). (B) Time course of Akt phosphorylation induced by 300 nM insulin with representative immunoblots. (C and D) Effects of GSK2126458 and LY294002 on Akt phosphorylation in response to 5 min exposure to 300 nM insulin in L6 myotubes. The cells were treated with 10 nM GSK2126458 or 50 μM LY294002 for 30 min before stimulation with insulin. Representative immunoblots were obtained using antibodies to p‐Akt (T308), p‐Akt (S473) and t‐Akt. (A and B) Ordinate represents Akt phosphorylation responses, which are normalized to the level of insulin‐stimulated maximal Akt phosphorylation. (D) Ordinate represents Akt phosphorylation responses, which are normalized to the level of insulin‐stimulated Akt phosphorylation in L6 myotubes without treatment with GSK2126458 or LY294002. Data are presented as means ± SEM of the results obtained from six experiments. When no error bar is shown, the error is smaller than the symbol. ** P < 0.01 versus its control (300 nM insulin alone).
Effects of ET‐1 on insulin‐induced Akt phosphorylation in L6 myotubes
In the absence of insulin stimulation, treatment with 30 nM ET‐1 for the corresponding times had no effect on basal levels of Akt phosphorylation (Supporting Information Fig. S2). Akt phosphorylation at Thr308 and Ser473 induced by 100 nM insulin stimulation for 60 min was inhibited by treatment with 30 nM ET‐1,and increased with longer times of treatment. The maximal inhibition of around 50% was observed following ET‐1 treatment for 10–15 min (Figure 3).
Figure 3.
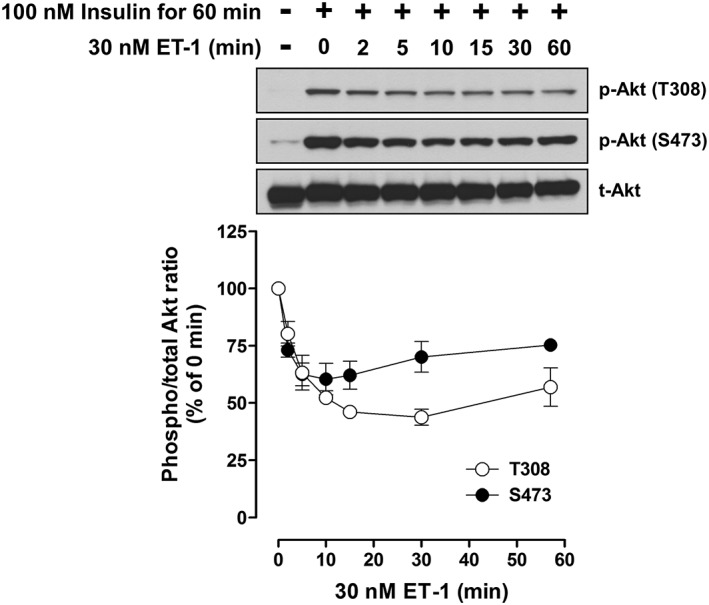
Effect of ET‐1 on Akt phosphorylation in response to 60 min exposure to 100 nM insulin in L6 myotubes. The cells were treated with 30 nM ET‐1 for indicated times during treatment with 100 nM insulin for 60 min. Representative immunoblots were obtained using antibodies to phospho‐Akt at Thr308 [p‐Akt (T308)], phospho‐Akt at Ser473 [p‐Akt (S473)] and total Akt (t‐Akt). Ordinate represents Akt phosphorylation responses, which are normalized to the level of insulin‐stimulated Akt phosphorylation in L6 myotubes without treatment with ET‐1. Data are presented as means ± SEM of the results obtained from five to six experiments. When no error bar is shown, the error is smaller than the symbol.
Molecular mechanisms for ET‐1‐induced inhibition of insulin‐stimulated Akt phosphorylation in L6 myotubes
In the presence of 0.1% DMSO (as a vehicle), treatment with ET‐1 for 2 and 5 min inhibited phosphorylation of Akt at Thr308 and Ser473 induced by treatment with 100 nM insulin for 60 min (Figure 4). Notably, the inhibitory effects of ET‐1 were blocked by treatment with 1 μM BQ‐123 (a selective ETA receptor antagonist) and 300 nM YM‐254890 (a selective Gq protein inhibitor). However, 1 μM BQ‐788 (a selective ETB receptor antagonist), 200 ng·mL−1 PTX (a selective Gi protein inhibitor) and 100 μM NF449 (a Gs protein inhibitor) had no effect on the ET‐1‐induced inhibition of insulin‐stimulated Akt phosphorylation.
Figure 4.
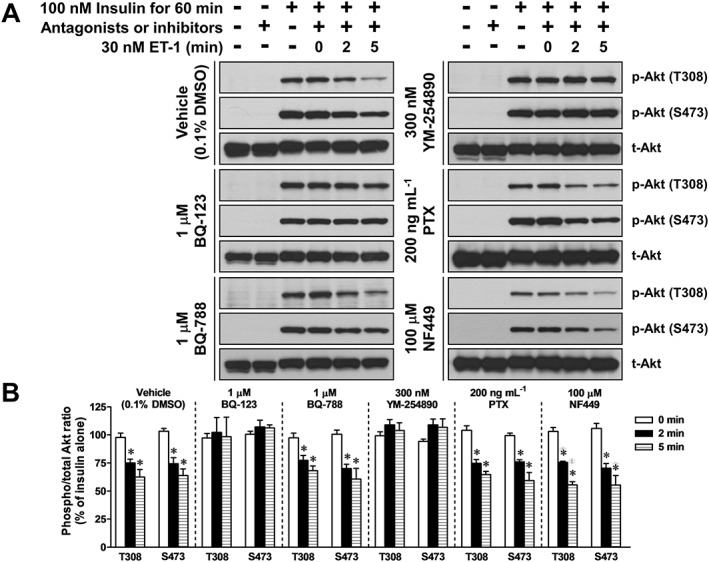
Effects of 0.1% DMSO (as a vehicle), BQ‐123 (a selective ETA receptor antagonist), BQ‐788 (a selective ETB receptor antagonist), YM‐254890 (a selective Gq protein inhibitor), PTX (a selective Gi protein inhibitor) and NF449 (a Gs protein inhibitor) on the ET‐1‐induced inhibition of insulin‐stimulated Akt phosphorylation in L6 myotubes. The cells were treated with 30 nM ET‐1 for indicated times during treatment with 100 nM insulin for 60 min. The cells were treated with one of the drugs for 30 min (except PTX for 18 h) before treatment with 100 nM insulin for 60 min. (A) Representative immunoblots obtained using antibodies to phospho‐Akt at Thr308 [p‐Akt (T308)], phospho‐Akt at Ser473 [p‐Akt (S473)] and total Akt (t‐Akt). (B) ET‐1‐induced changes in the ratio of phosphorylated Akt to t‐Akt. Ordinate represents Akt phosphorylation responses, which are normalized to the level of insulin‐stimulated Akt phosphorylation in L6 myotubes without treatment with ET‐1, vehicle, antagonists or inhibitors. Data are presented as means ± SEM of the results obtained from five to six experiments. * P < 0.05 versus its control (100 nM insulin alone).
Involvement of GRK2 in the ET‐1‐induced inhibition of insulin‐stimulated Akt phosphorylation in L6 myotubes
As shown in Figure 5, overexpression of GFP as a control or GRK2‐ct, a dominant negative construct lacking the N‐terminal kinase domain (Koch et al., 1994; Kurose et al., 1999), had no effect on the insulin‐stimulated Akt phosphorylation at Thr308 and Ser473. In L6 myotubes overexpressing GFP, treatment with ET‐1 for 2 and 5 min decreased the phosphorylation levels of Akt at Thr308 and Ser473 induced by treatment with 100 nM insulin for 60 min (Figure 5). The inhibition by ET‐1 of insulin‐stimulated Akt phosphorylation was abolished in cells overexpressing GRK2‐ct.
Figure 5.
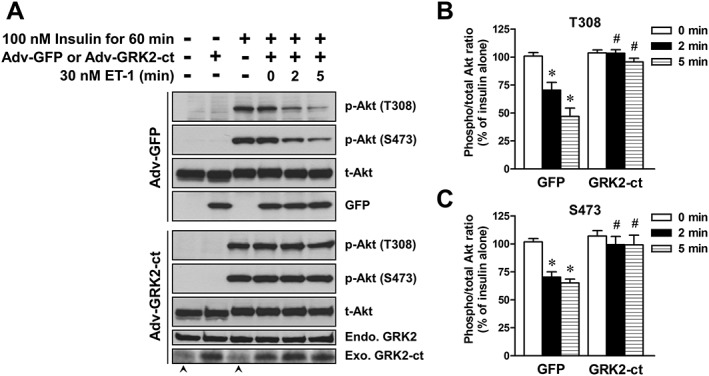
Effects of introducing GFP (Adv‐GFP) and GRK2‐ct (Adv‐GRK2‐ct) by adenovirus infection on the ET‐1‐induced inhibition of insulin‐stimulated Akt phosphorylation in L6 myotubes. The cells were treated with 30 nM ET‐1 for indicated times during treatment with 100 nM insulin for 60 min. (A) Representative immunoblots obtained using antibodies to phospho‐Akt at Thr308 [p‐Akt (T308)], phospho‐Akt at Ser473 [p‐Akt (S473)], total Akt (t‐Akt), GFP and GRK2. Endogenously expressing GRK2 (Endo. GRK2) and exogenously expressing GRK2‐ct (Exo. GRK2‐ct) were detected with GRK2 antibody (C‐15), which binds to the GRK2‐ct. Arrow head indicates a non‐specific band in the lane of Exo. GRK2‐ct. (B and C) ET‐1‐induced changes in the ratio of phosphorylated Akt to t‐Akt. Ordinate represents Akt phosphorylation responses, which are normalized to the level of insulin‐stimulated Akt phosphorylation in L6 myotubes without treatment with ET‐1 and adenovirus. Data are presented as means ± SEM of the results obtained from six experiments. * P < 0.05 versus its control (100 nM insulin alone). # P < 0.05 versus Adv‐GFP‐treated cells.
In L6 myotubes transfected with non‐targeting siRNA (control siRNA), ET‐1 inhibited the insulin‐stimulated Akt phosphorylation at Thr308 and Ser473 (Figure 6). However, GRK2 knockdown by GRK2 siRNA prevented the ET‐1‐induced inhibition of insulin‐stimulated Akt phosphorylation.
Figure 6.
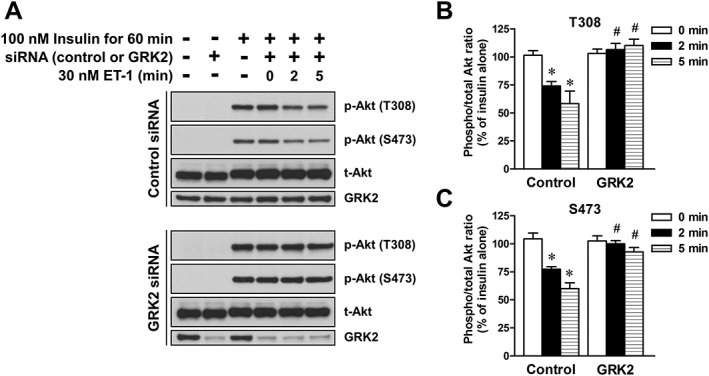
Effects of introducing control and GRK2 siRNA on the ET‐1‐induced inhibition of insulin‐stimulated Akt phosphorylation in L6 myotubes. The cells were treated with 30 nM ET‐1 for indicated times during treatment with 100 nM insulin for 60 min. (A) Representative immunoblots obtained using antibodies to phospho‐Akt at Thr308 [p‐Akt (T308)], phospho‐Akt at Ser473 [p‐Akt (S473)], total Akt (t‐Akt) and GRK2. (B and C) ET‐1 induced changes in the ratio of phosphorylated Akt to t‐Akt. Ordinate represents Akt phosphorylation responses, which are normalized to the level of insulin‐stimulated Akt phosphorylation in L6 myotubes without treatment with ET‐1 and siRNA. Data are presented as means ± SEM of the results obtained from six experiments. * P < 0.05 versus its control (100 nM insulin alone). # P < 0.05 versus control siRNA‐treated cells.
Effects of insulin on [3H]2‐DG uptake in L6 myotubes
Insulin increased the rate of [3H]2‐DG uptake in myotubes (Figure 7B), whereas it failed to facilitate [3H]2‐DG uptake in L6 myoblasts (data not shown), indicating that the insulin‐stimulated glucose uptake is a myotube‐specific response. In the absence of insulin, there was a low basal uptake rate of [3H]2‐DG (Figure 7B). Treatment of L6 myotubes with 100 nM insulin for 2 h increased [3 H]2‐DG uptake and the insulin‐stimulated [3H]2‐DG uptake was inhibited by the PI3K inhibitors, GSK2126458 or LY294002, both of which did not affect the basal [3H]2‐DG uptake rate (Figure 7B). Insulin (3–300 nM) increased [3H]2‐DG uptake rate in a concentration‐dependent manner with a pEC50 value of 8.08 ± 0.11. The maximal response induced by 100 nM insulin was 155 ± 5% of the basal uptake rate (n = 12) (Figure 7C). ET‐1 (30 nM) non‐competitively antagonized insulin‐stimulated [3H]2‐DG uptake, without affecting the pEC50 value (pEC50: 7.86 ± 0.29, n = 6) calculated from each concentration‐response curve.
Figure 7.
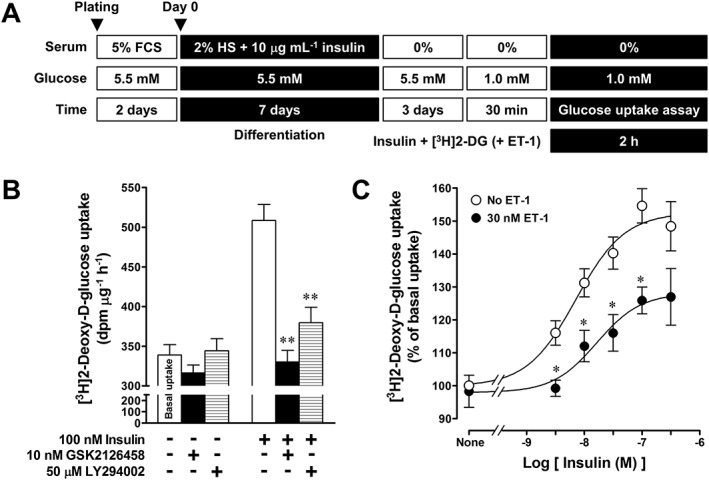
Characterization of insulin‐stimulated [3H]2‐DG uptake in L6 myotubes. (A) Protocol for [3H]2‐DG uptake assay. (B) Effects of GSK2126458 and LY294002 on insulin‐stimulated [3H]2‐DG uptake. The cells were treated with the inhibitor for 30 min before stimulation with insulin. Ordinate represents the rate of [3H]2‐DG uptake (dpm·μg− 1·h−1). (C) concentration‐response curves for insulin‐stimulated [3H]2‐DG uptake in the absence and presence of 30 nM ET‐1. Ordinate represents percentage of the rate of [3H]2‐DG uptake, which is normalized to basal [3H]2‐DG uptake before application of insulin and ET‐1. Data are presented as means ± SEM of the results obtained from eight experiments. * P < 0.05, ** P < 0.01 versus its control (insulin alone).
Molecular mechanisms for ET‐1‐induced inhibition of insulin‐stimulated [3H]2‐DG uptake in L6 myotubes
In L6 myotubes, treatment with ET‐1 or BQ‐123, overexpression of GRK2‐ct and transfection of GRK2 siRNA had no effect on the basal [3H]2‐DG uptake rate in the absence of insulin stimulation (data not shown). ET‐1 (30 nM) inhibited the insulin‐stimulated [3H]2‐DG uptake (Figure 8A). The inhibitory effect of ET‐1 was cancelled by pretreatment with 1 μM BQ‐123 (Figure 8A). Notably, the ET‐1‐induced inhibition of insulin‐stimulated [3H]2‐DG uptake was also blocked by either overexpression of GRK2‐ct (n = 8) (Figure 8B) or GRK2 knockdown (n = 6) (Figure 8C).
Figure 8.
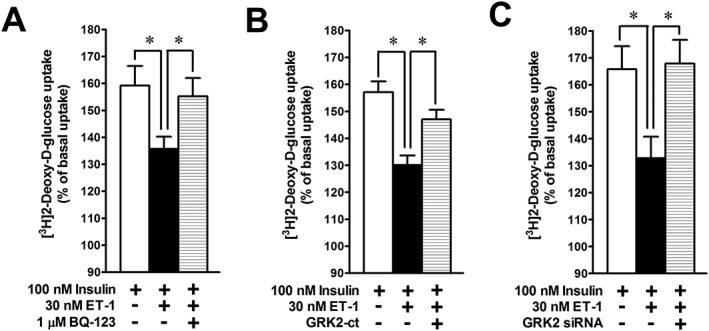
Effects of BQ‐123 (A), GRK2‐ct overexpression (B) and GRK2 knockdown (C) on the ET‐1‐induced inhibition of insulin‐stimulated [3H]2‐DG uptake in L6 myotubes. ET‐1 was given concomitantly with insulin and [3H]2‐DG. Ordinate represents percentage of the rate of [3H]2‐DG uptake, which is normalized to basal [3H]2‐DG uptake before application of insulin and ET‐1. Data are presented as means ± SEM of the results obtained from six to eight experiments. * P < 0.05 between indicated columns.
Augmentation by ET‐1 stimulation of interaction of Akt with GRK2 in L6 myotubes
Co.‐immunoprecipitation assays showed that endogenous Akt was nonspecifically immunoprecipitated with mouse normal IgG (control IgG) under resting condition (Figure 9A). Treatment of myotubes with 30 nM ET‐1 for 5 or 10 min resulted in approximately 2.5‐fold increase in the amount of Akt protein co‐immunoprecipitated with FLAG‐GRK2, compared with the basal interaction, without ET‐1 stimulation (Figure 9B). Unexpectedly, insulin stimulation alone augmented the interaction of Akt with FLAG‐GRK2 in the absence of ET‐1 stimulation, and the augmentation by insulin of the interaction was markedly attenuated by ET‐1 stimulation for 10 min (Figure 9C). Accordingly, there was a discrepancy in the effect of ET‐1 on the insulin‐stimulated Akt phosphorylation between FLAG‐GRK2‐negative and positive cells, that is, ET‐1 inhibited the insulin‐stimulated Akt phosphorylation in L6 myotubes not overexpressing FLAG‐GRK2 (Figure 3), whereas the inhibitory effect of ET‐1 was not observed in the cells overexpressing FLAG‐GRK2 (data not shown).
Figure 9.
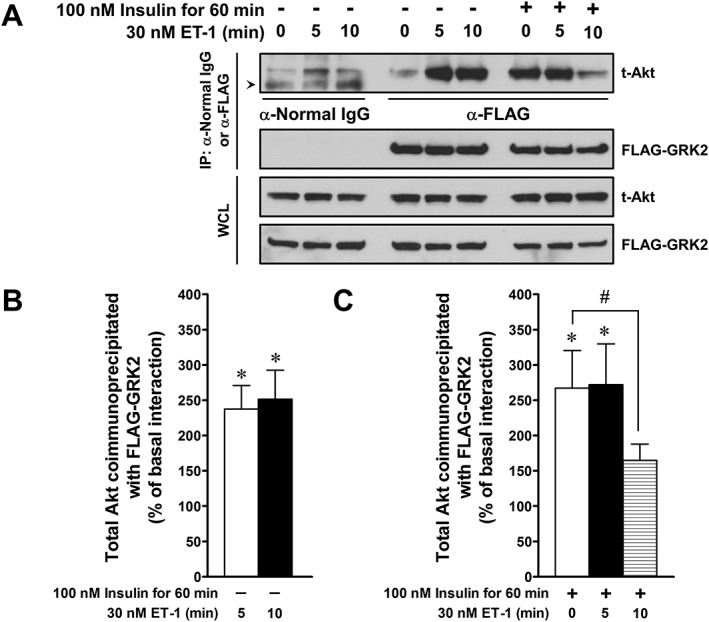
Interaction of endogenous Akt with FLAG‐GRK2 in L6 myotubes. (A) Upper panel for immunoprecipitated samples (IP: α‐normal IgG or FLAG): FLAG‐tagged GRK2 proteins were immunoprecipitated with anti‐FLAG antibody. Immunoprecipitates were probed with the anti‐total Akt (t‐Akt) antibody to estimate co‐immunoprecipitated endogenous Akt. Arrow head indicates a non‐specific band (lower band) for α‐normal IgG in the lane of t‐Akt. Lower panel for IP: FLAG‐tagged GRK2 proteins were immunoprecipitated with anti‐FLAG antibody, and the immunoprecipitates were probed with the anti‐FLAG‐HRP antibody to normalize the quantity of co‐immunoprecipitated endogenous Akt. Upper panel for whole cell lysate (WCL): the expressed Akt was detected with the anti‐t‐Akt antibody. Lower panel for WCL: the expressed FLAG‐GRK2 was detected with the anti‐FLAG‐HRP antibody. (B and C) The histogram represents change in the ratio of the quantity of immunoprecipitated endogenous Akt to that of immunoprecipitated FLAG‐GRK2. The change is normalized to the interaction of Akt with FLAG‐GRK2 under resting conditions before application of insulin and ET‐1. Data are presented as means ± SEM of the results obtained from six experiments. * P < 0.05 versus basal interaction (in the absence of insulin and ET‐1). # P < 0.05 between indicated columns.
Discussion
In the present study, we have investigated the mechanism(s) underlying ET‐1‐induced insulin resistance using L6 myotubes. We demonstrated that ET‐1 inhibited insulin‐stimulated Akt phosphorylation and glucose uptake in L6 myotubes and that the ETA receptor‐Gq protein pathway and GRK2 were involved in the inhibitory effects of ET‐1 (Figure 10).
Figure 10.
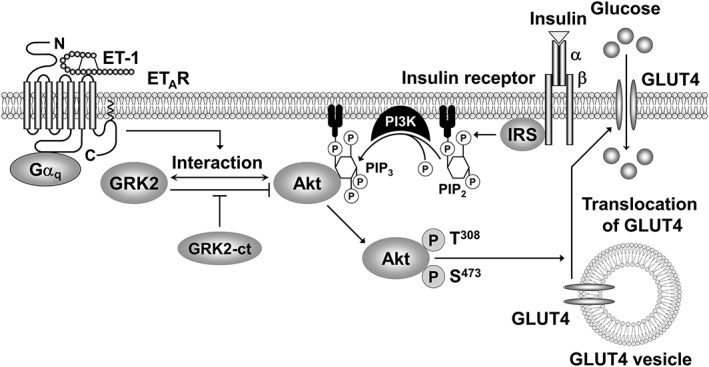
A schematic diagram showing the pathways leading to the negative regulation of insulin signalling by ET‐1 in L6 myotubes.
The L6 skeletal muscle cell line is widely used as a model for studying glucose transport and myogenesis. L6 myoblasts have the potential ability to spontaneously differentiate into myotubes (Nevzorova et al., 2002). To differentiate L6 myoblasts into myotubes, we used differentiation medium containing both 2% HS and 10 μg·mL−1 insulin, although many investigators have used the medium supplemented with either one of 2% FCS (Nevzorova et al., 2002), 2% HS (Ruest et al., 2002) or 10 μg·mL−1 insulin (Jin et al., 1991). The criteria for differentiation of myoblasts into myotubes are as follows: (i) multinucleation, (ii) spontaneous contraction, (iii) an increase in expression level of transcription factors such as MyoD and myogenin and (iv) an increase in expression level of GLUT4 (Bentzinger et al., 2012; Mitsumoto et al., 1991; Mitsumoto and Klip, 1992; Öberg et al., 2011). The L6 myotubes differentiated in differentiation medium containing both 2% HS and 10 μg·mL−1 insulin fulfil the earlier criteria, indicating that these myotubes consist of highly differentiated (mature) skeletal muscle cells.
In the differentiated L6 myotubes, insulin stimulated PI3K‐dependent Akt phosphorylation (Figure 2C and D) and [3H]2‐DG uptake (an index of glucose uptake; Figure 7B). These results are consistent with previous studies showing that the PI3K inhibitors, wortmannin and LY 294002, inhibited insulin‐stimulated Akt phosphorylation and glucose uptake in skeletal muscle cells (Nevzorova et al., 2002; Shepherd et al., 1997; Tsakiridis et al., 1995) and indicate that L6 myotubes used in the present study possess functional InsR and InsR‐stimulated intracellular signalling pathway leading to GLUT4. Indeed, expression of InsR, IRS‐1, Akt and GLUT4 in L6 myotubes was demonstrable by RT‐PCR (Supporting Information Fig. S1) or Western blot analysis (Supporting Information Fig. S3).
Several studies have demonstrated that in adipocytes, insulin stimulates GLUT4‐mediated glucose uptake through an IRS‐independent pathway in addition to the classical IRS‐dependent pathway (Imamura et al., 1999; Usui et al., 2005; Usui et al., 2003). In adipocytes, insulin stimulation can activate a Gαq protein independently of IRS, and the activated Gαq subunit stimulates GLUT4‐mediated glucose uptake through activation of Cdc42 and PI3K (Imamura et al., 1999; Usui et al., 2005; Usui et al., 2003). This raises the possibility that activation of Gq protein is involved in the insulin‐stimulated PI3K‐dependent Akt phosphorylation in L6 myotubes. However, this possibility was ruled out on the basis of insensitivity to YM‐254890, a selective Gq protein inhibitor (Supporting Information Fig. S4).
The present study has shown that in L6 myotubes, ET‐1 inhibits insulin‐stimulated Akt phosphorylation (Figure 3) and [3H]2‐DG uptake (Figure 7), as reported previously (Shemyakin et al., 2011). In our recent report, we have shown that in L6 myoblasts, both ETA and ETB receptors are expressed at mRNA level (Harada et al., 2014). The ETA receptors can couple with Gq and Gs proteins, while ETB receptors couple to Gq and Gi proteins (Alexander et al., 2011). Based on the sensitivity to several types of antagonists and inhibitors (Figure 4), the ET‐1‐induced inhibition of the insulin‐stimulated Akt phosphorylation and [3H]2‐DG uptake is considered to be mediated through the ETA receptor–Gq protein pathway. The dominant role of this pathway in L6 myotubes is consistent with that in the ET‐1‐induced ERK1/2 phosphorylation and Ca2 + influx in L6 myoblasts, as shown in our recent report (Harada et al., 2014). These findings support clinical evidence that selective blockade of ETA receptors improves insulin‐mediated glucose uptake in obese subjects (Lteif et al., 2007).
The present study has demonstrated that the ET‐1‐mediated inhibition of insulin's action results from the augmented interaction of GRK2 with Akt and the subsequent inhibition of insulin‐stimulated Akt phosphorylation. This conclusion is based on (i) attenuation of the ET‐1‐mediated inhibition of insulin‐stimulated Akt phosphorylation and glucose uptake following overexpression of GRK2‐ct (Figures 5, 8) or GRK2 knockdown by siRNA (Figures 6, 8) and (ii) augmentation by ET‐1 of association between Akt and GRK2. GRK2 consists of an N‐terminus kinase domain and a C‐terminus containing the pleckstrin homology domain, which is involved in the binding of GRK2 to several signalling molecules such as Gβγ subunits and Akt (Evron et al., 2012; Liu et al., 2005). Because GRK2‐ct lacks the N‐terminus kinase domain, but it retains the ability to bind to other molecules, it can function as a dominant‐negative form of GRK2 (Koch et al., 1994; Nishida et al., 2000), which interferes with the interaction between GRK2 and its binding partner molecules. In fact, GRK2 is reported to interact with Akt via its C‐terminal region in rat endothelial cells (functionally disturbed by a pathological process such as diabetes mellitus) to reduce Akt phosphorylation (Liu et al., 2005). Taken together, the present findings strongly indicate that GRK2 inhibits insulin‐stimulated Akt phosphorylation, by interacting with Akt via its C‐terminal region.
Unexpectedly, in L6 myotubes overexpressing FLAG‐GRK2, insulin augmented the binding of Akt to FLAG‐GRK2, and the augmentation was inhibited by ET‐1 treatment for 10 min. The inhibitory effect of ET‐1 on the insulin‐stimulated interaction of overexpressed FLAG‐GRK2 with Akt might be due to the βγ subunits released from Gαq protein upon activation of ETA receptors competing with Akt for the C‐terminus region of FLAG‐GRK2. The insulin‐stimulated interaction of FLAG‐GRK2 with Akt might inhibit phosphorylation of Akt like the ET‐1‐stimulated interaction, resulting in loss of ET‐1‐induced, GRK2‐mediated inhibition of insulin‐stimulated Akt phosphorylation. Further studies will be required to clarify the mechanism for insulin‐stimulated interaction of FLAG‐GRK2 with Akt.
In addition to Akt, IRS‐1 is a potential target for ET‐1‐induced, GRK2‐mediated inhibition of insulin‐stimulated glucose uptake (Usui et al., 2005; Usui et al., 2004). IRS‐1 is one of the major substrates of the InsR kinase, and it contains multiple Ser/Thr phosphorylation sites (Leto and Saltiel, 2012). There are two possible mechanisms involved here. One is that the ET‐1‐induced inhibition of insulin signalling results from the interaction of IRS‐1 with GRK2 and the other, that GRK2 mediated phosphorylation of IRS‐1. In the present study, the interaction of IRS‐1 with GRK2 was not detected by a co‐immunoprecipitation assay in L6 myotubes overexpressing FLAG‐GRK2 (Supporting Information Fig. S3). The possible involvement of GRK2‐mediated IRS‐1 phosphorylation in the ET‐1‐induced, GRK2‐dependent insulin resistance will be studied in the future.
Conclusions
In summary, the present study has shown the mechanism for the ET‐1‐induced inhibition of insulin signalling (i.e. insulin resistance) in L6 myotubes, as summarized in Figure 10. In L6 myotubes, insulin stimulates the PI3K‐dependent Akt phosphorylation, which facilitates glucose uptake by augmenting translocation of GLUT4 to the plasma membrane. Activation of ETA receptors with ET‐1 facilitates the interaction of GRK2 with Akt via a Gq protein‐dependent pathway. Overexpression of GRK2‐ct counteracts ET‐1‐induced, GRK2‐mediated inhibition of the insulin‐stimulated Akt phosphorylation and glucose uptake. Thus, activation of ETA receptors with ET‐1 induces the insulin resistance by facilitating the interaction of GRK2 with Akt. These results indicate that both ETA receptors and GRK2 are therapeutic targets for overcoming insulin resistance
Author contributions
T. H., A. H., T. H., T. H., S. K., K. T., T. H., Y. M., P. N. and Y. M. performed the research. T. H., A. H. and S. M. designed the research study. T. H., T. H. and S. M. provided funding. T. H. and S. M. wrote the manuscript.
Conflict of interest
The authors state no conflict of interest.
Supporting information
Figure S1 Changes in mRNA expression level for ETA receptors (A), Gq protein (B), G11 protein (C), GRK2 (D), InsR (E), Akt2 (F) and GLUT4 (G) during differentiation of myoblasts into myotubes for 7 days. Semiquantitative RT‐PCR experiments were carried out using total RNA prepared from 5 individual cell populations. Ordinate represents relative expression levels at Day 7 against Day 0. Data are presented as means ± SEM of the results obtained from 5 experiments. * P < 0.05, ** P < 0.01, significantly different from unity.
Figure S2 ET‐1 induces phosphorylation of ERK1/2 but not Akt in L6 myotubes. The cells were treated with 30 nM ET‐1 for indicated times. Representative immunoblots were obtained using antibodies to phospho‐Akt at Thr308 [p‐Akt (T308)], phospho‐Akt at Ser473 [p‐Akt (S473)], total Akt (t‐Akt), phospho‐ERK1/2 (p‐ERK1/2), and total ERK1/2 (t‐ERK1/2).
Figure S3 No interaction of endogenous IRS‐1 with FLAG‐GRK2 is detected in L6 myotubes. Upper panel for immunoprecipitated samples (IP: α‐normal IgG or FLAG): FLAG‐tagged GRK2 proteins were immunoprecipitated with anti‐FLAG antibody. Immunoprecipitates were probed with the anti‐IRS‐1 antibody to estimate co‐immunoprecipitated endogenous IRS‐1. Lower panel for IP: FLAG‐tagged GRK2 proteins were immunoprecipitated with anti‐FLAG antibody, and the immunoprecipitates were probed with the anti‐FLAG‐HRP antibody to normalize the quantity of co‐immunoprecipitated endogenous Akt. Upper panel for whole cell lysate (WCL): the expressed IRS‐1 was detected with the anti‐IRS‐1 antibody. Lower panel for WCL: the expressed FLAG‐GRK2 was detected with the anti‐FLAG‐HRP antibody.
Figure S4 Effects of YM‐254890 on Akt phosphorylation in response to 5 min exposure to 300 nM insulin in L6 myotubes. The cells were treated with 300 nM YM‐254890 for 30 min before stimulation with insulin. Representative immunoblots were obtained using antibodies to phospho‐Akt at Thr308 [p‐Akt (T308)], phospho‐Akt at Ser473 [p‐Akt (S473)], and total Akt (t‐Akt). Ordinate represents Akt phosphorylation responses which are normalized to the level of insulin‐stimulated Akt phosphorylation in L6 myotubes without treatment with YM‐254890. Data are presented as means ± SEM of the results obtained from 5 experiments.Supplementary METHODS. Measurement of mRNA expression levels for ETA receptors, Gq protein, G11 protein, GRK2, InsR, Akt2 and GLUT4 by semiquantitative RT‐PCR. Supplementary Movie S1. Spontaneous contraction of L6 myotubes (Day 7).
Supporting info item
Supporting info item
Supporting info item
Supporting info item
Supporting info item
Supporting info item
Acknowledgements
We thank Dr. Hitoshi Kurose (Kyusyu University, Japan) for kindly donating recombinant adenoviruses encoding GFP and GRK2‐ct, and the pcDNA3 mammalian expression vector encoding FLAG‐GRK2. We also thank Astellas Pharma Inc. (Tokyo, Japan) for generously providing YM‐254890. This study was supported in part by Grants‐in‐Aid for Scientific Research (C) from Japan Society for the Promotion of Science (grant 24590309) (to T. H.), Grants‐in‐Aid for Scientific Research (B) from Japan Society for the Promotion of Science (grant 24390059) (to S. M.) and by grants from Smoking Research Foundation of Japan (to S. M.), the Pharmacological Research Foundation, Tokyo (to T. H.), Suzuken Memorial Foundation (to T. H.) and Actelion Pharmaceuticals Japan Ltd. (to T. H.).
Horinouchi, T. , Hoshi, A. , Harada, T. , Higa, T. , Karki, S. , Terada, K. , Higashi, T. , Mai, Y. , Nepal, P. , Mazaki, Y. , and Miwa, S. (2016) Endothelin‐1 suppresses insulin‐stimulated Akt phosphorylation and glucose uptake via GPCR kinase 2 in skeletal muscle cells. British Journal of Pharmacology, 173: 1018–1032. doi: 10.1111/bph.13406.
References
- Alexander SPH, Davenport AP, Kelly E, Marrion N, Peters JA, Benson HE, et al (2015a). The Concise Guide to PHARMACOLOGY 2015/16: G Protein‐Coupled Receptors. Br J Pharmacol 172: 5744–5869. [DOI] [PMC free article] [PubMed] [Google Scholar]
- Alexander SPH, Fabbro D, Kelly E, Marrion N, Peters JA, Benson HE, et al (2015b). The Concise Guide to PHARMACOLOGY 2015/16: Catalytic receptors. Br J Pharmacol 172: 5979–6023. [DOI] [PMC free article] [PubMed] [Google Scholar]
- Alexander SPH, Fabbro D, Kelly E, Marrion N, Peters JA, Benson HE, et al (2015c). The Concise Guide to PHARMACOLOGY 2015/16: Enzymes. Br J Pharmacol 172: 6024–6109. [DOI] [PMC free article] [PubMed] [Google Scholar]
- Alexander SPH, Kelly E, Marrion N, Peters JA, Benson HE, Faccenda E, et al (2015d). The Concise Guide to PHARMACOLOGY 2015/16: Transporters. Br J Pharmacol 172: 6110–6202. [DOI] [PMC free article] [PubMed] [Google Scholar]
- Alexander SP, Mathie A, Peters JA (2011). Guide to Receptors and Channels (GRAC), 5th edition. Br J Pharmacol 164: S1–S324. [DOI] [PMC free article] [PubMed] [Google Scholar]
- Bentzinger CF, Wang YX, Rudnicki MA (2012). Building muscle: molecular regulation of myogenesis. Cold Spring Harb Perspect Biol 4: ID a008342. [DOI] [PMC free article] [PubMed]
- Bradford MM (1976). A rapid and sensitive method for the quantitation of microgram quantities of protein utilizing the principle of protein–dye binding. Anal Biochem 72: 248–254. [DOI] [PubMed] [Google Scholar]
- Curtis MJ, Bond RA, Spina D, Ahluwalia A, Alexander SPH, Giembycz MA, et al (2015). Experimental design and analysis and their reporting: new guidance for publication in BJP . Br J Pharmacol 172: 3461–3471. [DOI] [PMC free article] [PubMed] [Google Scholar]
- DeFronzo RA (1988). Lilly lecture 1987. The triumvirate: beta‐cell, muscle, liver. A collusion responsible for NIDDM. Diabetes 37: 667–687. [DOI] [PubMed] [Google Scholar]
- Evron T, Daigle TL, Caron MG (2012). GRK2: multiple roles beyond G protein‐coupled receptor desensitization. Trends Pharmacol Sci 33: 154–164. [DOI] [PMC free article] [PubMed] [Google Scholar]
- Ferri C, Bellini C, Desideri G, Di Francesco L, Baldoncini R, Santucci A, et al (1995). Plasma endothelin‐1 levels in obese hypertensive and normotensive men. Diabetes 44: 431–436. [DOI] [PubMed] [Google Scholar]
- Gomes AR, Soares AG, Peviani S, Nascimento RB, Moriscot AS, Salvini TF (2006). The effect of 30 minutes of passive stretch of the rat soleus muscle on the myogenic differentiation, myostatin, and atrogin‐1 gene expressions. Arch Phys Med Rehabil 87: 241–246. [DOI] [PubMed] [Google Scholar]
- Harada T, Horinouchi T, Higa T, Hoshi A, Higashi T, Terada K, et al (2014). Endothelin‐1 activates extracellular signal‐regulated kinases 1/2 via transactivation of platelet‐derived growth factor receptor in rat L6 myoblasts. Life Sci 104: 24–31. [DOI] [PubMed] [Google Scholar]
- Horinouchi T, Higashi T, Higa T, Terada K, Mai Y, Aoyagi H, et al (2012). Different binding property of STIM1 and its novel splice variant STIM1L to Orai1, TRPC3, and TRPC6 channels. Biochem Biophys Res Commun 428: 252–258. [DOI] [PubMed] [Google Scholar]
- Horinouchi T, Terada K, Higashi T, Miwa S (2013). Endothelin receptor signaling: new insight into its regulatory mechanisms. J Pharmacol Sci 123: 85–101. [DOI] [PubMed] [Google Scholar]
- Imamura T, Vollenweider P, Egawa K, Clodi M, Ishibashi K, Nakashima N, et al (1999). G alpha‐q/11 protein plays a key role in insulin‐induced glucose transport in 3 T3‐L1 adipocytes. Mol Cell Biol 19: 6765–6774. [DOI] [PMC free article] [PubMed] [Google Scholar]
- Jin P, Sejersen T, Ringertz NR (1991). Recombinant platelet‐derived growth factor‐BB stimulates growth and inhibits differentiation of rat L6 myoblasts. J Biol Chem 266: 1245–1249. [PubMed] [Google Scholar]
- Kamikawa Y, Ikeda S, Harada K, Ohwatashi A, Yoshida A (2013). Passive repetitive stretching for a short duration within a week increases myogenic regulatory factors and myosin heavy chain mRNA in rats' skeletal muscles. Scientific World Journal 2013: ID 493656. [DOI] [PMC free article] [PubMed] [Google Scholar]
- Kim I, Yang D, Tang X, Carroll JL (2011). Reference gene validation for qPCR in rat carotid body during postnatal development. BMC Res Notes 4: ID 440. [DOI] [PMC free article] [PubMed]
- Knight SD, Adams ND, Burgess JL, Chaudhari AM, Darcy MG, Donatelli CA, et al (2010). Discovery of GSK2126458, a highly potent inhibitor of PI3K and the mammalian target of rapamycin. ACS Med Chem Lett 1: 39–43. [DOI] [PMC free article] [PubMed] [Google Scholar]
- Koch WJ, Hawes BE, Inglese J, Luttrell LM, Lefkowitz RJ (1994). Cellular expression of the carboxyl terminus of a G protein‐coupled receptor kinase attenuates Gβγ‐mediated signaling. J Biol Chem 269: 6193–6197. [PubMed] [Google Scholar]
- Kurose H, Nishida M, Nagao T (1999). βγ subunit of heterotrimeric G protein as a new target molecule for drug development. Folia Pharmacol Jpn 114: 75–80. [DOI] [PubMed] [Google Scholar]
- Laplante M, Sabatini DM (2012). mTOR signaling in growth control and disease. Cell 149: 274–293. [DOI] [PMC free article] [PubMed] [Google Scholar]
- Lerman A, Edwards BS, Hallett JW, Heublein DM, Sandberg SM, Burnett JCJ (1991). Circulating and tissue endothelin immunoreactivity in advanced atherosclerosis. N Engl J Med 325: 997–1001. [DOI] [PubMed] [Google Scholar]
- Leto D, Saltiel AR (2012). Regulation of glucose transport by insulin: traffic control of GLUT4. Nat Rev Mol Cell Biol 13: 383–396. [DOI] [PubMed] [Google Scholar]
- Liu S, Premont RT, Kontos CD, Zhu S, Rockey DC (2005). A crucial role for GRK2 in regulation of endothelial cell nitric oxide synthase function in portal hypertension. Nat Med 11: 952–958. [DOI] [PubMed] [Google Scholar]
- Lteif A, Vaishnava P, Baron AD, Mather KJ (2007). Endothelin limits insulin action in obese/insulin‐resistant humans. Diabetes 56: 728–734. [DOI] [PubMed] [Google Scholar]
- Mitsumoto Y, Burdett E, Grant A, Klip A (1991). Differential expression of the GLUT1 and GLUT4 glucose transporters during differentiation of L6 muscle cells. Biochem Biophys Res Commun 175: 652–659. [DOI] [PubMed] [Google Scholar]
- Mitsumoto Y, Klip A (1992). Development regulation of the subcellular distribution and glycosylation of GLUT1 and GLUT4 glucose transporters during myogenesis of L6 muscle cells. J Biol Chem 267: 4957–4962. [PubMed] [Google Scholar]
- Nevzorova J, Bengtsson T, Evans BA, Summers RJ (2002). Characterization of the β‐adrenoceptor subtype involved in mediation of glucose transport in L6 cells. Br J Pharmacol 137: 9–18. [DOI] [PMC free article] [PubMed] [Google Scholar]
- Nishida M, Maruyama Y, Tanaka R, Kontani K, Nagao T, Kurose H (2000). G αi and G αo are target proteins of reactive oxygen species. Nature 408: 492–495. [DOI] [PubMed] [Google Scholar]
- Öberg A, Dehvari N, Bengtsson T (2011). β‐Adrenergic inhibition of contractility in L6 skeletal muscle cells. PLoS One 6: e22304. [DOI] [PMC free article] [PubMed] [Google Scholar]
- Obici S, Feng Z, Karkanias G, Baskin DG, Rossetti L (2002). Decreasing hypothalamic insulin receptors causes hyperphagia and insulin resistance in rats. Nat Neurosci 5: 566–572. [DOI] [PubMed] [Google Scholar]
- Ottosson‐Seeberger A, Lundberg JM, Alvestrand A, Ahlborg G (1997). Exogenous endothelin‐1 causes peripheral insulin resistance in healthy humans. Acta Physiol Scand 161: 211–220. [DOI] [PubMed] [Google Scholar]
- Pawson AJ, Sharman JL, Benson HE, Faccenda E, Alexander SPH, Buneman OP et al, NC‐IUPHAR (2014) The IUPHAR/BPS Guide to PHARMACOLOGY: an expert‐driven knowledge base of drug targets and their ligands. Nucl. Acids Res. 42 (Database Issue): D1098‐1106. [DOI] [PMC free article] [PubMed] [Google Scholar]
- Pernow J, Shemyakin A, Böhm F (2012). New perspectives on endothelin‐1 in atherosclerosis and diabetes mellitus. Life Sci 91: 507–516. [DOI] [PubMed] [Google Scholar]
- Rodríguez‐Pascual F, Busnadiego O, Lagares D, Lamas S (2011). Role of endothelin in the cardiovascular system. Pharmacol Res 63: 463–472. [DOI] [PubMed] [Google Scholar]
- Rubin LJ (2012). Endothelin receptor antagonists for the treatment of pulmonary artery hypertension. Life Sci 91: 517–521. [DOI] [PubMed] [Google Scholar]
- Ruest LB, Marcotte R, Wang E (2002). Peptide elongation factor eEF1A‐2/S1 expression in cultured differentiated myotubes and its protective effect against caspase‐3‐mediated apoptosis. J Biol Chem 277: 5418–5425. [DOI] [PMC free article] [PubMed] [Google Scholar]
- Sarbassov DD, Guertin DA, Ali SM, Sabatini DM (2005). Phosphorylation and regulation of Akt/PKB by the rictor‐mTOR complex. Science 307: 1098–1101. [DOI] [PubMed] [Google Scholar]
- Schalin‐Jäntti C, Yki‐Järvinen H, Koranyi L, Bourey R, Lindström J, Nikula‐Ijäs P, et al (1994). Effect of insulin on GLUT‐4 mRNA and protein concentrations in skeletal muscle of patients with NIDDM and their first‐degree relatives. Diabetologia 37: 401–407. [DOI] [PubMed] [Google Scholar]
- Shemyakin A, Salehzadeh F, Esteves Duque‐Guimaraes D, Böhm F, Rullman E, Gustafsson T, et al (2011). Endothelin‐1 reduces glucose uptake in human skeletal muscle in vivo and in vitro. Diabetes 60: 2061–2067. [DOI] [PMC free article] [PubMed] [Google Scholar]
- Shepherd PR, Nave BT, Rincon J, Haigh RJ, Foulstone E, Proud C, et al (1997). Involvement of phosphoinositide 3‐kinase in insulin stimulation of MAP‐kinase and phosphorylation of protein kinase‐B in human skeletal muscle: implications for glucose metabolism. Diabetologia 40: 1172–1177. [DOI] [PubMed] [Google Scholar]
- Shisheva A (2008). Phosphoinositides in insulin action on GLUT4 dynamics: not just PtdIns(3,4,5)P3 . Am J Physiol Endocrinol Metab 293: E536–E544. [DOI] [PMC free article] [PubMed] [Google Scholar]
- Takahashi K, Ghatei MA, Lam HC, O'Halloran DJ, Bloom SR (1990). Elevated plasma endothelin in patients with diabetes mellitus. Diabetologia 33: 306–310. [DOI] [PubMed] [Google Scholar]
- Touyz RM, Schiffrin EL (2003). Role of endothelin in human hypertension. Can J Physiol Pharmacol 81: 533–541. [DOI] [PubMed] [Google Scholar]
- Tsakiridis T, McDowell HE, Walker T, Downes CP, Hundal HS, Vranic M, et al (1995). Multiple roles of phosphatidylinositol 3‐kinase in regulation of glucose transport, amino acid transport, and glucose transporters in L6 skeletal muscle cells. Endocrinology 136: 4315–4322. [DOI] [PubMed] [Google Scholar]
- Usui I, Imamura T, Babendure JL, Satoh H, Lu JC, Hupfeld CJ, et al (2005). G protein‐coupled receptor kinase 2 mediates endothelin‐1‐induced insulin resistance via the inhibition of both Gαq/11 and insulin receptor substrate‐1 pathways in 3 T3‐L1 adipocytes. Mol Endocrinol 19: 2760–2768. [DOI] [PubMed] [Google Scholar]
- Usui I, Imamura T, Huang J, Satoh H, Olefsky JM (2003). Cdc42 is a Rho GTPase family member that can mediate insulin signaling to glucose transport in 3 T3‐L1 adipocytes. J Biol Chem 278: 13765–13774. [DOI] [PubMed] [Google Scholar]
- Usui I, Imamura T, Satoh H, Huang J, Babendure JL, Hupfeld CJ, et al (2004). GRK2 is an endogenous protein inhibitor of the insulin signaling pathway for glucose transport stimulation. EMBO J 23: 2821–2829. [DOI] [PMC free article] [PubMed] [Google Scholar]
- Yanagisawa M, Kurihara H, Kimura S, Tomobe Y, Kobayashi M, Mitsui Y, et al (1988). A novel potent vasoconstrictor peptide produced by vascular endothelial cells. Nature 332: 411–415. [DOI] [PubMed] [Google Scholar]
Associated Data
This section collects any data citations, data availability statements, or supplementary materials included in this article.
Supplementary Materials
Figure S1 Changes in mRNA expression level for ETA receptors (A), Gq protein (B), G11 protein (C), GRK2 (D), InsR (E), Akt2 (F) and GLUT4 (G) during differentiation of myoblasts into myotubes for 7 days. Semiquantitative RT‐PCR experiments were carried out using total RNA prepared from 5 individual cell populations. Ordinate represents relative expression levels at Day 7 against Day 0. Data are presented as means ± SEM of the results obtained from 5 experiments. * P < 0.05, ** P < 0.01, significantly different from unity.
Figure S2 ET‐1 induces phosphorylation of ERK1/2 but not Akt in L6 myotubes. The cells were treated with 30 nM ET‐1 for indicated times. Representative immunoblots were obtained using antibodies to phospho‐Akt at Thr308 [p‐Akt (T308)], phospho‐Akt at Ser473 [p‐Akt (S473)], total Akt (t‐Akt), phospho‐ERK1/2 (p‐ERK1/2), and total ERK1/2 (t‐ERK1/2).
Figure S3 No interaction of endogenous IRS‐1 with FLAG‐GRK2 is detected in L6 myotubes. Upper panel for immunoprecipitated samples (IP: α‐normal IgG or FLAG): FLAG‐tagged GRK2 proteins were immunoprecipitated with anti‐FLAG antibody. Immunoprecipitates were probed with the anti‐IRS‐1 antibody to estimate co‐immunoprecipitated endogenous IRS‐1. Lower panel for IP: FLAG‐tagged GRK2 proteins were immunoprecipitated with anti‐FLAG antibody, and the immunoprecipitates were probed with the anti‐FLAG‐HRP antibody to normalize the quantity of co‐immunoprecipitated endogenous Akt. Upper panel for whole cell lysate (WCL): the expressed IRS‐1 was detected with the anti‐IRS‐1 antibody. Lower panel for WCL: the expressed FLAG‐GRK2 was detected with the anti‐FLAG‐HRP antibody.
Figure S4 Effects of YM‐254890 on Akt phosphorylation in response to 5 min exposure to 300 nM insulin in L6 myotubes. The cells were treated with 300 nM YM‐254890 for 30 min before stimulation with insulin. Representative immunoblots were obtained using antibodies to phospho‐Akt at Thr308 [p‐Akt (T308)], phospho‐Akt at Ser473 [p‐Akt (S473)], and total Akt (t‐Akt). Ordinate represents Akt phosphorylation responses which are normalized to the level of insulin‐stimulated Akt phosphorylation in L6 myotubes without treatment with YM‐254890. Data are presented as means ± SEM of the results obtained from 5 experiments.Supplementary METHODS. Measurement of mRNA expression levels for ETA receptors, Gq protein, G11 protein, GRK2, InsR, Akt2 and GLUT4 by semiquantitative RT‐PCR. Supplementary Movie S1. Spontaneous contraction of L6 myotubes (Day 7).
Supporting info item
Supporting info item
Supporting info item
Supporting info item
Supporting info item
Supporting info item


