

Abstract
Aim:
The most ubiquitous chest diagnostic method is the chest radiograph. A common radiographic finding, quite often incidental, is the nodular pulmonary lesion. The detection of small lesions out of complex parenchymal structure is a daily clinical challenge. In this study, we investigate the efficacy of the computer-aided detection (CAD) software package SoftView™ 2.4A for bone suppression and OnGuard™ 5.2 (Riverain Technologies, Miamisburg, OH, USA) for automated detection of pulmonary nodules in chest radiographs.
Subjects and Methods:
We retrospectively evaluated a dataset of 100 posteroanterior chest radiographs with pulmonary nodular lesions ranging from 5 to 85 mm. All nodules were confirmed with a consecutive computed tomography scan and histologically classified as 75% malignant. The number of detected lesions by observation in unprocessed images was compared to the number and dignity of CAD-detected lesions in bone-suppressed images (BSIs).
Results:
SoftView™ BSI does not affect the objective lesion-to-background contrast. OnGuard™ has a stand-alone sensitivity of 62% and specificity of 58% for nodular lesion detection in chest radiographs. The false positive rate is 0.88/image and the false negative (FN) rate is 0.35/image. From the true positive lesions, 20% were proven benign and 80% were malignant. FN lesions were 47% benign and 53% malignant.
Conclusion:
We conclude that CAD does not qualify for a stand-alone standard of diagnosis. The use of CAD accompanied with a critical radiological assessment of the software suggested pattern appears more realistic. Accordingly, it is essential to focus on studies assessing the quality-time-cost profile of real-time (as opposed to retrospective) CAD implementation in clinical diagnostics.
Keywords: Bone suppression imaging, chest radiograph, computer-aided detection, lung cancer, pulmonary nodule

Introduction
The most ubiquitous chest diagnostic method is the chest radiograph. A common radiographic finding, often incidental, is the nodular pulmonary lesion. This term comprises nodular opacities ranging from 1 to 30 mm with a broad distribution of morphology, allocation, number, and clustering patterns. The long list of nodular lesion differential diagnosis ranges from benign granulomas to sessile or metastatic lung cancer.[1]
Detection of pulmonary nodules in routine chest radiographs is a daily clinical challenge. Not only the detection of small lesions within a complex parenchymal structure but also the ability to discriminate between true lesions and overlapping structures, surroundings or background noise quite often overwhelms the diagnostic efficacy of the observer. As a result many nodular lesions remain undiagnosed and many unspecific nodular projections are perceived as pulmonary lesions in the daily practice. The detection rate of pulmonary nodules has been estimated 81.4% by experienced radiologists and 81.2% by radiology assistants.[2] The concept of computer-aided detection (CAD) implements computational methods to improve the diagnostic efficacy. CAD software products use image analysis algorithms to reduce the background noise, increase the signal-to-noise ratio and implement image segmentation and pattern recognition techniques that automatically detect nodular lesions in limited time.
In this study, we have retrospectively tested SoftView™ 2.4A and OnGuard™ 5.2 CAD systems (Riverain Technologies, Miamisburg, OH, USA) in a collective of 100 patients with histologically proven nodular pulmonary lesions and revised the relevant literature.
Subjects and Methods
Ethics
All patient data derived from the database of the Suedharz Hospital Nordhausen. Patients have been informed consent for all therapeutic decisions. Data were analyzed retrospectively, fully anonymized, in accordance with the ethical standards laid down in the 1964 Declaration of Helsinki and its amendments as well as with the guidelines of the Ethical Committee for clinical studies of the University of Jena. No therapeutic decision has been influenced by the purpose of this study.
Study design
This is a retrospective, fully anonymized study on data from 100 patients (64 men and 36 women) with a mean age of 67 years (range 35–93 years). Inclusion criterion for the study was a posterior-anterior (PA) chest radiograph with pulmonary lesions larger than 5 mm (5–85 mm, average 20 mm). One lesion per patient was analyzed and, in case of multiple lesions, we prioritized by size (the largest of multiple lesions was selected). All lesions were confirmed with computed tomography (CT) and histologically proven unless otherwise specified for small lesions.
Within all included lesions (n = 100), 75 were malignant (75%) and 25 were benign (25%). In case of multiple PA images, the one with the shortest time interval to the CT examination was chosen, with a maximum time lag of 3 months.
Image acquisition
All radiographs were obtained using either ddRCombi Plus (Swissray Medical AG, Hochdorf, Switzerland; 64 patients were examined; 64%) or Axiom Luminos dRF (Siemens Healthcare GmbH, Erlangen, Germany; 36 patients were examined; 36%).
Both devices have a built-in digital amorphous silicon flat panel detector with an active detector area of 43 × 43 cm. ddRCombi Plus has a matrix of 3000 × 3000 elements, 143 µm pixel size, and 14-bit digitization depth. Axiom Luminos has a matrix of 2840 × 2880 elements, 148 µm pixel size, and 16-bit digitization depth. The exposure parameters were 125 kV, 80 mA, 1 mAs, focal spot ≤1.3, antiscatter grid: r = 12, and 400 speed with 150 cm focus-detector distance.
For multislice chest-CT imaging, we implemented a 128-layers scanner (Siemens Definition AS +) with the dedicated software SOMARIS, Syngo CT2008G (Siemens Healthcare GmbH, Erlangen, Germany).
All data were stored in DICOM format and analyzed on 3 megapixel ME355i2 diagnostic monitors (Totoku; Rein Medical GmbH, Willich-Anrath, Germany).
Computer-aided detection system
The CAD software package comprised SoftView™ 2.4A for bone suppression imaging (BSI) and OnGuard™ 5.2 for nodule detection and was purchased from Riverain (Riverain Technologies, Miamisburg, OH USA). SoftView™ for BSI uses a filter tuned to recognize structures that are consistent with ribs and clavicles in PA/anteroposterior (AP) chest radiographs. The estimated bone image is then subtracted from the standard PA/AP image.
OnGuard™ uses an image segmentation algorithm to spot regions of interest (ROIs) that resemble solitary pulmonary nodules on chest radiographs. The steps of BSI and nodule detection succeed each other automatically. Candidate regions are compared with a prototype database and all attributes statistically similar to a solitary pulmonary nodule are graphically defined as ROIs.
The software has a maximum detection capacity of five ROIs per image and a detection threshold of 5 mm, which defines our patient selection criteria. Analysis of the lateral radiograph image was rejected due to poor detection rates and abundance of false positive (FP) in a pilot run (data not shown).
Data analysis
Suspicious lesions were divided by size into five subgroups as follows: S1 <10 mm (19 patients, 19%), S2 <2 0 mm (41 patients, 41%), S3 <30 mm (20 patients, 20%), S4 <40 mm (9 patients, 9%), and S5 >40 mm (11 patients, 11%).
Lesion mean density ± σ was measured with circular ROIs in chest radiographs before (control, CTL) and after bone subtraction (BSI). ROIs were adjusted to the lesion size and kept consistent for lesion and background measurements pairwise. The normalized lesion-to-background density ratio was further used as quantitative standard and is defined as “contrast” throughout the text.
Lesion character was histologically proved by the Pathology Department of Suedharz Hospital Nordhausen. Calcified lesions not qualifying for a biopsy were reexamined in a CT follow-up and in case of no progress classified as benign granulomas.
Statistical analysis
The Statistical Package for the Social Sciences software (version 21, IBM, Armonk, NY, USA) was used for statistical analysis and graphical plotting. Data were screened for normality using Shapiro–Wilk test. Values are expressed as a mean ± standard error of the mean and rounded up to the second decimal place. Statistical significance was tested using t-test/rank-sum Mann–Whitney test for unpaired and paired t-test/Wilcoxon test for paired data. Variance analysis in nonpaired data series was performed with one-way ANOVA or Kruskal–Wallis ANOVA on ranks. Linear correlations were tested with Pearson product moment correlation coefficient for normally distributed data or Spearman rank correlation coefficient otherwise. The continuous probability distribution over a set of positive real numbers was tested by means of the Chi-squared test. Statistical significance threshold was set to P < 0.05.
Results
The tested CAD software aims to improve image contrast using a bone suppression algorithm and automatically detect pulmonary coin lesions in conventional PA radiographs. In a sample radiograph with multiple coin lesions before [Figure 1a] and after BSI [Figure 1b], the CAD software has detected two coin lesions [Figure 1c]. CT has confirmed the validity of detection [Figure 1d and e]. Note that lesions are easier to spot in the BSI. Lack of bone artifacts helps focusing the attention span in the lung parenchymal pattern, consequently reducing the probability of a lesion undergoing radiologist's attention.
Figure 1.
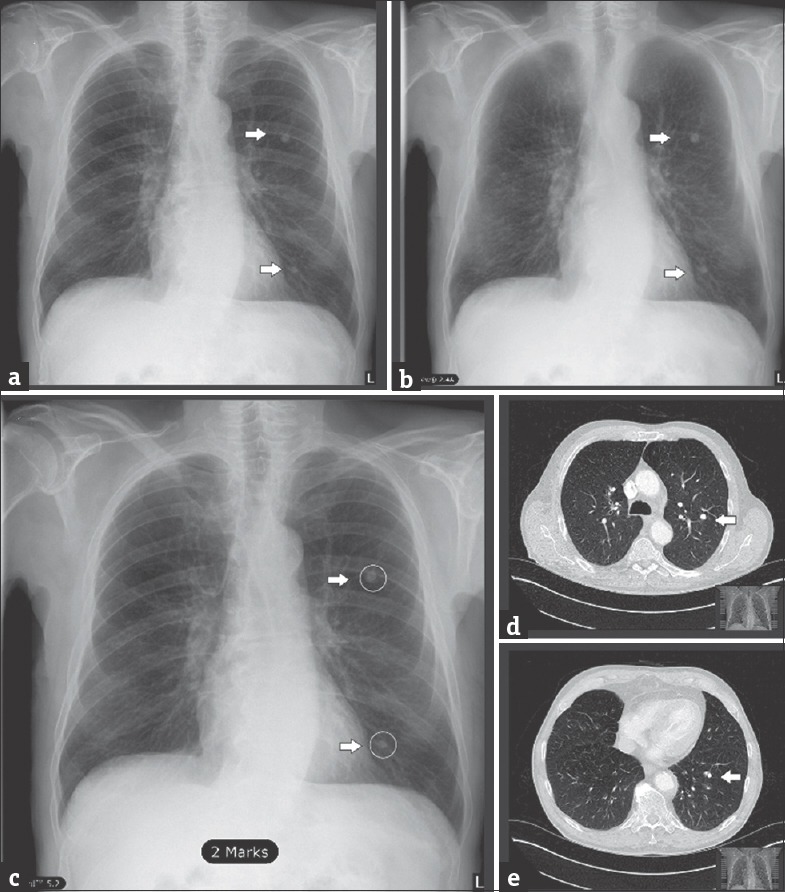
Sample images for bone suppression imaging and computer-aided detection lesion identification (a) unprocessed posteroanterior chest radiograph (CTL), (b) posteroanterior chest radiograph after bone suppression imaging, (c) posteroanterior chest radiograph with lesions as detected by computer-aided detection (white arrows and circles). (d and e) Spiral computed tomography scans in axial plane, lung-window reconstruction, confirmation of the detected lesions in a-c (white arrows).
To quantify the contrast-to-background improvement on radiograph images by bone subtraction, we compared image pairs before (CTL) and after processing (BSI). Gathering all lesion sizes [Figure 2a] returns no statistical significance (CTL = 1.34 ± 0.30, BSI = 1.34 ± 0.31, P = 0.735, n = 100, Wilcoxon Rank-sum test). Due to the three-dimensional character of pulmonary lesions, the X-ray attenuation and consequently the lesion's contrast are linearly dependent on the size [Figure 2b] in both CTL and BSI with minimal differences (P = 0.45 × 10⁻³, R = 0.35 for CTL and P = 0.017 × 10⁻³, R = 0.42 for BSI, n = 100, Pearson's test). This suggests that the bone suppression algorithm does not drastically modify the basic radiograph properties and attenuation proportions. Size-based lesion grouping [Figure 2c and Table 1] showed no significant differences in lesion contrast for groups S1-S5 [Table 1].
Figure 2.

(a) Contrast after bone suppression imaging; P = 0.735, n = 100, Wilcoxon Rank-sum test. (b) Contrast is positively correlated with size in control (CTL) and bone-suppression imaging; (P, R) = (0.45 × 10⁻³, 0.35) for CTL and (0.017 × 10⁻³, 0.42) for bone-suppression imaging, n = 100, Pearson's test. (c) No significance for all nodule sizes, detailed statistics shown in Table 1. (d) Contrast in association to surrounding structures, P = 0.115 for CTL and P = 0.099 for bone-suppression imaging, one-way ANOVA. Contrast is unaffected by bone-suppression imaging: bone n = 95, P = 0.676, Wilcoxon; soft tissue n = 10, P = 0.508, paired t-test; no neighbor n = 5, P = 0.631, paired t-test.
Table 1.
Bone suppression imaging effect on the nodular pulmonary lesion's contrast-to-background
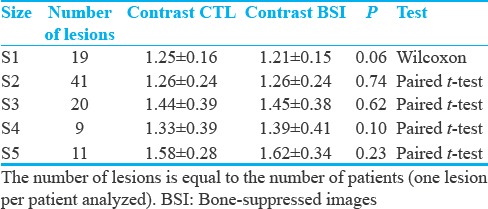
This result indicates that BSI does not achieve any relevant improvement of the lesions’ contrast-to-background opacity.
An important factor obscuring nodular lesion detection is the vicinity to nonparenchymal structure projections. We questioned the effect of various structure vicinities on the measured lesion's contrast with and without BSI [Figure 2d]. Three subgroups were created according to the nature of the neighboring structure: (a) bone (95%), (b) soft tissue (10%; this subgroup includes mediastinum, pleura, and diaphragm), and (c) no neighbor (5%). From n = 100 lesions, many displayed vicinity to more than one structure and have been counted accordingly. The lesion's contrast appears to be irrelevant to the neighboring structure (P = 0.115 for CTL and P = 0.099 for BSI, one-way ANOVA) and unaffected by BSI: bone n = 95, P = 0.676, Wilcoxon; soft tissue n = 10, P = 0.508, paired t-test; no neighbor n = 5, P = 0.631, paired t-test.
Summarizing the above, bone suppression algorithm seems to subjectively improve radiograph images by artifact removal, however without proving any significant objective contrast improvement, regardless of the lesion size and vicinity associations.
CAD analysis automatically marked 210 lesions in 100 patients (total positive lesions; to 210). All detected lesions were optically assessed for validity; 88 of them were FP (88) and 197 were true positive (TP = 197). The character of the FP lesions comprised mostly hilar structures (n = 22 lesions, 25%), followed by bones (n = 20 lesions, 23%) and the rest was summarized as unspecific [Figure 3]. CAD analysis showed 62% sensitivity and 58% specificity. The FP rate (FPR) was 0.88/image and the false negative rate was (FNR) 0.35/image.
Figure 3.
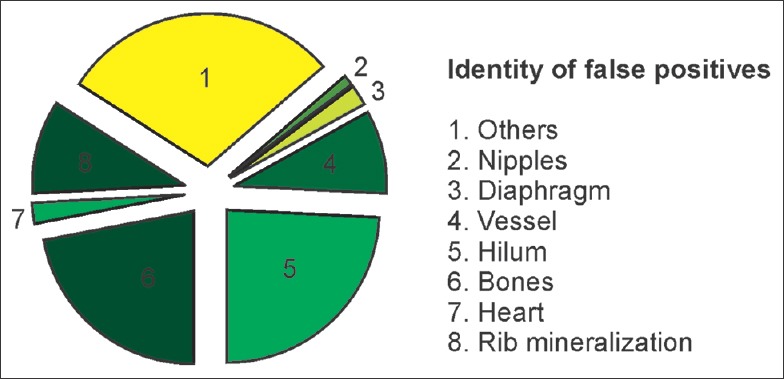
Identity of false positive lesions.
Optically detected lesions (n = 100) were histologically proved as 75% malignant (n = 75 patients) and 25% benign (n = 25 patients). The majority of malignant lesions were pulmonary metastasis (n = 48), followed by bronchial cancer. About 13 lesions were histologically characterized as benign and 10 as granulomas [Figure 4].
Figure 4.
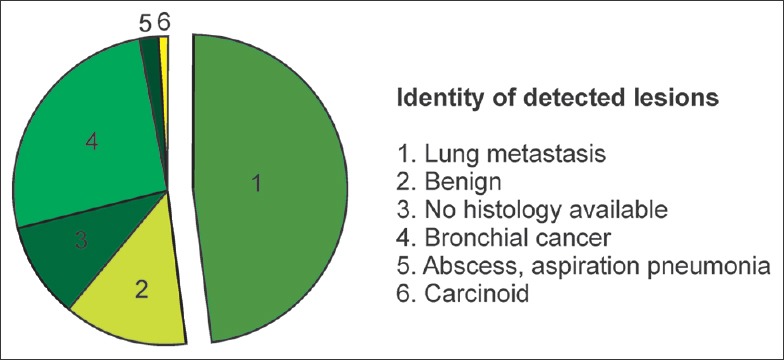
Identity of optically detected lesions.
From the histologically proven lesions (n = 100, the largest lesion per patient from n = 100 patients), TP lesions as detected by the CAD software were 20% benign and 80% malignant. FN lesions were 47% benign and 53% malignant, respectively. The Chi-square test returned a significantly positive correlation between the detection probability and malignancy (P = 0.012, n = 100) [Table 2]. Thus, malignant lesions seem to have a significantly higher probability to be detected by the CAD software compared to benign ones. Since the detection algorithm is contrast-sensitive, this result indicates that malignant lesions might possess different contrast values compared to benign ones. However, paired analysis [Figure 5] demonstrates no contrast differences between benign and malignant lesions with or without BSI (CTL: P= 0.39, t-test; BSI: P =0.781, Mann–Whitney U-test).
Table 2.
Computer-aided detection in association to lesion dignity
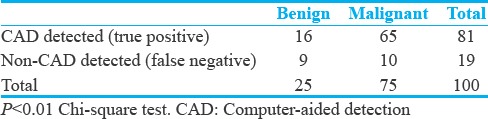
Figure 5.
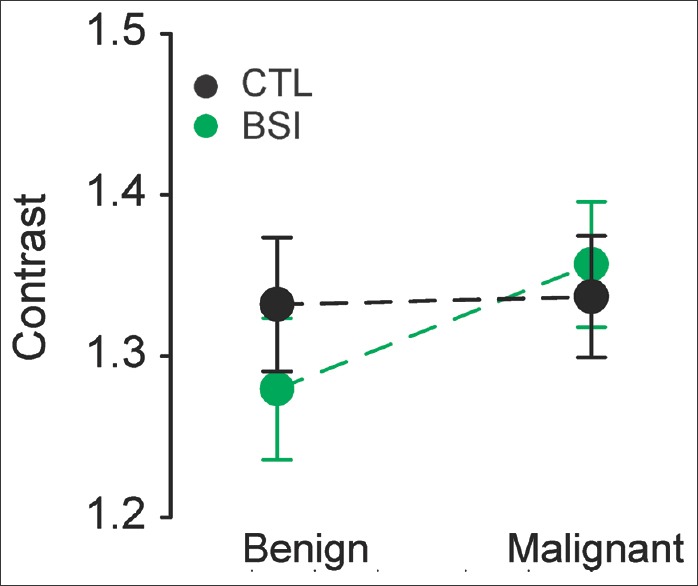
Contrast of benign and malignant lesions before (CTL) and after bone suppression (bone-suppression imaging). No difference was observed between benign and malignant lesions in either CTL or bone-suppression imaging images; n = 25 benign and n = 75 malignant nodules; CTL: P =0.39, t-test; bone-suppression imaging P = 0.781, Mann–Whitney U-test.
Conclusively, CAD has shown 62% sensitivity and 58% specificity for the detection of pulmonary nodular lesions in chest radiographs. Moreover, the software significantly favored the detection of malignant lesions as opposed to benign ones, without this results being explainable with dignity-dependent contrast differences.
Discussion
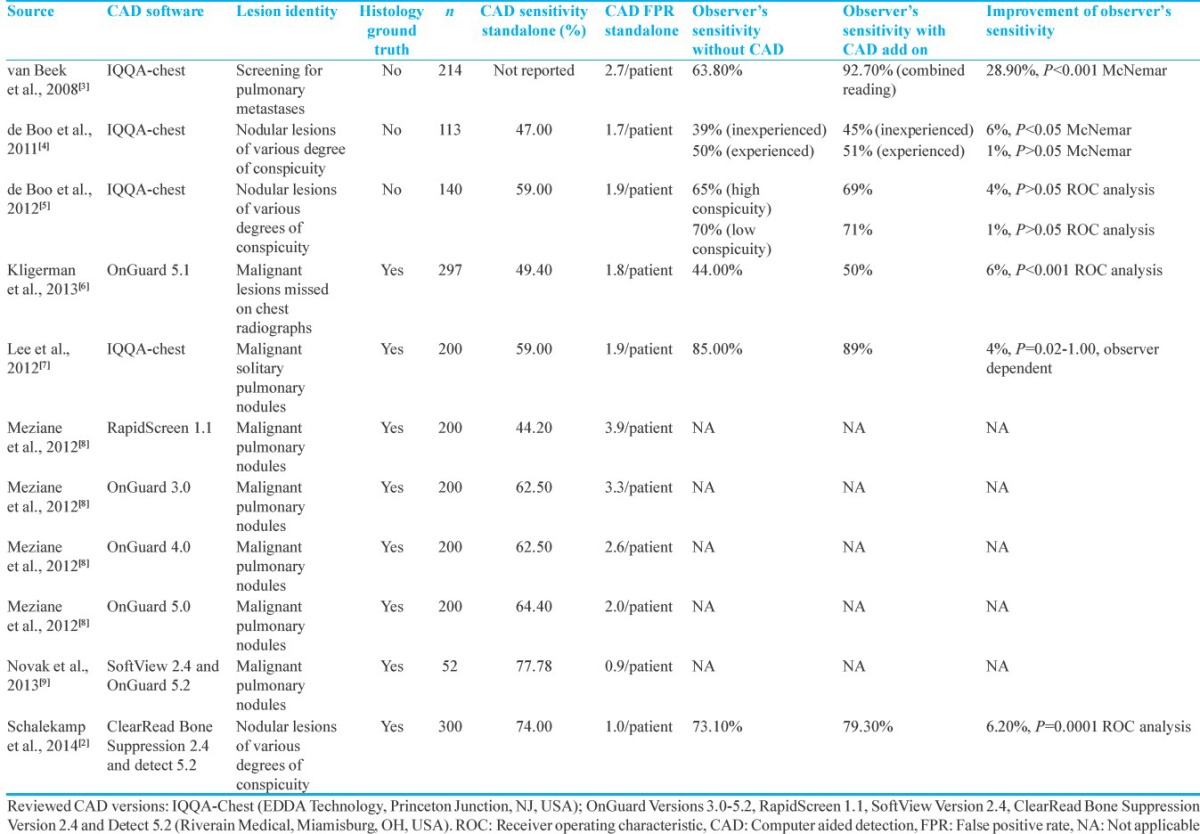
Independently published clinical studies, summarized in Table 3 showed that the diagnostic chest radiograph reading of pulmonary malignant lesions was significantly improved with software assistance.[10,11] In the aforementioned studies, experienced radiologists independently evaluated randomized and blinded chest radiographs with and without BSI, concluding that BSI improves radiologist's performance by 4% and 17%, respectively. Similar results verifying the diagnostic value of bone suppression software have been demonstrated for other than malignant lung lesions such as pulmonary aspergillosis and focal pneumonia.[12,13,14] In those studies, detection sensitivity was significantly improved by 17% and 4%, respectively. Another study investigated the value of BSI in the detection of nodular bronchial carcinoma lesions with average diameter 20 mm in standard versus dual-energy chest radiographs.[14] Consistent to previous results, BSI improved the detection rate of nodular lesions in standard radiographs by 10%. A further, albeit small improvement of the detection rate by 18% could be achieved by the implementation of dual energy subtraction. The authors, however, critically concluded that the additional equipment requirements and radiation exposure of the dual energy imaging do not sufficiently compensate for the small improvement in detection rate.[14]
Table 3.
Literature review of computer-aided detection of pulmonary nodules in chest radiographs
All in all, previous studies agree that BSI improves the diagnostic detection rates by experienced radiologists. However, none of them report on the objective image improvement, i.e., on the lesion contrast-to-background enhancement, which could have explained the improved detection rates after BSI. Our study uses a large patient sample to solidly demonstrate that BSI does not affect the objective lesion-to-background contrast. Thus, evidence-based assessment of our results suggests that BSI improves diagnosis independent of lesion-to-background contrast, most likely due to a subjective attention span improvement resulting from pattern simplification after ablation of bone artifacts.
Several CAD software applications have become commercially available in the last years, aiming to accelerate, standardize, and maybe improve the detection rate of pulmonary lesions in chest radiographs compared to observational diagnosis. Others and we have investigated the reliability of CAD and whether this can really (totally or partially) substitute observational diagnosis by experienced radiology specialists.
In accordance with previous results, our CAD analysis showed a sensitivity of 62% and a specificity of 58%. The FPR was 0.88/image and the FNR was 0.35/image. In previous studies, CAD stand-alone sensitivity was 59% with FPR 1.9 FP/image.[5] The study of Schalekamp et al., not only showed a higher sensitivity of 74% but also in turn a higher FPR of 1/image.[2] In another study comparing different versions of CAD systems, the sensitivity of the newest tested version OnGuard 5 was 64.4% and the FPR was 2/image.[8] Moreover, the stand-alone performance of a CAD system on preprocessed chest radiographies with two different bone suppression algorithms revealed a sensitivity of <80% and a specificity of <50%, both independent of the bone suppression algorithm applied. Therefore, the reliability of CAD software as a stand-alone standard of clinical diagnosis was severely doubted by the authors.[9]
Abandoning the stand-alone CAD usage, more studies have focused on defining the value of CAD software packages as a diagnostic adjuvant. The questioned parameters of CAD diagnosis are in this case not only the sensitivity and the specificity in performance but also the associated time costs in the clinical routine. A retrospective study using the OnGuard™ CAD software package (Riverain) has been designed to question the potential advantage of a CAD-assisted observational diagnosis of lung nodules compared to nonassisted observation.[6] For this purpose, 297 chest radiographs with 81 FN diagnoses underwent independent and blinded reevaluation without and with CAD assistance. Interestingly, OnGuard increased the detection sensitivity from 44% to 50%, thus supporting the value of a CAD-assisted rather than that of a CAD-based diagnosis.[6] However, authors do not report on the associated time costs. The same group has extended the question and further investigated whether CAD-assisted lung nodule detection could be indeed superior to the observational diagnosis on BSI.[2] CAD has substantially improved radiologists’ performance for the detection of lung nodules on chest radiographs from 73.1% to 79.3%, even when baseline performance was optimized by providing lateral radiographs and BSIs.[2] In line with this, De Boo et al., showed that CAD improves the sensitivity of inexperienced readers (39% vs. 45%) for the detection of small nodules at the expense of loss of sensitivity.[4] Another study suggested that the CAD system may help improve the observer's performance in detecting malignant lung nodules on chest radiographs. The sensitivities with and without CAD were 87% and 84%, whereas the FP/case with and without CAD was 0.19 and 0.17, respectively.[7] Similar results have been published by an independent group, where the CAD-assisted diagnosis has not only improved the sensitivity from 63.8% to 92.7% at the cost of a small decrease in specificity from 98.1% to 96.2% but also injected a non negligible increase in FPR to 2.7 FP/case.[3]
Conclusion
Summarizing the above, others and our study suggest that CAD sensitivity <80%, specificity <50%, and FPR >1/image do not qualify for a stand-alone standard of diagnosis. The “hybrid” approach of CAD-assisted observational diagnosis, i.e., CAD implementation accompanied with a critical radiological assessment has been proven advantageous for the detection of lung nodules so far, nevertheless with additional time costs. It is essential to focus future study design on the cost-effect assessment of the time costs by real-time (as opposed to retrospective) CAD implementation in clinical diagnostics.
Financial support and sponsorship
Nil.
Conflicts of interest
There are no conflicts of interest.
Footnotes
Available FREE in open access from: http://www.clinicalimagingscience.org/text.asp?2017/7/1/8/200572
References
- 1.Khan AN, Al-Jahdali HH, Irion KL, Arabi M, Koteyar SS. Solitary pulmonary nodule: A diagnostic algorithm in the light of current imaging technique. Avicenna J Med. 2011;1:39–51. doi: 10.4103/2231-0770.90915. [DOI] [PMC free article] [PubMed] [Google Scholar]
- 2.Schalekamp S, van Ginneken B, Koedam E, Snoeren MM, Tiehuis AM, Wittenberg R, et al. Computer-aided detection improves detection of pulmonary nodules in chest radiographs beyond the support by bone-suppressed images. Radiology. 2014;272:252–61. doi: 10.1148/radiol.14131315. [DOI] [PubMed] [Google Scholar]
- 3.van Beek EJ, Mullan B, Thompson B. Evaluation of a real-time interactive pulmonary nodule analysis system on chest digital radiographic images: A prospective study. Acad Radiol. 2008;15:571–5. doi: 10.1016/j.acra.2008.01.018. [DOI] [PubMed] [Google Scholar]
- 4.De Boo DW, Uffmann M, Weber M, Bipat S, Boorsma EF, Scheerder MJ, et al. Computer-aided detection of small pulmonary nodules in chest radiographs: An observer study. Acad Radiol. 2011;18:1507–14. doi: 10.1016/j.acra.2011.08.008. [DOI] [PubMed] [Google Scholar]
- 5.De Boo DW, van Hoorn F, van Schuppen J, Schijf L, Scheerder MJ, Freling NJ, et al. Observer training for computer-aided detection of pulmonary nodules in chest radiography. Eur Radiol. 2012;22:1659–64. doi: 10.1007/s00330-012-2412-7. [DOI] [PMC free article] [PubMed] [Google Scholar]
- 6.Kligerman S, Cai L, White CS. The effect of computer-aided detection on radiologist performance in the detection of lung cancers previously missed on a chest radiograph. J Thorac Imaging. 2013;28:244–52. doi: 10.1097/RTI.0b013e31826c29ec. [DOI] [PubMed] [Google Scholar]
- 7.Lee KH, Goo JM, Park CM, Lee HJ, Jin KN. Computer-aided detection of malignant lung nodules on chest radiographs: Effect on observers’ performance. Korean J Radiol Off J Korean Radiol Soc. 2012;13:564–71. doi: 10.3348/kjr.2012.13.5.564. [DOI] [PMC free article] [PubMed] [Google Scholar]
- 8.Meziane M, Mazzone P, Novak E, Lieber ML, Lababede O, Phillips M, et al. A comparison of four versions of a computer-aided detection system for pulmonary nodules on chest radiographs. J Thorac Imaging. 2012;27:58–64. doi: 10.1097/RTI.0b013e3181f240bc. [DOI] [PubMed] [Google Scholar]
- 9.Novak RD, Novak NJ, Gilkeson R, Mansoori B, Aandal GE. A comparison of computer-aided detection (CAD) effectiveness in pulmonary nodule identification using different methods of bone suppression in chest radiographs. J Digit Imaging. 2013;26:651–6. doi: 10.1007/s10278-012-9565-4. [DOI] [PMC free article] [PubMed] [Google Scholar]
- 10.Li F, Hara T, Shiraishi J, Engelmann R, MacMahon H, Doi K. Improved detection of subtle lung nodules by use of chest radiographs with bone suppression imaging: Receiver operating characteristic analysis with and without localization. AJR Am J Roentgenol. 2011;196:W535–41. doi: 10.2214/AJR.10.4816. [DOI] [PubMed] [Google Scholar]
- 11.Freedman MT, Lo SC, Seibel JC, Bromley CM. Lung nodules: Improved detection with software that suppresses the rib and clavicle on chest radiographs. Radiology. 2011;260:265–73. doi: 10.1148/radiol.11100153. [DOI] [PubMed] [Google Scholar]
- 12.Schalekamp S, van Ginneken B, van den Berk IA, Hartmann IJ, Snoeren MM, Odink AE, et al. Bone suppression increases the visibility of invasive pulmonary aspergillosis in chest radiographs. PLoS One. 2014;9:e108551. doi: 10.1371/journal.pone.0108551. [DOI] [PMC free article] [PubMed] [Google Scholar]
- 13.Li F, Engelmann R, Pesce L, Armato SG, Macmahon H. Improved detection of focal pneumonia by chest radiography with bone suppression imaging. Eur Radiol. 2012;22:2729–35. doi: 10.1007/s00330-012-2550-y. [DOI] [PubMed] [Google Scholar]
- 14.Li F, Engelmann R, Pesce LL, Doi K, Metz CE, Macmahon H. Small lung cancers: Improved detection by use of bone suppression imaging – Comparison with dual-energy subtraction chest radiography. Radiology. 2011;261:937–49. doi: 10.1148/radiol.11110192. [DOI] [PMC free article] [PubMed] [Google Scholar]