Abstract
Cerium dioxide nanoparticles (nanoceria), currently used as catalysts including additives to diesel fuel, also present potential as a novel therapeutic agent for disorders involving oxidative stress. However, little is known about the effects of nanoceria on primary human cells involved in the innate immune response. Here, we evaluate nanoceria effects on monocyte derived macrophages (MDMs) from healthy human subjects.
Peripheral blood monocytes were isolated from healthy human volunteers. MDMs were obtained by maturing monocytes over a five-day period. MDMs were exposed to well-characterized nanoceria suspensions (0, 5, 10, 20 µg/mL) for 24 or 48 hours. We evaluated particle uptake, ultrastructural changes, cytotoxicity, and mitochondrial damage in MDMs through transmission electron microscopy (TEM), confocal imaging, flow cytometry, spectrometry, western blots, and immunofluorescence techniques. The role that intracellular concentration of nanoceria plays in the toxicity of MDMs was evaluated by 3D image analysis and compared to monocytes as a nanoceria sensitive cell model.
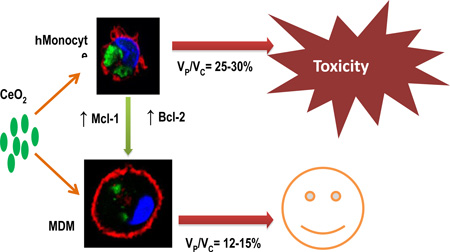
Nanoceria failed to induce cytotoxicity in MDMs at the tested doses. Nanoceria-exposed MDMs showed no mitochondrial damage and displayed significant accumulation of anti-apoptotic proteins (Mcl-1 and Bcl-2) during the maturation process. TEM and confocal analyses revealed efficient uptake of nanoceria by MDMs, however 3D image analyses revealed lower nanoceria accumulation per unit cell volume in MDMs compared to monocytes.
Taken together, our results suggest that mitochondrial protection and reduced volume-corrected intracellular nanoparticle concentration account for the lower sensitivity of human MDMs to nanoceria.
Keywords: Nanoceria, nanotoxicity, monocyte-derived macrophages, mitochondrial damage
Graphical Abstract
INTRODUCTION
Nano-sized cerium dioxide (nanoceria; CeO2) is a multifunctional nanomaterial with significant industrial as well as consumer product applications. Industrial applications of nanoceria include catalysis, polishing, UV shielding, and nanocomposites. 1–3 Catalytic properties of nanoceria have led to their major environmental application as a diesel fuel additive (for reducing emission of diesel particles coupled with increased fuel efficiency). 4,5 Recent research has also pointed towards beneficial impacts of nanoceria-based antioxidant therapy for many disorders in which free radicals play a key role, e.g., neurodegeneration, radiation damage, and cardiomyopathy. 6–8 Based on the above-mentioned utilizations and a significant number of other biomedical and industrial applications that would lead to increased human exposure to nanoceria, the Organization for Economic Co-operation and Development has nominated nanoceria to the priority list of nanomaterials requiring toxicological evaluation. 9,10
Monocytes and macrophages are phagocytes that play an important role in innate and adaptive immune responses. Macrophage functions include clearance of pathogens and foreign materials, initiation and resolution of inflammation, antigen presentation, and activation of adaptive immune response. Recently, macrophages have also been found to play a central role in wound healing, development, tissue homeostasis, and cancer progression. 11 Circulating monocytes are recruited into tissues and differentiate into macrophages. 12
Nanomaterial-induced toxic impacts on immune cells can significantly influence the ability of the body to maintain homeostasis and mount an effective as well as appropriate immune response. Initial recognition of nanomaterials by the immune system is an essential determinant for the fate and distribution of these materials inside the body and the subsequent health outcome. 13 Furthermore, nanomaterial-induced impairment of immune function could potentially outweigh the benefits of not only biomedical nanoparticle applications, but industrial applications as well, if the nanomaterial presents a hazard upon release into the environment. Only a limited number of studies have focused on assessing the toxicity of nanomaterials in primary human cells, which more closely represent in vivo outcomes. 14–17 However, multiple observations of cell death and inflammation inducing abilities of nanomaterials have been made using various cell lines and rodent models. 17–20
In this study, we aimed to elucidate the effects of nanoceria exposure in primary human monocyte-derived macrophages (MDMs). We demonstrate that nanoceria did not induce cytotoxicity and mitochondrial damage in MDMs. We observed significant accumulation of anti-apoptotic Bcl-2 family proteins in MDMs over the maturation process. We further demonstrate that nanoceria was internalized in lower amounts per unit cell volume in MDMs than monocytes. In aggregate, our results suggest that MDMs are significantly resistant to nanoceria toxicity, and this resistance may be due to decreased volume-corrected uptake as well as increased mitochondrial protection. Our findings therefore suggest possible strategies for reducing nanoceria toxicity to tissues after environmental or therapeutic exposure.
MATERIALS AND METHODS
Nanoparticles
Nanoceria
Nanoceria was acquired from Meliorum Technologies (Rochester, NY, USA) and microceria was procured from Sigma-Aldrich (St. Louis, MO, USA). Nanoparticles were characterized for shape and diameter via transmission electron microscopy (TEM), crystal structure via X-ray diffraction analysis (XRD), and surface area via the Brunauer-Emmitt-Teller (BET) method. Suspension behaviors such as hydrodynamic diameter, size distribution and zeta potential were determined using dynamic light scattering (ZetaSizer Nano, Malvern Instruments, Westborough, MA). Electrophoretic mobility (an approximation of particle surface charge) was converted into zeta potential using the Helmholtz-Smoluchowski equation. Purity of NP formulations was determined via thermogravimetric analysis (TGA) or inductivity coupled plasma mass spectrometry (ICP-MS). Bacterial endotoxin levels were determined using limulus amebocyte lysate assay. A nanoceria stock was prepared at 1 mg/mL in sterile water and stored at 4°C in a refrigerator. All exposure suspensions for experimentation were freshly prepared from this stock solution after sonication (9 pulses of 20 s at 235 W, each with a 5 s pause) using a Misonix S 4000 cuphorn sonicator (Qsonica LLC, Newton, CT, USA). After sonication and brief vortex, the particles were suspended in cell culture medium and exposed to cells within 5 min.
Modification of nanoceria with fluorescein
Fluorescein (fluorescein isothiocyananate [FITC], Sigma) was attached to nanoceria using a modified published procedure 21. In a glass vial, 20 mg of nanoceria was dispersed in 15 ml of ethanol using a bath sonicator for 10 min, after which 2.5 µl of APTES (3-aminopropyltriethoxysilane, Gelest) was added, and the mixture was stirred overnight. The suspension was then transferred to a 50-ml centrifuge tube, ethanol (VWR) was added to 45 ml, and the suspension was centrifuged at 5000xg for 10 min twice (Eppendorf 5904R). The solid was resuspended in 12.5 ml ethanol, and 2.5 ml of 1 mg/ml FITC in ethanol was added. The suspension was covered with foil and stirred overnight, after which ethanol was added to 40 ml and the suspension was centrifuged at 5000xg for 10 min 3 times. The orange precipitate was dried under vacuum and stored covered until further use.
Nanoceria-fluorescein was characterized by multiple methods. UV-VIS and fluorescence spectroscopies were performed using a Cary 100 Spectrophotometer and a Cary Eclipse Fluorescence Spectrophotometer (600V PMT voltage and 490 nm excitation wavelength). Fourier transform infrared spectroscopy (FT-IR) was used to determine attachment of FITC on nanoceria. FT-IR spectra were taken using a Thermo Electron Nicolet 8700.
Study Subjects and Isolation of Peripheral Blood Monocytes
The NIEHS Institutional Review Board approved the protocol for this study. Healthy adult volunteers with no history of chronic medical conditions or chronic medication use were recruited to the NIEHS Clinical Research Unit. Population demographics are presented in Table 1. Whole blood (200 mL) was withdrawn from an antecubital vein into citrated blood collection tubes. Mononuclear cells were isolated by gradient centrifugation using Histopaque (Sigma-Aldrich, St. Louis, MO, USA). Mononuclear cells were incubated with anti-CD14 microbeads. Mononuclear cells were then passed through a column within a magnetic field. The retained magnetically labeled CD14+ monocytes in the column were isolated and quantified for experimentation according to manufacturer recommendations (Miltenyi Biotec, Boston, MA, USA). By this method, 95–99% viable pure human monocytes were obtained. Isolation of monocytes was confirmed by flow cytometry and cytospin preparations.
Table 1.
Population Demographics
| Age (Years) |
Gender (Male/Female) |
Race (African American/Asian/Caucasian/ Multi-racial |
Medications |
|---|---|---|---|
| 37.4±9.5 | 26/19 | 17/1/22/5 | None |
Experimental Design and Maturation of Monocytes into Monocyte-Derived Macrophages (MDMs)
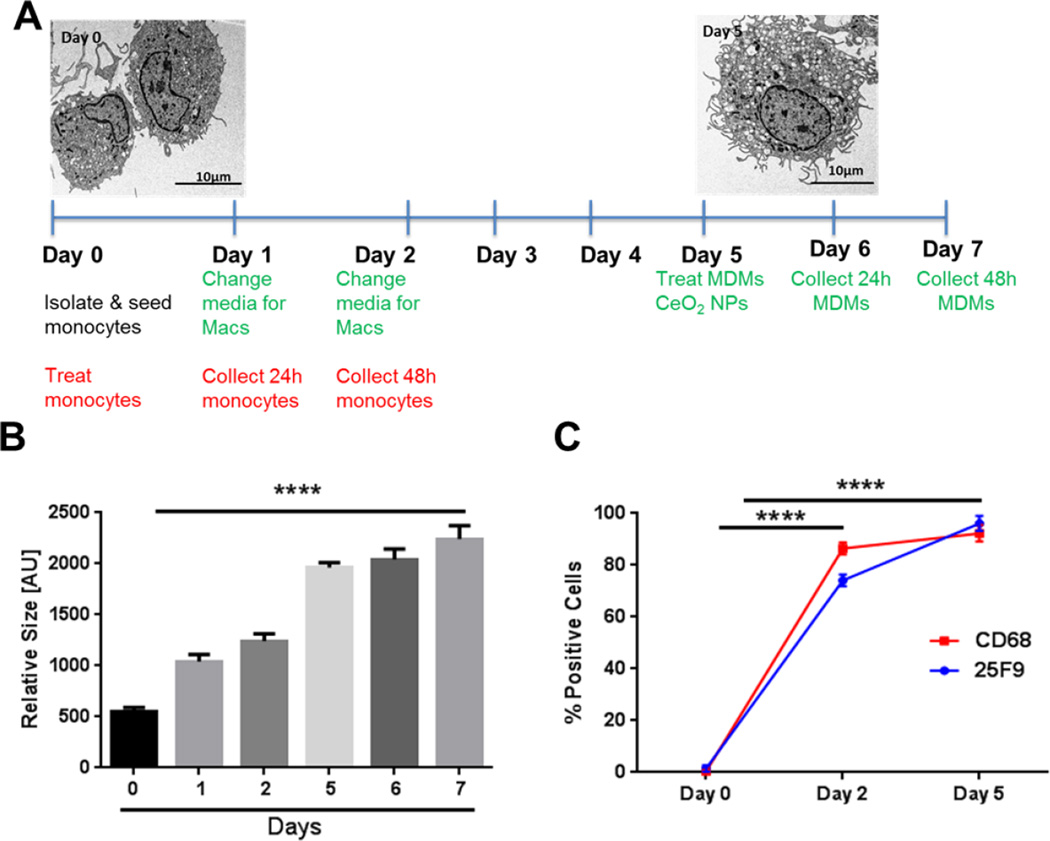
Detailed layout of experimental design in given in Figure 1A. MDMs were prepared following a previously published method with slight modifications 22. Monocytes were isolated and seeded at day 0 for attachment. Adherent cells were set to mature into MDMs over a five-day period in X-Vivo 10 medium (pH 7.1) (Lonza, Walkersville, MD, USA) supplemented with 1% human serum (pooled from 15 subjects). In order to restore growth factors and nutrients for adequate cell growth, media was changed at day 1 and 2. Differentiated MDMs at day 5 were treated with nanoceria for either 24 or 48 hours. Differentiation of monocytes to MDMs was analyzed by observation of cells by TEM, cell size estimations (flow cytometry), and expression of mature macrophage markers (25F9 and CD68, BD Biosciences, Franklin Lakes, NJ). Initial conditions (duration and additives) were optimized for MDM maturation over a two-week period. Initial observations confirmed that a five-day period was sufficient to get mature MDMs.
Figure 1. Experimental Layout and Maturation of Human Peripheral Blood Monocytes into Monocyte-Derived Macrophages.
A) Experimental time points and TEM images of monocytes (Day 0) and MDMs (Day 5). B) Cell size estimation (Day 0 - Day 7) by flow cytometry. C) Time course analysis of cell surface expression of mature macrophage markers (25F9) and intracellular expression of CD68 expression by flow cytometry. Data were analyzed by analysis of variance (ANOVA) followed by Tukey’s post hoc test. Graphs show average ± SEM of three independent experiments with triplicates of each condition. ****p < 0.0001 (compared to Day 0)
Culture Conditions and Treatment
After isolation, monocytes were seeded in cell culture plates and glass bottom culture dishes [MatTek Corporation (2,000,000 cells per dish)] in Ex-vivo cell culture medium (Lonza, Walkersville, MD, USA) supplemented with 1% pooled human serum, antibiotics [1 % solution of penicillin (100 µg/mL) and streptomycin (100 µg/mL), Invitrogen, Carlsbad, CA, USA], and 0.5 % antifungal amphotericin B [0.5% solution (250 µg/mL), Sigma-Aldrich, St. Louis, MO, USA] and incubated to allow for cell attachment at 37 °C, 5% CO2 and 95 % relative humidity for 2 h. Cell culture medium was then removed and cells were washed thoroughly with fresh medium to remove unattached cells.
Nanoceria exposure of monocytes/MDMs
Cells were incubated in fresh pre-warmed medium containing the desired concentration (0–20 µg/mL) of nanoceria for 24 and 48 h. These doses correspond to 0–5 µg/cm2 surface area-based dose. In addition, approximately one-half of monocytes isolated from the same patient were set to mature over a five-day time period into MDMs. After five-day maturation, MDMs were treated using the same method as monocytes.
Transmission Electron Microscopy
Monocytes and MDMs were treated with nanoceria for 24 hours, fixed using 3% glutaraldehyde and processed for TEM analysis. Thin sections (60 nm) were cut and stained with uranyl acetate and lead citrate after placing them on formvar-coated copper grids. Observations were made using FEI Tecnai 110 kV microscope at 80kV and digital images were taken.
Propidium Iodide (PI) Staining
Macrophages were treated with 0–20 µg/mL nanoceria for 24 or 48 h. Cells were then labeled with PI according to the manufacturer’s recommendations (Trevigen, Gaithersburg, MD, USA) using a BD FACSAria II Instrument (BD Biosciences, Franklin Lakes NJ) in order to determine whether apoptosis was involved in toxicity response in both cell types. At least 10,000 cells were analyzed to determine the percentage of dead cells.
Lactate Dehydrogenase (LDH) Release
LDH release from cells treated with different doses (0–20 µg/mL) of nanoceria for 24 and 48 h was measured using CytoTox 96 Non-Radioactive Cytotoxicity Assay (Promega, Madison, WI, USA) according to the manufacturer’s recommendations. Analysis was performed on a BioTek Synergy HT Microplate Reader. Potential interference in LDH assay due to presence of nanoceria was investigated according to a method described elsewhere and no evidence of interference was noted. 23
Reactive Oxygen species and Nitric Oxide production
ROS production and NO production were evaluated using Hydroethidine (HE) and DAF-FM Diacetate (4-Amino-5-Methylamino-2’,7’-Difluorofluorescein Diacetate) probes respectively. Cells were exposed to nanoceria (0–20 µg/mL) for 24 and 48 h, labeled according to manufacturer’s recommendations (Invitrogen, Thermo Fisher Scientific, Grand Island, NY, USA) and analyzed using a BD FACSAria II Instrument (BD Biosciences, Franklin Lakes NJ).
Laser Scanning Confocal Microscopy
Live cells were visualized using a Zeiss 710 NLO confocal microscope with a Plan-Apochromat 63×/1.4 oil DICM27 objective. Sequential line scanning with three laser excitations at 405 nm, 488 nm and 633 nm was performed using three photomultipliers with emission detections set at 415–476 nm, 503–610 nm and 634–735 nm. Gains of the three photomultiplier and laser intensities were kept constant during all experiments. The CellMask deep red stain loading protocol was altered to minimalize internalization by adding the recommended concentration of CellMask to the cell culture solution, after the sample was placed on the microscope stage, only 1 min before imaging.
Quantitative image analysis
Multichannel Z-stack images of the optical field were used for quantitative voxel-based measurements to quantify the volume of cells and nanoparticles using the staining pattern of fluorescence signals within the cells. Three channel image series correspond to fluorescent markers of CellMask stained plasma membrane, Dapi stained nucleus, and fluorescein tagged nanoparticles. The threshold value for image analysis was pre-tested for field-to-field or cell-to-cell intensity variations and fixed as a constant for final calculation. All pixels above the threshold were considered as belonging to an object for volume calculation. We used our own processing operations and an in-house written macro program, combining it with the existing “3D object counter” plug-in. 24 Volumes of cells and nanoparticles were calculated consecutively by using two separate imaging channels. The raw volumes were calculated by determining the number of voxels for an object in each channel. The volume voxels of each cell were calculated by using a binary mask after applying a threshold to the image stack. The final volume was calculated by using the number of voxels multiplied by the calibrated volume of one voxel in units of mm3. Calibration of one voxel volume was adjusted at each zoom value.
The red channel, deep red Cell Mask labeled plasma membrane of the cell was used for additional calculation of the cell surface area. The number of surface voxels for cell surface measurement was determined by the contact of background. It was calculated by determining the number of voxels lacking at least one of its 26 neighbors. 24 Cell volume and surface corrections were performed by subtracting the internalized CellMask label into the cell. Data were imported into SigmaPlot (Systat Software Inc. San Jose, CA, USA) for further calculation and statistical analysis. 3D images were created by ImageJ and Imaris BitPlane software (Oxford Instrument Comp. BitPlane AG Zurich, Switzerland).
Mitochondrial Membrane Potential Changes
MDMs were treated with nanoceria (0–20 µg/mL) for 24 or 48 h, and were then labeled with JC-1 dye (Invitrogen, Thermo Fisher Scientific, Grand Island, NY, USA), along with respective untreated controls, according to the manufacturer’s recommendations. Changes in mitochondrial membrane potential (ΔΨm)/ mitochondrial depolarization were observed using a BD FACSAria II Instrument (BD Biosciences, Franklin Lakes NJ). Images were taken using a Zeiss–Axiovert40 CFL microscope and processed using Image J software (NIH, USA).
Immunocytochemistry
Cells were incubated with nanoceria (0–20 µg/mL) for 24 and 48 h and fixed in 4 % paraformaldehyde in 4-well Nunc Lab-Tek II Chamber Slides (Sigma-Aldrich, St. Louis, MO, USA). Cells were permeabilized in 0.05% Tween-20 solution and blocked with 3 % bovine serum albumin. Mouse anti-Bax (6A7, Sigma-Aldrich, St. Louis, MO, USA) and rabbit anti-Mcl-1(S-19: sc-819, Santa Cruz, CA USA) primary antibodies were used at 1:1000 dilution. Alexa Fluor 488 IgG, at a dilution of 1:2500 (Invitrogen, Thermo Fisher Scientific, Grand Island, NY, USA) was used as a secondary antibody. Nuclei of cells were stained with Hoechst 33258 at 1 µg/mL (Thermo Fisher Scientific, Grand Island, NY, USA). Images were taken using a Zeiss–Axiovert40 CFL microscope and processed using Image J software (NIH, USA).
Apoptosis Inducing Factor (AIF) Protein Expression
MDMs were labeled with anti-AIF FITC antibody and isotype control antibody from Santa Cruz Biotechnology (Santa Cruz, CA, USA) according to manufacturer’s recommendations. Analysis was performed on a BD FACSAria II at 488 nm excitation and 530 nm emission wavelengths (BD Biosciences, Franklin Lakes NJ). Results are presented as fold increase in AIF values with respect to control.
Western Blot Analysis
Lysates from control and treated cells (nanoceria 0–20 µg/mL for 24 or 48h) were prepared by addition of RIPA Lysis and Extraction Buffer and Halt Phosphatase Inhibitor Cocktail (Thermo Fisher Scientific, Grand Island, NY, USA), followed by brief sonication of the cell-buffer mixture for 30 s (235 W) using a Misonix S 4000 cuphorn sonicator (Qsonica LLC, Newton, CT, USA). Measurement of protein concentration in cell lysates was performed according to manufacturer recommendations (Pierce BCA Protein Assay Kit, Thermo Fisher Scientific, Grand Island, NY, USA). Cell extracts containing 15 µg of protein were added to separate wells in a NuPAGE Bis-Tris gel. The gel was run using NuPAGE MES SDS running buffer and protein transfer was performed using NuPAGE transfer buffer onto a PVDF transfer membrane (Life Technologies, Omaha, NB, USA). Rabbit Bcl-2 was used as a primary antibody at a dilution of 1:1000 and anti-rabbit IgG (HRP-linked) was used as a secondary antibody at a dilution of 1:2500 (Cell Signaling Technology, Danvers, MA, USA). Blots were then developed in WesternBright ECL HRP substrate (Advansta, Menlo Park, CA, USA) for chemiluminescence imaging (G:Box F3, Syngene, Cambridge, UK) and band identification (GeneSys, Daly City, CA, USA). Expression of Bcl-2 was quantified by densitometry analysis (GeneTools-Syngene, Frederick, MD, USA).
Statistical Analysis
Every experiment was repeated using cells from 3 to 6 human subjects. Data are presented as average +/− standard error of the mean. Each experimental condition was done in triplicate for each individual. Mann-Whitney U test was performed on SigmaPlot (Systat Software Inc.) to analyze the nanoparticle uptake data. Normally distributed data were analyzed by one-way analysis of variance (ANOVA) followed by the Tuckey’s posthoc test using Graphpad software (Graphpad Prism 5.01, Graphpad Software Inc, San Diego, CA, USA). A level of p < 0.05 was considered significant for a given comparison.
RESULTS
Nanoparticle and Suspension Characterization
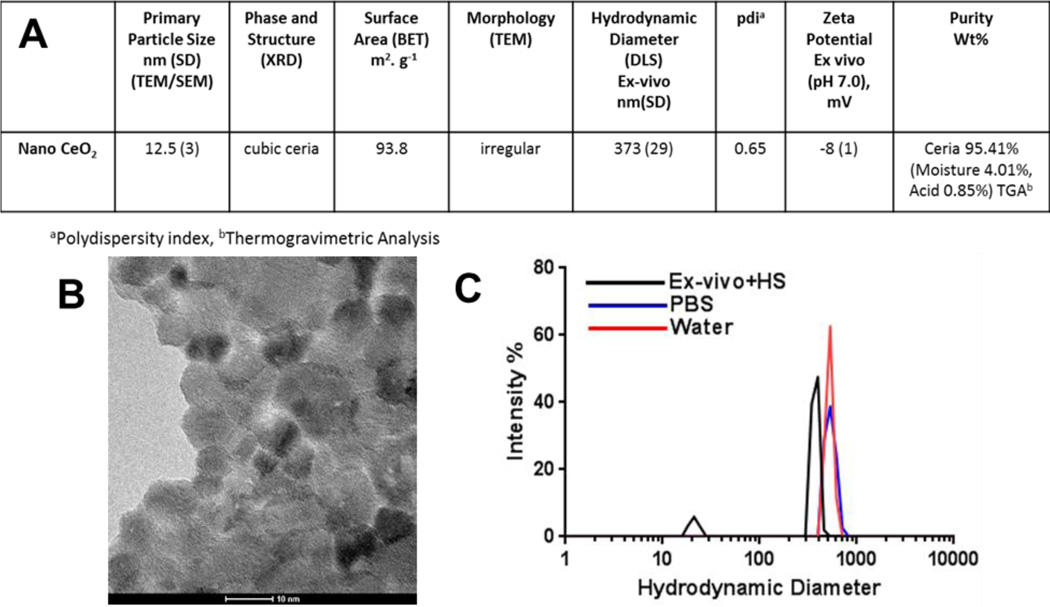
Detailed characterization of the nanoceria particles and particle suspensions are given in Figure 2A. The primary particle size, measured from TEM images, was determined to be 12.5 ± 3.0 nm. DLS measurements revealed that nanoceria formed polydisperse aggregates with a slightly smaller hydrodynamic diameter in exposure medium (ex-vivo + 1% human serum) compared to water and PBS (373, 522, and 528 nm, respectively). The zeta potential of nanoceria in exposure medium was −8 ± 1 mV, more negative than in water (17 ± 2 mV), suggesting that upon dilution in the medium, serum proteins partially adsorbed to the surface of the particles.
Figure 2. Characterization of nanoceria.
A) The physicochemical characteristics of nanoceria. B) TEM image of nanoceria. Image courtesy of Dr. A R Badireddy. C) Intensity-weighted size distributions of freshly prepared nanoceria suspensions in exposure medium (Ex-vivo medium + 1% serum), PBS, and water.
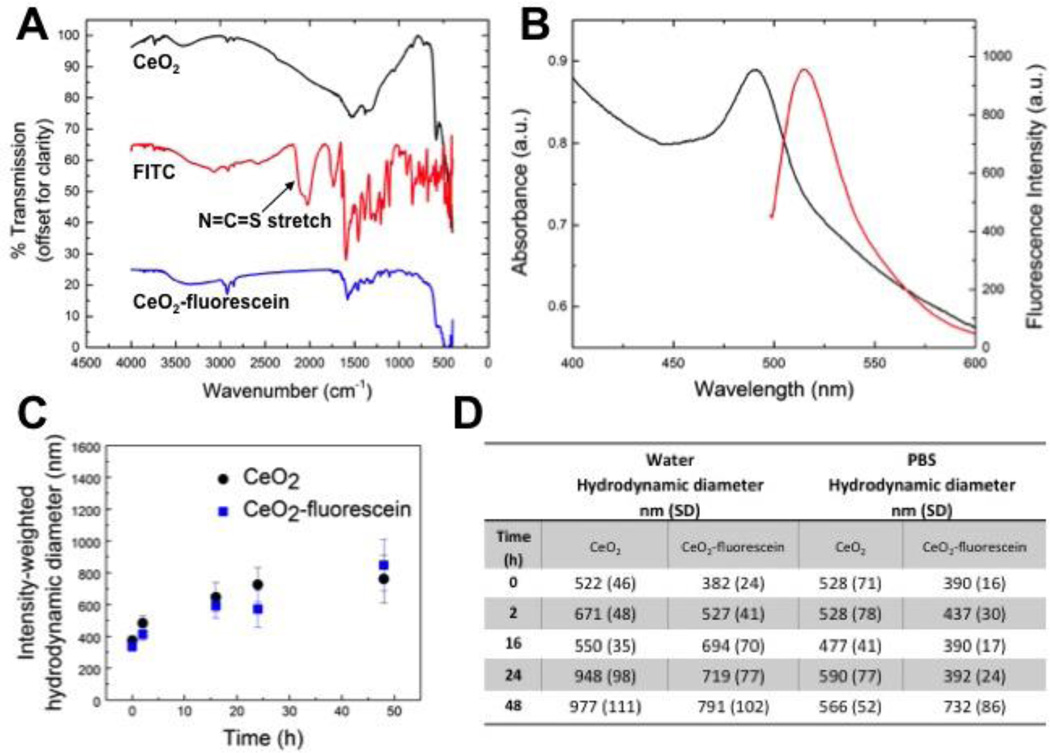
Purity analysis of nanoceria performed via TGA revealed 95.14 wt % pure ceria and minimal impurities (4.1 % moisture and 0.85 % acid contents). Surface area was determined by BET to be 93.8 m2•g−1. The FT-IR spectra of nanoceria, FITC, and nanoceria modified with fluorescein are shown in Figure 3A, offset for clarity. The spectrum of nanoceria-fluorescein is similar to that of pure FITC. One important difference is the disappearance of the N=C=S stretch in the nanoceria-fluorescein spectrum, indicating that the fluorescein is attached to the particles and not simply present as free FITC. The excitation and emission spectra of nanoceria-fluorescein (FITC) in water are shown in Figure 3B. The excitation and emission peak wavelengths are 490 nm and 520 nm, respectively. The stability of nanoceria over time, with and without fluorescein modification, in exposure medium, water, and PBS, was studied with DLS, and the results are presented in Figure 3C and D. These studies revealed that while a small amount of aggregation occurred over time, there were no significant changes in stability caused by the fluorescein modification of nanoceria in any suspension medium.
Figure 3. Characterization of fluorescein-modified nanoceria.
Fluorescein-modified nanoceria nanoparticles were characterized by A) FT-IR and B) UV-VIS and fluorescence spectroscopies. DLS analyses of particle suspension stability with fluorescein-modified and unmodified nanoceria in C) exposure medium (Ex vivo medium + 1%serum) and D) water and PBS. Particle suspensions were characterized at 0, 2, 16, 24 and 48 hours. Error bars and values in parentheses correspond to standard deviation of the measurements.
Characterization of Mature MDMs
We confirmed differentiation of monocytes to MDMs through different established criteria. First, TEM analysis was performed to monitor changes in cell size and morphology. We observed an increase in size, formation of lamellipodia, and an increase in nuclear to cytoplasm ratio in the MDMs as compared to monocytes (Figure 1A). Second, we measured cell size by flow cytometery (forward scatter analysis), which further confirmed TEM observations (Figure 1B). Third, we labeled cells with mature macrophage markers (25F9 and CD68). Both 25F9 and CD68 were not expressed by CD14+ monocytes (day 0) but showed strong upregulation with the passage of time, and by day 5 approximately 98–99 % of cells tested positive via analysis of expression by flow cytometry (Figure 1C).
Nanoceria Uptake by MDMs
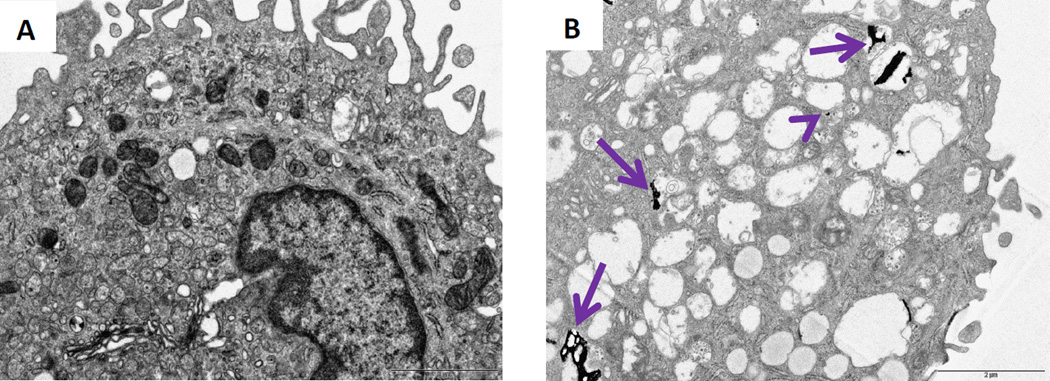
TEM analysis revealed that nanoceria was taken up by MDMs (Figure 4). Nanoceria induced extensive vesicle formation and formed flattened aggregates that were taken up into these vesicles (Figure 4B). Smaller nanoceria aggregates were also seen in the cytoplasm.
Figure 4. Ultrastructural (TEM) analyses of human MDMs after nanoceria exposure for 24 hours.
A) Control and B) nanoceria treated MDMs both at day 6. Arrows indicate ceria accumulation in the vesicles. Arrow head indicates free ceria in the cytoplasm
Nanoceria does not induce cytotoxicity and mitochondrial damage in MDMs
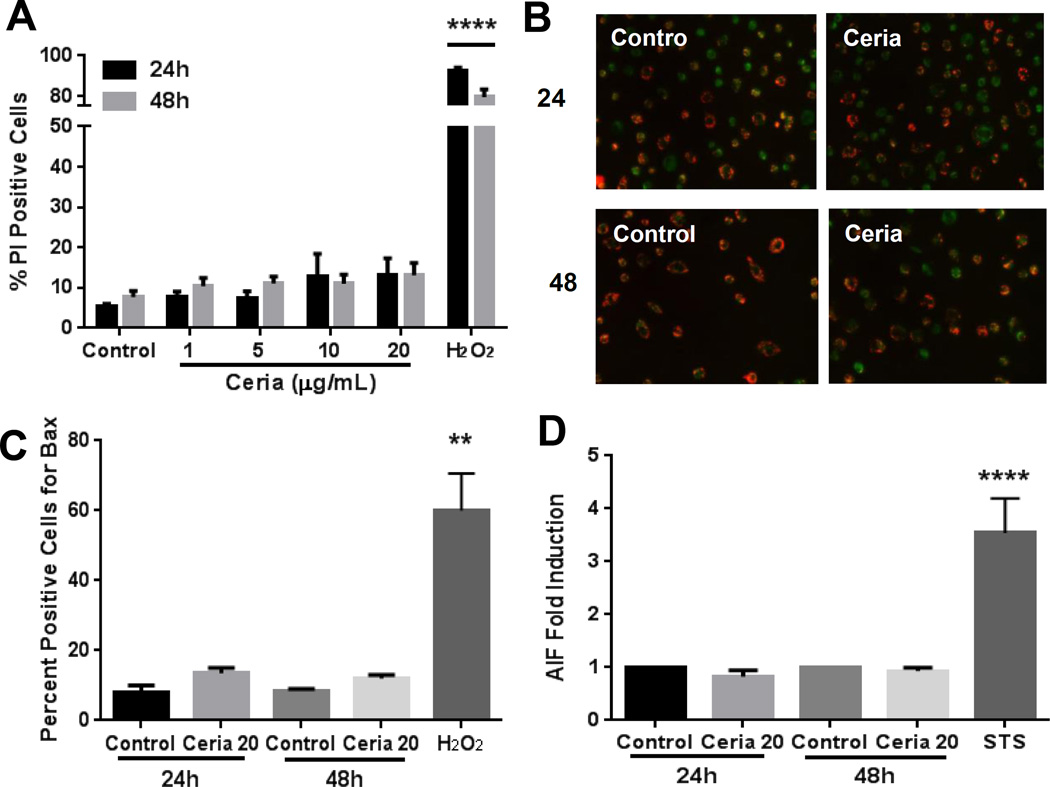
We employed time-course (24 and 48 hours) and dose response (1–20 µg/mL) strategies to evaluate potential cytotoxicity and mitochondrial damage by MDMs. We utilized two independent techniques, flow cytometry (PI labeling, Figure 5A) and spectrophotometry (LDH leakage, data not shown), and both confirmed the nontoxic response in MDMs. We further demonstrated that nanoceria did not induce loss of mitochondrial membrane potential (Figure 5B), activation of Bax (Figure 5C), or AIF expression (Figure 5D) in human MDMs. Moreover, no increase in ROS and NO production were noted after nanoceria exposure (data not shown).
Figure 5. Nanoceria does not induce cytotoxicity and mitochondrial damage in human MDMs.
A) MDMs were exposed to 0–20 µg/mL nanoceria for 24 or 48 hours and cell death was quantified by flow cytometry (propidium iodide staining). B) MDMs were exposed to 20 µg/mL nanoceria for 24 or 48 hours, labeled with JC-1 probe, and analyzed by fluorescent microscopy. C) MDMs were immunostained with an antibody against activated Bax (6A7) and analyzed by fluorescent microscopy. D) MDMs were labeled for AIF protein and analyzed by flow cytometry. H2O2 and Staurosporine (STS) were used as positive controls. Data are represented as mean ± SEM of at least 3–6 independent experiments with triplicates of each condition. Data were analyzed by analysis of variance (ANOVA) followed by Tukey’s post hoc test or students t-test. **p < 0.01, ****p < 0.0001 compared to untreated control
Maturation leads to accumulation of mitochondria-protective proteins in MDMs
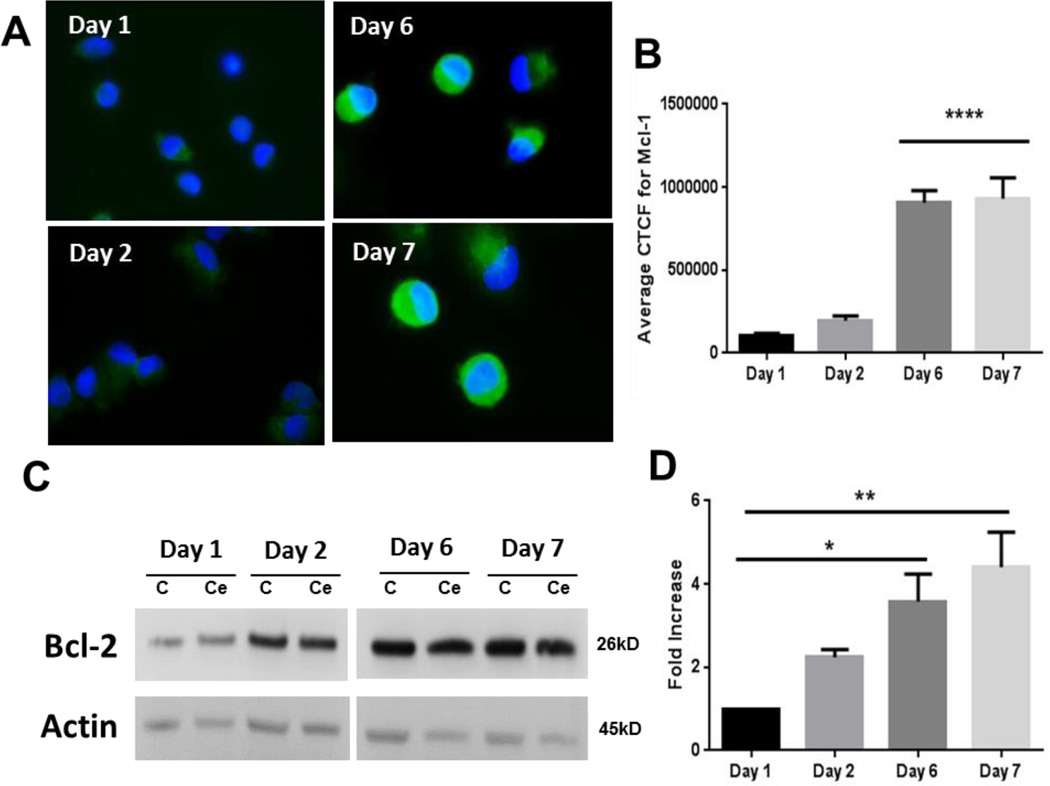
In order to better understand mitochondrial protection in MDMs, we further evaluated the levels of anti-apoptotic proteins. Maturation of monocytes into MDMs led to a significant increase in accumulation of mitochondrial protective protein Mcl-1, especially during the later stages of differentiation (Figure 6A, 6B). A similar increase was noted for another important mitochondria protective protein Bcl-2 (Figure 6C, 6D). We further noted that nanoceria did not induce any further change in the levels of these proteins (Figure 6C).
Figure 6. Differentiation dependent increase in expression of anti-apoptotic Mcl-1 and Bcl-2 proteins in human MDMs.
A) Representative images of Mcl-1 expression in cells during different time points of differentiation. B) Corrected total cell fluorescence (CTCF) for Mcl-1 during the maturation period. C) Representative western blot analysis of BcL-2 expression during the maturation of monocytes to MDMs with or without nanoceria exposure. D) Densitometry data of the Bcl-2 expression experiments (n=3). Data are presented as mean ± SEM and analyzed by ANOVA followed by Tukey’s posthoc test. *p < 0.05,**p < 0.01,****p < 0.0001 (compared to Day 1).
MDMs show significantly lower volume-corrected uptake of nanoceria than monocytes
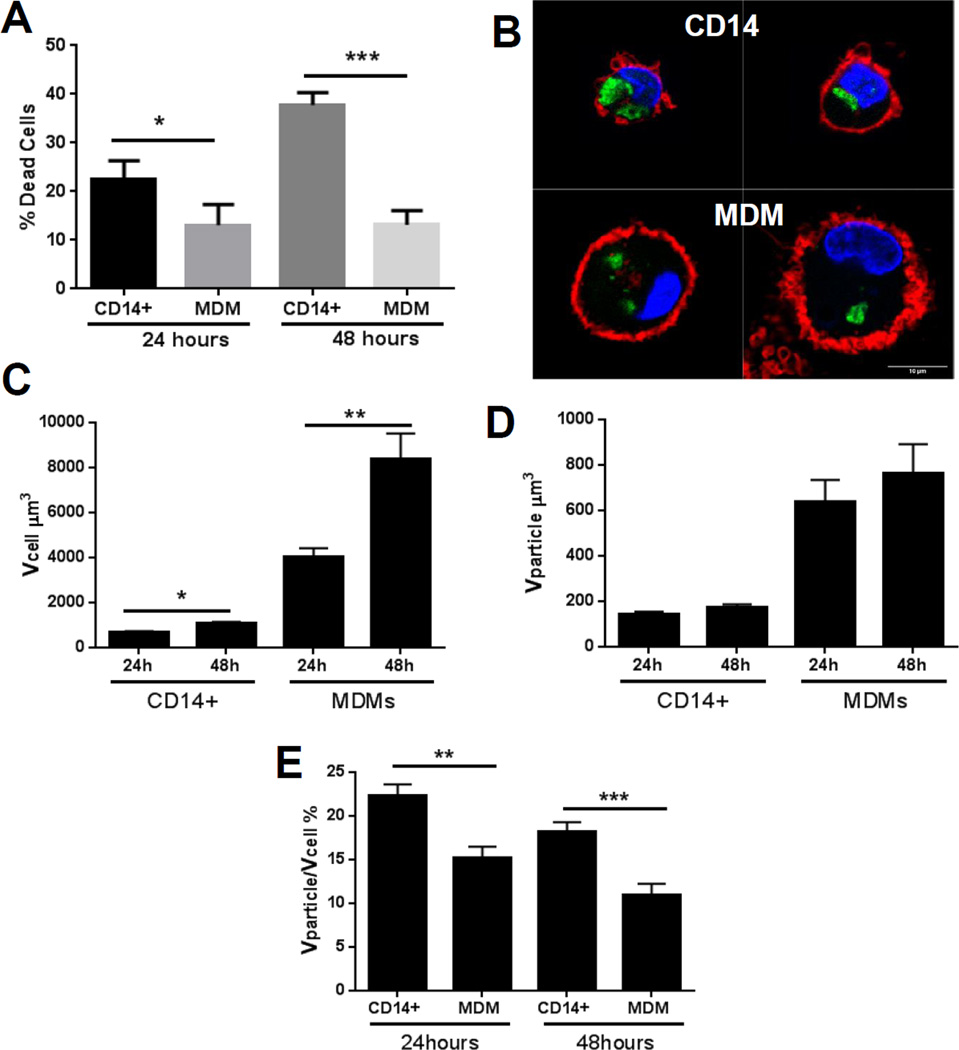
We employed primary human monocytes (CD14+ cells) as a nanoceria-sensitive model system to compare nanoceria uptake and toxic response. First we validated that monocytes from the same human subjects show significant cytotoxicity after exposure to similar doses of nanoceria (Figure 7A). We then quantified nanoceria uptake in both cell types by laser scanning confocal microscopy and 3D image analysis. Representative images of monocytes and MDMs are shown in (Figure 7B). Qualitative assessment indicated that nanoceria occupied more cell cytoplasm in monocytes than MDMs. We therefore evaluated cell volume and internalized nanoparticle volume. As shown in Figure 7C, cell size significantly increased as monocytes matured to macrophages. However, internalized nanoparticle volume did not increase at the same pace (Figure 7D), resulting in more “diluted” nanoceria in the cytoplasm of MDMs as compared to monocytes (Figure 7E).
Figure 7. Quantification of nanoceria uptake in monocytes (CD14+ cells) and MDMs.
A) Validation of nanoceria toxicity in CD14+ cells and its comparison with MDMs by flow cytometry using PI as a marker of toxicity. B) LSCM images of nanoceria treated monocytes (CD14+) and MDMs. Cell nuclei are marked with DAPI (blue), particles are green, and cell membranes are marked with Cellmask deep red (red). C) Quantification of cell volume after nanoceria exposure (20µg/mL) for 24 or 48 hours. D) Quantification of nanoparticle volume internalized by cell using 3D image analysis. E) Cell volume corrected uptake of nanoceria by monocytes (CD14+) and MDM after 24 and 48 hours exposure to 20 µg/mL nanoparticles. Data are presented as mean ± standard error of mean and were analyzed by Mann-Whitney U test. *p < 0.05, **p < 0.01, ***p < 0.001
DISCUSSION
In the present study we evaluated nanoceria toxicity in human MDMs and found that MDMs were resistant to nanoceria toxicity. This decreased sensitivity of MDMs was associated with increased levels of mitochondrial protective proteins Mcl-1 and Bcl-2 and lower volume-corrected intracellular dose of nanoceria. To the best of our knowledge, this study is the first study to demonstrate cell-specific factors of cell protection against nanoceria-induced toxicity.
The research on health effects of nanoceria continues to be inconclusive, as various studies present contradictory findings about its biological activity. It has been reported that nanoceria is cytoprotective and reduces exogenously-induced oxidative stress. 21,25 However, other authors observed nanoceria-induced toxicity with or without oxidative stress induction. 14,26–29 An excellent series of expert reviews on the different aspects of nanoceria was recently published. 30–33 Some of the known factors that potentially explain the different biological outcomes after nanoceria exposure include material-related factors such as: method of production (anti-oxidative room temperature synthesis vs. pro-oxidative high temperature synthesis); differential valence state composition (pro-oxidative Ce3+ vs. anti-oxidative Ce4+); shape/aspect ratio (toxic sharp edges and high aspect ratio vs. non-toxic round edges and low aspect ratio); and pH of the internalizing cellular compartment (pro-oxidative at low vesicular pH vs anti-oxidative at neutral cytoplasmic pH). 29,34 Moreover, it has been shown that primary particle size is inversely related to agglomeration tendency of nanoceria. 35 Differential agglomeration leads to disparate uptake and intracellular localization resulting in a variety of biological outcomes. Here we add another dimension of nanoceria toxicity analysis by including cell type-specific differential uptake and level of protective factors. Our findings suggest that sensitivity to nanoceria relies not only on physicochemical characteristics but also on the intracellular concentration of this nanomaterial, ability of exposed cells to deal with the exogenous stress, and on the presence of cellular mechanisms to avoid an injury response (e.g. mitochondrial damage).
Various literature reports describe a direct correlation between the amount of internalized nanomaterials and cytotoxicity. 19,36 However, in the case of MDMs, our studies showed that this internalization-toxicity relationship does not exist, as MDMs did not show a toxic response in spite of efficient nanoceria internalization in a majority of the cells. This indicated that internalization alone cannot explain the decreased sensitivity of MDMs towards nanoceria, and that further quantitative analysis on the uptake was needed to better understand this phenomenon. This led us to evaluate volume-corrected uptake in monocytes and MDMs. Interestingly, we observed higher volume-corrected uptake of nanoceria in monocytes as compared to MDMs, which can at least partly explain the observed higher toxicity in monocytes as compared to MDMs. These observations suggest that in the case of MDMs, due to higher cytoplasmic volume, the internalized nanoparticles may be more “diluted” and thus less toxic.
In this manuscript we demonstrate that cell volume-corrected intracellular NP abundance is a good indicator of adverse outcome after nanoceria exposure. Higher cell volume-corrected nanoceria abundance inside the cytoplasm means higher cytoplasmic concentration of particles, and thus higher local exposure dose to susceptible organelles like mitochondria and lysosomes. Indeed we observed mitochondrial damage only in the monocytes, which had significantly higher corrected abundance of nanoceria inside the cell. As cell toxicity is linked to exposure dose, we now propose that organelle toxicity may be uniquely linked to nanoceria abundance in the cytoplasm, which is after all the milieu in which organelles are bathed. There are several ways through which intracellular concentration of NPs may have a unique association with organelle damage. Higher volume of nanoparticles inside the cell pushes the cytoplasmic contents in a smaller space (partly through vesicle formation), resulting in cytoplasmic strain and higher steric hindrance as well as overcrowding of the cytoplasm. Although cytoplasm is known to act as a colloid, higher stress can change its dynamics. 37,38 Overcrowding of cytoplasm results in increased protein concentration and total protein density, leading to altered biochemical kinetics as well as changes in stress-related signaling. 39 An increased intracytoplasmic abundance of particles may result in higher steric hindrance, which, coupled with cytoplasmic overcrowding and stretching, can impact vesicle as well as receptor and transcription factor traffic and cell signaling. Indeed, overcrowding of cytoplasm can lead to reduced vesicle and transcription factor transport. 39 Moreover, higher particle volume/concentration inside the cytoplasm may bind an increased number of molecules, especially proteins such as enzymes, with potentially deleterious consequences. 40,41
In a previous manuscript we demonstrated that at lower dose (10 µg/mL) of nanoceria induced toxicity in human monocytes. 15 We demonstrated that the mechanism of nanoceria toxicity in human monocytes includes mitochondrial toxicity (loss of mitochondrial membrane potential, activation of Bax activation, and expression of AIF) as well as autophagy. 15 We also demonstrated that this process occurs independent of reactive oxygen species and caspase activation. In this manuscript we confirm the nontoxic nature of nanoceria towards MDMs at even two times higher concentration (20 µg/mL). It is noteworthy that compared to published literature, the relatively lower doses (0–20 µg/mL, 0–5 µg/cm2, 5.8–116 µM) of nanoceria used in this study still fall within the potential environmental and therapeutic exposure levels, given that nanoceria has a very slow clearance rate (months to years). 9,21,42–45
As mitochondrial damage is the main mechanism of nanoceria-induced cell injury, we evaluated mitochondrial protection in MDMs. Mitochondrial membrane potential is a well-established indicator of mitochondrial injury. We did not observe loss of mitochondrial membrane potential after nanoceria exposure in MDMs, indicating absence of mitochondrial toxicity. We measured expression levels of Mcl-1 and Bcl-2, which are important apoptosis-inhibiting members of the B-cell lymphoma 2 (Bcl-2) family. We observed a significant increase in Mcl-1 and Bcl-2 levels during the maturation process of monocytes into MDMs. This observation is in agreement with published literature demonstrating significant increases in Mcl-1 levels in MDMs due to activation of survival pathways during monocyte differentiation. 46 Moreover, Mcl-1 overexpression has been noted in tissue macrophages. 47 These findings, coupled with existing literature reports of a significantly higher number of mitochondria per cell in MDMs compared to monocytes, potentially explain the lower levels of mitochondrial injury after nanoceria exposure in MDMs. 48
In conclusion, a higher intracellular volume-corrected dose, coupled with higher abundance of protective factors against mitochondrial injury, resulted in lower sensitivity of MDMs to the deleterious effects of nanoceria. These results have significant implications for the prediction of cell response after in vivo nanoceria exposure. Our findings indicate that resident macrophages are better equipped to deal with nanoceria exposure than circulating monocytes. Our results also suggest possible mechanisms (e.g. mitochondrial protection) that may ameliorate nanoceria-induced toxicity in susceptible tissues. Further research is currently underway in our laboratory to understand the impact of nanoceria exposure on immune response initiation and propagation by human blood mononuclear cells.
Acknowledgments
This work was supported (in part) by the Intramural Research Program of the NIH, National Institute of Environmental Health Sciences (NIEHS). A portion of this work was supported by the National Science Foundation (NSF) and the Environmental Protection Agency (EPA) under NSF Cooperative Agreement EF-0830093 and DBI-1266252, Center for the Environmental Implications of NanoTechnology (CEINT). We wish to gratefully acknowledge Carl Bortner, Maria Sifre, Kevin Katen, Connie Cummings and Deloris Sutton for technical assistance and the contribution of the Clinical Research Unit staff in the recruitment of human subjects for this study. Any opinions, findings, conclusions or recommendations expressed in this material are those of the author(s) and do not necessarily reflect the views of the NSF or the EPA. This work has not been subjected to EPA review and no official endorsement should be inferred.
Footnotes
Conflict of Interest: The authors declare no competing financial interest.
REFERENCES
- 1.Lawrence NJ, Brewer JR, Wang L, Wu TS, Wells-Kingsbury J, Ihrig MM, Wang G, Soo YL, Mei WN, Cheung CL. Defect Engineering in Cubic Cerium Oxide Nanostructures for Catalytic Oxidation. Nano Lett. 2011;11:2666–2671. doi: 10.1021/nl200722z. [DOI] [PubMed] [Google Scholar]
- 2.Heckert EG, Karakoti AS, Seal S, Self WT. The Role of Cerium Redox State in the Sod Mimetic Activity of Nanoceria. Biomaterials. 2008;29:2705–2709. doi: 10.1016/j.biomaterials.2008.03.014. [DOI] [PMC free article] [PubMed] [Google Scholar]
- 3.Cargnello M, Doan-Nguyen VV, Gordon TR, Diaz RE, Stach EA, Gorte RJ, Fornasiero P, Murray CB. Control of Metal Nanocrystal Size Reveals Metal-Support Interface Role for Ceria Catalysts. Science. 2013;341:771–773. doi: 10.1126/science.1240148. [DOI] [PubMed] [Google Scholar]
- 4.Park B, Donaldson K, Duffin R, Tran L, Kelly F, Mudway I, Morin JP, Guest R, Jenkinson P, Samaras Z, Giannouli M, Kouridis H, Martin P. Hazard and Risk Assessment of a Nanoparticulate Cerium Oxide-Based Diesel Fuel Additive - a Case Study. Inhal Toxicol. 2008;20:547–566. doi: 10.1080/08958370801915309. [DOI] [PubMed] [Google Scholar]
- 5.Cassee FR, van Balen EC, Singh C, Green D, Muijser H, Weinstein J, Dreher Exposure K. Health and Ecological Effects Review of Engineered Nanoscale Cerium and Cerium Oxide Associated with Its Use as a Fuel Additive. Crit Rev Toxicol. 2011;41:213–229. doi: 10.3109/10408444.2010.529105. [DOI] [PubMed] [Google Scholar]
- 6.Das M, Patil S, Bhargava N, Kang JF, Riedel LM, Seal S, Hickman JJ. Auto-Catalytic Ceria Nanoparticles Offer Neuroprotection to Adult Rat Spinal Cord Neurons. Biomaterials. 2007;28:1918–1925. doi: 10.1016/j.biomaterials.2006.11.036. [DOI] [PMC free article] [PubMed] [Google Scholar]
- 7.Tarnuzzer RW, Colon J, Patil S, Seal S. Vacancy Engineered Ceria Nanostructures for Protection from Radiation-Induced Cellular Damage. Nano Lett. 2005;5:2573–2577. doi: 10.1021/nl052024f. [DOI] [PubMed] [Google Scholar]
- 8.Niu J, Azfer A, Rogers LM, Wang X, Kolattukudy PE. Cardioprotective Effects of Cerium Oxide Nanoparticles in a Transgenic Murine Model of Cardiomyopathy. Cardiovasc Res. 2007;73:549–559. doi: 10.1016/j.cardiores.2006.11.031. [DOI] [PMC free article] [PubMed] [Google Scholar]
- 9.Demokritou P, Gass S, Pyrgiotakis G, Cohen JM, Goldsmith W, McKinney W, Frazer D, Ma J, Schwegler-Berry D, Brain J, Castranova V. An in Vivo and in Vitro Toxicological Characterisation of Realistic Nanoscale Ceo(2) Inhalation Exposures. Nanotoxicology. 2013;7:1338–1350. doi: 10.3109/17435390.2012.739665. [DOI] [PMC free article] [PubMed] [Google Scholar]
- 10.O. f. E. C.-o. a. Development. List of Manufactured Nanomaterials and List of End Points for Phase One of the Oecd Testing Programme. 2008 [Google Scholar]
- 11.Parihar A, Eubank TD, Doseff AI. Monocytes and Macrophages Regulate Immunity through Dynamic Networks of Survival and Cell Death. J Innate Immun. 2010;2:204–215. doi: 10.1159/000296507. [DOI] [PMC free article] [PubMed] [Google Scholar]
- 12.Gordon S, Taylor PR. Monocyte and Macrophage Heterogeneity. Nat Rev Immunol. 2005;5:953–964. doi: 10.1038/nri1733. [DOI] [PubMed] [Google Scholar]
- 13.Hussain S, Vanoirbeek JA, Hoet PH. Interactions of Nanomaterials with the Immune System. Wiley Interdiscip Rev Nanomed Nanobiotechnol. 2012;4:169–183. doi: 10.1002/wnan.166. [DOI] [PubMed] [Google Scholar]
- 14.Hussain S, Al-Nsour F, Rice AB, Marshburn J, Ji Z, Zink JI, Yingling B, Walker NJ, Garantziotis S. Cerium Dioxide Nanoparticles Do Not Modulate the Lipopolysaccharide-Induced Inflammatory Response in Human Monocytes. Int J Nanomedicine. 2012;7:1387–1397. doi: 10.2147/IJN.S29429. [DOI] [PMC free article] [PubMed] [Google Scholar]
- 15.Hussain S, Al-Nsour F, Rice AB, Marshburn J, Yingling B, Ji Z, Zink JI, Walker NJ, Garantziotis S. Cerium Dioxide Nanoparticles Induce Apoptosis and Autophagy in Human Peripheral Blood Monocytes. ACS Nano. 2012;6:5820–5829. doi: 10.1021/nn302235u. [DOI] [PMC free article] [PubMed] [Google Scholar]
- 16.Hussain S, Sangtian S, Anderson SM, Snyder RJ, Marshburn JD, Rice AB, Bonner JC, Garantziotis S. Inflammasome Activation in Airway Epithelial Cells after Multi-Walled Carbon Nanotube Exposure Mediates a Profibrotic Response in Lung Fibroblasts. Part Fibre Toxicol. 2014;11:28. doi: 10.1186/1743-8977-11-28. [DOI] [PMC free article] [PubMed] [Google Scholar]
- 17.Taylor AJ, McClure CD, Shipkowski KA, Thompson EA, Hussain S, Garantziotis S, Parsons GN, Bonner JC. Atomic Layer Deposition Coating of Carbon Nanotubes with Aluminum Oxide Alters Pro-Fibrogenic Cytokine Expression by Human Mononuclear Phagocytes in Vitro and Reduces Lung Fibrosis in Mice in Vivo. PLoS One. 2014;9:e106870. doi: 10.1371/journal.pone.0106870. [DOI] [PMC free article] [PubMed] [Google Scholar]
- 18.Gliga AR, Skoglund S, Wallinder IO, Fadeel B, Karlsson HL. Size-Dependent Cytotoxicity of Silver Nanoparticles in Human Lung Cells: The Role of Cellular Uptake, Agglomeration and Ag Release. Part Fibre Toxicol. 2014;11:11. doi: 10.1186/1743-8977-11-11. [DOI] [PMC free article] [PubMed] [Google Scholar]
- 19.Hussain S, Boland S, Baeza-Squiban A, Hamel R, Thomassen LC, Martens JA, Billon-Galland MA, Fleury-Feith J, Moisan F, Pairon JC, Marano F. Oxidative Stress and Proinflammatory Effects of Carbon Black and Titanium Dioxide Nanoparticles: Role of Particle Surface Area and Internalized Amount. Toxicology. 2009;260:142–149. doi: 10.1016/j.tox.2009.04.001. [DOI] [PubMed] [Google Scholar]
- 20.Hussain S, Thomassen LC, Ferecatu I, Borot MC, Andreau K, Martens JA, Fleury J, Baeza-Squiban A, Marano F, Boland S. Carbon Black and Titanium Dioxide Nanoparticles Elicit Distinct Apoptotic Pathways in Bronchial Epithelial Cells. Part Fibre Toxicol. 2010;7:10. doi: 10.1186/1743-8977-7-10. [DOI] [PMC free article] [PubMed] [Google Scholar]
- 21.Xia T, Kovochich M, Liong M, Madler L, Gilbert B, Shi H, Yeh JI, Zink JI, Nel AE. Comparison of the Mechanism of Toxicity of Zinc Oxide and Cerium Oxide Nanoparticles Based on Dissolution and Oxidative Stress Properties. ACS Nano. 2008;2:2121–2134. doi: 10.1021/nn800511k. [DOI] [PMC free article] [PubMed] [Google Scholar]
- 22.Fadok VA, Bratton DL, Konowal A, Freed PW, Westcott JY, Henson PM. Macrophages That Have Ingested Apoptotic Cells in Vitro Inhibit Proinflammatory Cytokine Production through Autocrine/Paracrine Mechanisms Involving Tgf-Beta, Pge2, and Paf. J Clin Invest. 1998;101:890–898. doi: 10.1172/JCI1112. [DOI] [PMC free article] [PubMed] [Google Scholar]
- 23.Han X, Gelein R, Corson N, Wade-Mercer P, Jiang J, Biswas P, Finkelstein JN, Elder A, Oberdorster G. Validation of an Ldh Assay for Assessing Nanoparticle Toxicity. Toxicology. 2011;287:99–104. doi: 10.1016/j.tox.2011.06.011. [DOI] [PMC free article] [PubMed] [Google Scholar]
- 24.Bolte S, Cordelieres FP. A Guided Tour into Subcellular Colocalization Analysis in Light Microscopy. J Microsc. 2006;224:213–232. doi: 10.1111/j.1365-2818.2006.01706.x. [DOI] [PubMed] [Google Scholar]
- 25.Clark A, Zhu A, Sun K, Petty HR. Cerium Oxide and Platinum Nanoparticles Protect Cells from Oxidant-Mediated Apoptosis. J Nanopart Res. 2011;13:5547–5555. doi: 10.1007/s11051-011-0544-3. [DOI] [PMC free article] [PubMed] [Google Scholar]
- 26.Lin W, Huang YW, Zhou XD, Ma Y. Toxicity of Cerium Oxide Nanoparticles in Human Lung Cancer Cells. Int J Toxicol. 2006;25:451–457. doi: 10.1080/10915810600959543. [DOI] [PubMed] [Google Scholar]
- 27.Alili L, Sack M, Karakoti AS, Teuber S, Puschmann K, Hirst SM, Reilly CM, Zanger K, Stahl W, Das S, Seal S, Brenneisen P. Combined Cytotoxic and Anti-Invasive Properties of Redox-Active Nanoparticles in Tumor-Stroma Interactions. Biomaterials. 2011;32:2918–2929. doi: 10.1016/j.biomaterials.2010.12.056. [DOI] [PubMed] [Google Scholar]
- 28.Benameur L, Auffan M, Cassien M, Liu W, Culcasi M, Rahmouni H, Stocker P, Tassistro V, Bottero JY, Rose J, Botta A, Pietri S. DNA Damage and Oxidative Stress Induced by Ceo2 Nanoparticles in Human Dermal Fibroblasts: Evidence of a Clastogenic Effect as a Mechanism of Genotoxicity. Nanotoxicology. 2015;9:696–705. doi: 10.3109/17435390.2014.968889. [DOI] [PubMed] [Google Scholar]
- 29.Karakoti AS, Munusamy P, Hostetler K, Kodali V, Kuchibhatla S, Orr G, Pounds JG, Teeguarden JG, Thrall BD, Baer DR. Preparation and Characterization Challenges to Understanding Environmental and Biological Impacts of Nanoparticles. Surf Interface Anal. 2012;44:882–889. doi: 10.1002/sia.5006. [DOI] [PMC free article] [PubMed] [Google Scholar]
- 30.Yokel RA, Hussain S, Garantziotis S, Demokritou P, Castranova V, Cassee FR. The Yin: An Adverse Health Perspective of Nanoceria: Uptake, Distribution, Accumulation, and Mechanisms of Its Toxicity. Environ Sci Nano. 2014;1:406–428. doi: 10.1039/C4EN00039K. [DOI] [PMC free article] [PubMed] [Google Scholar]
- 31.Kumar A, Das S, Munusamy P, Self W, Baer DR, Sayle DC, Seal S. Behavior of Nanoceria in Biologically-Relevant Environments. Environmental Science-Nano. 2014;1:516–532. [Google Scholar]
- 32.Grulke E, Reed K, Beck M, Huang X, Cormack A, Seal S. Nanoceria: Factors Affecting Its Pro- and Anti-Oxidant Properties. Environmental Science-Nano. 2014;1:429–444. [Google Scholar]
- 33.Walkey C, Das S, Seal S, Erlichman J, Heckman K, Ghibelli L, Traversa E, McGinnis JF, Self WT. Catalytic Properties and Biomedical Applications of Cerium Oxide Nanoparticles. Environ Sci Nano. 2015;2:33–53. doi: 10.1039/C4EN00138A. [DOI] [PMC free article] [PubMed] [Google Scholar]
- 34.Lin S, Wang X, Ji Z, Chang CH, Dong Y, Meng H, Liao YP, Wang M, Song TB, Kohan S, Xia T, Zink JI, Lin S, Nel AE. Aspect Ratio Plays a Role in the Hazard Potential of Ceo2 Nanoparticles in Mouse Lung and Zebrafish Gastrointestinal Tract. ACS Nano. 2014;8:4450–4464. doi: 10.1021/nn5012754. [DOI] [PMC free article] [PubMed] [Google Scholar]
- 35.Pyrgiotakis G, Blattmann CO, Pratsinis S, Demokritou P. Nanoparticle-Nanoparticle Interactions in Biological Media by Atomic Force Microscopy. Langmuir. 2013;29:11385–11395. doi: 10.1021/la4019585. [DOI] [PMC free article] [PubMed] [Google Scholar]
- 36.Vranic S, Boggetto N, Contremoulins V, Mornet S, Reinhardt N, Marano F, Baeza-Squiban A, Boland S. Deciphering the Mechanisms of Cellular Uptake of Engineered Nanoparticles by Accurate Evaluation of Internalization Using Imaging Flow Cytometry. Part Fibre Toxicol. 2013;10:2. doi: 10.1186/1743-8977-10-2. [DOI] [PMC free article] [PubMed] [Google Scholar]
- 37.Luby-Phelps K. Cytoarchitecture and Physical Properties of Cytoplasm: Volume, Viscosity, Diffusion, Intracellular Surface Area. Int Rev Cytol. 2000;192:189–221. doi: 10.1016/s0074-7696(08)60527-6. [DOI] [PubMed] [Google Scholar]
- 38.Luby-Phelps K. The Physical Chemistry of Cytoplasm and Its Influence on Cell Function: An Update. Mol Biol Cell. 2013;24:2593–2596. doi: 10.1091/mbc.E12-08-0617. [DOI] [PMC free article] [PubMed] [Google Scholar]
- 39.Miermont A, Waharte F, Hu S, McClean MN, Bottani S, Leon S, Hersen P. Severe Osmotic Compression Triggers a Slowdown of Intracellular Signaling, Which Can Be Explained by Molecular Crowding. Proc Natl Acad Sci U S A. 2013;110:5725–5730. doi: 10.1073/pnas.1215367110. [DOI] [PMC free article] [PubMed] [Google Scholar]
- 40.Sanfins E, Dairou J, Hussain S, Busi F, Chaffotte AF, Rodrigues-Lima F, Dupret JM. Carbon Black Nanoparticles Impair Acetylation of Aromatic Amine Carcinogens through Inactivation of Arylamine N-Acetyltransferase Enzymes. ACS Nano. 2011;5:4504–4511. doi: 10.1021/nn103534d. [DOI] [PubMed] [Google Scholar]
- 41.Zhang B, Xing Y, Li Z, Zhou H, Mu Q, Yan B. Functionalized Carbon Nanotubes Specifically Bind to Alpha-Chymotrypsin’s Catalytic Site and Regulate Its Enzymatic Function. Nano Lett. 2009;9:2280–2284. doi: 10.1021/nl900437n. [DOI] [PMC free article] [PubMed] [Google Scholar]
- 42.Pairon JC, Roos F, Iwatsubo Y, Janson X, Billon-Galland MA, Bignon J, Brochard P. Lung Retention of Cerium in Humans. Occup Environ Med. 1994;51:195–199. doi: 10.1136/oem.51.3.195. [DOI] [PMC free article] [PubMed] [Google Scholar]
- 43.Park EJ, Choi J, Park YK, Park K. Oxidative Stress Induced by Cerium Oxide Nanoparticles in Cultured Beas-2b Cells. Toxicology. 2008;245:90–100. doi: 10.1016/j.tox.2007.12.022. [DOI] [PubMed] [Google Scholar]
- 44.Celardo I, De Nicola M, Mandoli C, Pedersen JZ, Traversa E, Ghibelli L. Ce(3)+ Ions Determine Redox-Dependent Anti-Apoptotic Effect of Cerium Oxide Nanoparticles. ACS Nano. 2011;5:4537–4549. doi: 10.1021/nn200126a. [DOI] [PubMed] [Google Scholar]
- 45.De Marzi L, Monaco A, De Lapuente J, Ramos D, Borras M, Di Gioacchino M, Santucci S, Poma A. Cytotoxicity and Genotoxicity of Ceria Nanoparticles on Different Cell Lines in Vitro. Int J Mol Sci. 2013;14:3065–3077. doi: 10.3390/ijms14023065. [DOI] [PMC free article] [PubMed] [Google Scholar]
- 46.Gonzalez-Mejia ME, Doseff AI. Regulation of Monocytes and Macrophages Cell Fate. Front Biosci (Landmark Ed) 2009;14:2413–2431. doi: 10.2741/3387. [DOI] [PubMed] [Google Scholar]
- 47.Liu H, Ma Y, Cole SM, Zander C, Chen KH, Karras J, Pope RM. Serine Phosphorylation of Stat3 Is Essential for Mcl-1 Expression and Macrophage Survival. Blood. 2003;102:344–352. doi: 10.1182/blood-2002-11-3396. [DOI] [PubMed] [Google Scholar]
- 48.Daigneault M, Preston JA, Marriott HM, Whyte MK, Dockrell DH. The Identification of Markers of Macrophage Differentiation in Pma-Stimulated Thp-1 Cells and Monocyte-Derived Macrophages. PLoS One. 2010;5:e8668. doi: 10.1371/journal.pone.0008668. [DOI] [PMC free article] [PubMed] [Google Scholar]


