

Summary
CD43 is one of the most abundant co‐stimulatory molecules on a T‐cell surface; it transduces activation signals through its cytoplasmic domain, contributing to modulation of the outcome of T‐cell responses. The aim of this study was to uncover new signalling pathways regulated by this sialomucin. Analysis of changes in protein abundance allowed us to identify pyruvate kinase isozyme M2 (PKM2), an enzyme of the glycolytic pathway, as an element potentially participating in the signalling cascade resulting from the engagement of CD43 and the T‐cell receptor (TCR). We found that the glycolytic activity of this enzyme was not significantly increased in response to TCR+CD43 co‐stimulation, but that PKM2 was tyrosine phosphorylated, suggesting that it was performing moonlight functions. We report that phosphorylation of both Y105 of PKM2 and of Y705 of signal transducer and activator of transcription 3 was induced in response to TCR+CD43 co‐stimulation, resulting in activation of the mitogen‐activated protein kinase kinase 5/extracellular signal‐regulated kinase 5 (MEK5/ERK5) pathway. ERK5 and the cAMP response element binding protein (CREB) were activated, and c‐Myc and nuclear factor‐κB (p65) nuclear localization, as well as Bad phosphorylation, were augmented. Consistent with this, expression of human CD43 in a murine T‐cell hybridoma favoured cell survival. Altogether, our data highlight novel signalling pathways for the CD43 molecule in T lymphocytes, and underscore a role for CD43 in promoting cell survival through non‐glycolytic functions of metabolic enzymes.
Keywords: CD43, cAMP response element binding protein signalling, extracellular signal‐regulated kinase 5, pyruvate kinase isoform M2, T‐cell survival
Abbreviations
- CREB
cAMP response element binding protein
- ERK
extracellular signal‐regulated kinase
- MEK5
mitogen‐activated protein kinase kinase 5
- NF‐κB
nuclear factor‐κB
- PEP
phosphoenolpyruvate
- PK
pyruvate kinase
- PKA
protein kinase A
- PKC
protein kinase C
- PKM2
pyruvate kinase isoform M2
- STAT3
signal transducer and activator of transcription 3
- TCR
T‐cell receptor
Introduction
The outcome of T‐cell responses is determined by the sum of positive and negative signalling events. Lymphocyte activation is considered to follow a two‐signal model where both the antigen and co‐stimulatory signals are required to induce full T‐cell activation. Stimulation through the T‐cell receptor (TCR) defines the specificity to a particular antigen; however, this alone does not fully initiate cell activation responses such as proliferation and cytokine release. Instead, stimulation through the TCR without additional signals provided by co‐stimulatory molecules leads to an unresponsive state, where negative feedback signalling loops are induced. When they encounter their cognate ligands on antigen‐presenting cells, co‐stimulatory molecules initiate diverse signalling pathways that, once integrated, modulate TCR signalling, shaping the activation status of a cell.1, 2 Along with this complex decision‐making process, activated T cells have unique metabolic demands differentially regulated by signals generated through cytokine, antigen and co‐stimulatory receptors.3 As activation induces cell growth, proliferation and differentiation, the metabolic requirements of T cells augment considerably. To fulfil these requirements, signals provided by co‐stimulatory receptors such as CD28 have been shown to lead to higher glucose uptake and glycolytic activity, as well as to the up‐regulation of molecules involved in nutrient uptake,4, 5 underscoring an important role for co‐stimulatory molecules in coordinating T‐cell activation and cell metabolism.4
CD43 is one of the most abundant molecules on the T‐cell surface.6, 7, 8, 9, 10 The expression of wild‐type human CD43, but not that of a mutant form that lacks the intracellular domain, has been shown to enhance the antigen‐specific response of a murine T‐cell hybridoma specific for HLA‐DR antigens.9 The phosphorylation of S76 of the cytoplasmic domain of CD43 is necessary for T‐cell trafficking,11 further demonstrating that CD43 requires its highly conserved cytoplasmic tail to perform its co‐receptor molecule functions. Moreover, data from CD43 knockout mice suggest that it participates in naive T‐cell migration to inflammatory sites.12, 13
A role for this molecule in the regulation of cell number and homeostasis has also been suggested.14, 15, 16 CD43 has been reported to control cell cycle entry and cell migration in lymphoid cells as well as in lymphoid and non‐lymphoid tumours.17, 18, 19, 20 In T lymphocytes, CD43 ligation results in the association of Src family kinases to the proline‐rich region of its cytoplasmic domain,21 leading to CD3 ζ‐chain phosphorylation22 and to the formation of macromolecular complexes that comprise Shc, Grb2, SLP‐76 and Vav.23 CD43 signals also promote extracellular signal‐regulated kinase 1/2 (ERK 1/2) activation, leading to actin cytoskeleton reorganization24 and to the activation of a positive feedback loop on Lck signalling25 triggered by the inhibition of SHP‐1 recruitment.26 Cross‐linking CD43 also induces diacylglycerol and inositol phosphate generation, along with calcium mobilization and protein kinase C (PKC) activation.11, 27, 28 Collectively, CD43‐mediated signals result in activation of activator protein‐1 (AP‐1), nuclear factor‐κB (NF‐κB) and nuclear factor of activated T cells (NFAT),28, 29, 30 coordinating the expression of multiple cytokine genes.25, 30
Searching for new signalling pathways and novel functions regulated by CD43, we performed a quantitative proteomic analysis to detect changes in protein abundance patterns upon co‐stimulation of normal human CD4+ T lymphocytes through the TCR+CD43. Interestingly, differences in the expression profile of pyruvate kinase (PK) were detected; yet, PK glycolytic activity was not significantly augmented in response to TCR+CD43 co‐stimulatory signals. In contrast, we found that CD43 signals favoured the protein kinase function of pyruvate kinase isoform M2 (PKM2). Two isoforms of PKM2 have been described: a tetramer that is an active glycolytic enzyme, catalysing the conversion of phosphoenolpyruvate (PEP) to pyruvate by transferring a phosphate from PEP to ADP, and a dimer that functions both as protein kinase and as a transcriptional co‐activator upon post‐translational modification.31 Particularly, phosphorylation of Y105 of the PKM2 isoform triggers its ability to phosphorylate signal transducer and activator of transcription 3 (STAT3). In agreement with this, phosphorylation of PKM2 Y105 and that of STAT3 Y705 were augmented in response to TCR+CD43 co‐stimulation. Moreover, CD43 signals contributed to the activation of the ERK5 pathway, a STAT3‐regulated pathway,32, 33 as shown by increased phosphorylation of the ERK5 downstream targets cAMP response element binding protein (CREB) and Bad, the up‐regulation of c‐Myc and cyclin D1 expression, and the activation of the NF‐κB pathway. In addition to the ERK5 pathway, activation of the protein kinase A (PKA) /adenylate cyclase (AC) pathway led to CREB activation following TCR+CD43 engagement. Overall, our results identified a new signalling pathway for CD43 through the regulation of alternative functions of PKM2, favouring cell survival following activation.
Materials and methods
Antibodies and reagents
Ficoll (Lymphoprep) for blood mononuclear cell isolation was obtained from Axis‐Shield PoC AS (Alere Technologies AS, Oslo, Norway). The Human Pan T Cell Isolation Kit was from Miltenyi Biotech (Bergisch Gladbach, Germany). The goat anti‐mouse IgG magnetic particles used for T‐cell purification were from Polysciences, Inc. (Warminster, PA). RPMI (HyClone GE Healthcare Life Sciences, Logan, UT) or Advanced RPMI (A‐RPMI) (Gibco/Life Technologies, Carlsbad, CA, USA) medium were supplemented with the indicated amount of fetal bovine serum (Gibco/Life Technologies), 50 U/ml penicillin (Sigma, St Louis, MO, USA), 50 μg/ml streptomycin (Sigma), 2 mm glutamine (Gibco/Life Technologies) and 50 μm β‐mercaptoethanol (Sigma) (A‐RPMI). Anti‐human CD3 (OKT3), anti‐mouse CD3 (F23.1), anti‐human CD8 (OKT8) and anti‐c‐Myc (9‐E10) antibodies were home purified. Anti‐CD43 (L10) was home purified or from Caltag (Burlingam, CA, MK) and anti‐CD28 (CD28·2) was from Biolegend (San Diego, CA, USA). Anti‐pERK1/2, anti‐pERK5 (T218/Y220), anti‐p‐Akt1, anti‐Sp1, anti‐cyclin D1, anti‐p65, anti‐NF‐κB, and anti‐ERK2 primary antibodies were purchased from Santa Cruz Biotechnology (Santa Cruz, CA, USA); anti‐pSTAT3 (Y705), anti‐pCREB (S133), anti‐pPKM2 (Y105), anti‐PKM2, anti‐pBad (S112), and anti‐phospho (Ser/Thr) PKA substrates antibodies were from Cell Signaling Technology (Danvers, MA, USA), anti‐tubulin antibody was from GeneTex, and anti‐histone 3 antibody was from Upstate Biotechnology (Lake Placid, NY, USA). The anti‐rabbit biotinylated antibody was purchased from SouthernBiotech (Birmingham, AL, USA) and the phycoerythrin‐labelled streptavidin was from Molecular Probes (Eugene, OR, USA). The horseradish peroxidase‐coupled secondary antibodies were from Santa Cruz Biotechnology. The Cell Proliferation Dye eFluor 670 was from eBioscience (San Diego, CA, USA). The kinase inhibitor XMD8‐92 was from Santa Cruz Biotechnology, and the inhibitors PD98059, H89, Gö6976 and LY294004 were obtained from Calbiochem (Spring Valley, CA, USA). The Src family kinases inhibitor PP2 was from Cayman Laboratories (Ann Arbor, MI, USA).
Cells
Human T cells were isolated from the peripheral blood of healthy donors. Leucocyte concentrates were provided by the ‘Banco de Sangre del Hospital Regional del IMSS’ and the ‘Centro Regional para la Transfusión Sanguínea’ in Cuernavaca, Morelos, Mexico. Institutional committees approved the acquisition and isolation of human peripheral blood leucocytes. Peripheral blood mononuclear cells were first isolated by Ficoll gradient centrifugation. T cells were then purified with a Human Pan T‐Cell Isolation Kit, as instructed by the manufacturer. Finally, CD4+ T cells were enriched by negative selection by incubating the cells with anti‐CD8 antibody (OKT8), followed by incubation with goat anti‐mouse IgG‐bound magnetic particles. The purity of CD4+ T cells was > 90%, as determined by FACS staining. Before stimulation, cells were arrested overnight in RPMI‐1640 medium supplemented with 2% fetal bovine serum. Jurkat and the Lck‐deficient Jurkat cells (JCAM‐1),34 (see Supplementary material, Fig. S1) were cultured in A‐RPMI medium supplemented with 5% fetal bovine serum (5K), and arrested in serum‐free RPMI‐1640 for 36 hr before stimulation. Stable transfectants of the murine T‐cell hybridoma BY155.16 expressing wild‐type human CD43 (CD43 WT), a mutant lacking the intracellular domain of CD43 (CD43 ΔIC),9 or human CD4,35 and control cells (pFneo)9 were cultured in A‐RPMI 5K.
Cell activation
CD4+ T lymphocytes (15 × 106), Jurkat, or JCAM‐1 cells (5 × 10⁶) were stimulated in 1 ml of serum‐free RPMI‐1640 with 2 μg/ml each, of anti‐CD3 (OKT3), and/or anti‐CD43 (L10), or 1 μg/ml of anti‐CD28 (CD28.2) antibodies for 3 min at room temperature, following which primary antibodies were cross‐linked with isotype‐specific secondary antibodies (anti‐IgG1 for L10 and CD28, and anti‐IgG2a for OKT3), and incubated at 37°, 5% CO2 for the indicated times. At the end of stimulation, cells were spun down at 400 g to remove excess antibodies and pellets were stored at −70° for further analysis. When indicated, before stimulation, cells were pre‐incubated for 30 min with the following inhibitors: MEK inhibitor PD98059 (8·3 μm), ERK5 inhibitor XMD8‐92 (5 μm); PKA inhibitor H89 (9 μm), PKC inhibitor Gö6976 (4 nm), p38 inhibitor SB203580 (0·83 μm), phosphoinositide 3‐kinase (PI‐3K) inhibitor LY294004 (10 or 40 μm), or Src inhibitor PP2 (10 μm).
Pyruvate kinase glycolytic activity
T lymphocytes stimulated for 48 hr as described under ‘Cell activation’, were lysed in 25 mm HEPES pH 7·5, 0·5% Triton X‐100, 1·5 mm MgCl2, 150 mm NaCl, 0·2 mm EDTA, with 1 mm PMSF, 10 mm β‐glycerophosphate, 10 mm NaF, 200 μm NaVO4, 1 μg/ml leupeptin, 50 μg/ml antipain, 10 μg/ml aprotinin, 0·5 mm DTT. Lysates were spun down at 18 000 g for 15 min at 4° and supernatants were stored at −70°. Pyruvate kinase activity was measured on total lysates according to the coupled method.36 Briefly, 50 μg of cell lysate protein was incubated in a total volume of 1 ml with reaction buffer [50 mm Tris–HCl pH 7·4, 225 mm KCl, 12 mm MgCl2, 0·6 mm ADP, 4·3 mm PEP, 0·6 mm NADH, and 4 IU L‐Lactate dehydrogenase]. The initial rate of NADH utilization was monitored at 340 nm using a Hewlett Packard 8452A Diode‐array spectrophotometer (Hewlett Packard, Palo Alto, CA).
Immunoblot
Pyruvate kinase protein abundance was validated on cells stimulated and lysed as described under ‘Pyruvate kinase glycolytic activity’. One hundred microgrammes of protein were desalted/cleaned with the ReadyPrep 2D Cleanup kit (BioRad, Hercules, CA, USA). The protein pellet was resuspended in rehydration buffer [7 m urea, 2 m thiourea, 5% 3‐[(3‐cholamidopropyl)dimethylammonio]‐1‐propanesulphonate hydrate (CHAPS), 2% Bio‐Lyte ampholytes 3/10]. Ready Strip IPG strips (7 cm, linear pH 3–10, BioRad) were layered gel side down onto samples, covered with 1 ml of mineral oil, and active rehydration was performed for 16 hr in a protean IEF Cell (BioRad). Isoelectric focusing was performed with a three‐step ramping protocol for a total of 30 000 V‐hr at 20° and a maximum current setting of 50 mA per strip. Strips were then equilibrated for 15 min in DTT equilibration buffer (6 m urea, 0·375 m Tris–HCl, pH 8·8, 2% SDS, 20% glycerol and 2% DTT), followed by a 15 min incubation in iodoacetamide equilibration buffer (6 m urea, 0·375 Tris–HCl, pH 8·8, 2% SDS, 20% glycerol and 2·5% iodoacetamide). Finally, IEF gel strips were loaded onto 10% acrylamide gels for SDS–PAGE, at 50 V for 4 hr at 4°. SDS–PAGE‐separated proteins were transferred onto nitrocellulose membranes as previously described.37 Following transfer, membranes were blocked with TBS (100 mm Tris–HCl, 150 mm NaCl pH 7·5) containing 0·02% (w/v) NaN3 and 5% (w/v) fat‐free milk powder for 2 hr at room temperature. Blocked membranes were incubated overnight at 4° with the appropriate primary antibodies, followed by the addition of a 1 : 5000 dilution of secondary antibodies (goat anti‐rabbit) conjugated to horseradish peroxidase. Immunodetection was carried out using the chemiluminescent ECL Western blotting analysis system (GE Healthcare, Pittsburgh, PA, USA). Mean intensity of the immunodetected protein bands was calculated as a relative calibrated measurement of the total band size and intensity using ECL molecular weight markers as loading control standards (Fermentas/ThermoFisher Scientific, Waltham, MA, USA).
Cytosolic and nuclear extracts were prepared as described previously.38 Lysates were resolved by SDS–PAGE and proteins were transferred onto 0·22‐μm nitrocellulose membranes (Whatman/GE Healthcare). Membranes were blocked with 3% BSA in TBS‐T buffer (20 mm Tris–HCl, 0·15 m NaCl, pH 7·5, pH 7·5, 0·05% Tween‐20). Primary antibodies were diluted in 3% BSA and horseradish peroxidase‐coupled secondary antibodies were diluted in 5% low‐fat milk in TBS‐T buffer. Proteins were visualized with Western Lighting Plus‐ECL substrate (Perkin Elmer, Waltham, MA, USA) according to the manufacturer's instructions.
Densitometric analysis was performed with the help of a Molecular Imager Gel Doc™XR+ Imaging System (Bio‐Rad) and the image lab software (BioRad, Version 5·2·1).
Phosphoflow
CD4+ T lymphocytes (3 × 10⁶) were stimulated as described under ‘Cell activation’ for 3 hr. Paraformaldehyde was immediately added directly to the cells to a final concentration of 1·5%; cells were then vortexed, incubated for 10 min at room temperature, and pelleted by centrifugation at 400 g for 5 min at 4°. The supernatant was decanted and cells, resuspended in the residual volume, were permeabilized by adding 500 μl of cold 100% methanol and stored overnight at −70°. Cells were then labelled (barcoded, so that the identity of each sample is recognized on the flow cytometer on the basis of fluorescence) with serial dilutions of the cell proliferation dye eFluor 670 (eBioscience) and pooled together before antibody staining.39 Briefly, cells in methanol were labelled with 20 μl of serial dilutions of the dye eFluor 670 (1, 0·5, 0·25, 0·125, 0·0625, or 0·03125 μm), vortexed and further diluted with 500 μl of ice‐cold PBS. Following a 10 min incubation at 37° in the dark, excess dye was washed out by adding 3 ml of staining medium twice (PBS, 0·01% NaN3, 2% fetal bovine serum) and centrifuging for 5 min at 400 g at 4° each time. Barcoded samples were resuspended in 250 μl of staining media and pooled by transferring 200 μl from each tube into an empty FACS tube, and washed once more with staining media before the addition of anti‐pCREB and secondary biotinylated anti‐rabbit antibodies. Pooled cells were incubated with primary and secondary antibodies for 1 hr; excess antibody was removed and phycoerythrin‐labelled streptatividin was added and incubated for 30 min. Finally, cells were washed and resuspended in 300 μl of staining media for analysis on a FACSCanto II flow cytometer (Becton Dickinson, Franklin Lakes, NJ, USA) with the facsdiva software (Becton Dickinson). Data were analysed using flowjo software.40
Cell viability assays
T‐cell BY155.16 hybridoma cells (105) expressing CD43 WT, CD43 ΔIC or CD4, and control cells (pFneo) were stimulated with PMA (50 ng/ml)/ ionomycin (1 μg/ml) for 48 hr at 37°, 5% CO2, in 48‐well plates in a final volume of 1 ml; alternatively, cells were stimulated with 4 μg/ml of plate‐bound anti‐TCR (F23.1). At the end of the incubation period, propidium iodide (400 ng/ml) was added to the cells for 10 min at room temperature, in the dark, before analysis on a FACSCanto II flow cytometer, looking for changes in forward scatter (FSC) and side scatter (SSC) as hallmarks of cell death. Propidium‐iodide‐negative cells were quantified as live cells. Data were analysed using flowjo software.40
Statistical analysis
Data shown in the graphs represent the mean ± SD. Data were analysed by a paired t‐test and Tukey's method with prism software (GraphPad Software, Inc., La Jolla, CA, USA), considered significant at P ≤ 0·05.
Results
CD43 co‐stimulation does not enhance pyruvate kinase glycolytic activity
Cellular signalling efficacy ultimately depends on the integration of internal metabolic cues. Particularly, T‐cell activation calls for higher levels of biosynthetic precursors and energy for effector functions. Pyruvate kinase catalyses the conversion of PEP to pyruvate by transferring a phosphate group from PEP to ADP, releasing one ATP molecule. As a quantitative proteomic analysis revealed that co‐stimulation through TCR+CD43 resulted in regulation of pyruvate kinase protein levels (unpublished results), we first assessed whether the classical function of PK was activated in response to CD43. Under our experimental conditions, TCR+CD43 as well as TCR+CD28 stimulated CD4+ T lymphocytes exhibited a trend to up‐regulate PK activity (Table 1), suggesting that TCR+CD43 co‐stimulation does not drive the cells into a glycolytic pathway, but rather that PK performed alternative signalling functions.
Table 1.
Pyruvate kinase activity
| Average | SD | P value | |
|---|---|---|---|
| Unstimulated | 1 | 0 | |
| TCR+CD43 | 1·701 | 0·423 | 0·125 |
| TCR+CD28 | 1·877 | 0·183 | 0·125 |
CD4+ T lymphocytes (1·5 × 107) were stimulated for 48 hr through the T‐cell receptor (TCR)+CD43, or TCR+CD28, to evaluate pyruvate kinase glycolytic activity in cell lysates. Enzyme activity was measured using the coupled method, as described in ‘Materials and methods’. The data shown represent four independent experiments. Numbers represent fold change in absorbance values.
CD43 co‐stimulatory signals favour PKM2 tyrosine phosphorylation and activate moonlight functions of PK
Since the glycolytic activity of PK was not significantly augmented in response to TCR+CD43 co‐stimulation, and given that our quantitative proteomic analysis revealed that co‐stimulation through the TCR+CD43 resulted in regulation of PK protein abundance in two different protein spots as determined by differential in gel electrophoresis (unpublished results), we evaluated the possibility that potential post‐translational modifications of this enzyme were at the source of these differences. Notably, PKM2 Y105 phosphorylation impairs the formation of the tetramer necessary for the glycolytic function of PKM2 and favours that of a dimer with alternative, non‐glycolytic, functions.41 Furthermore, PKM2 is predominant in activated T cells.42 Human T lymphocytes were left unstimulated or activated with the anti‐CD43 L10 and the anti‐CD3 OKT3 monoclonal antibodies. After a 6‐hr stimulation period, PKM2 tyrosine phosphorylation was evaluated. We found that TCR+CD43 co‐stimulation significantly increased PKM2 Y105 phosphorylation compared with control cells (Fig. 1a).
Figure 1.
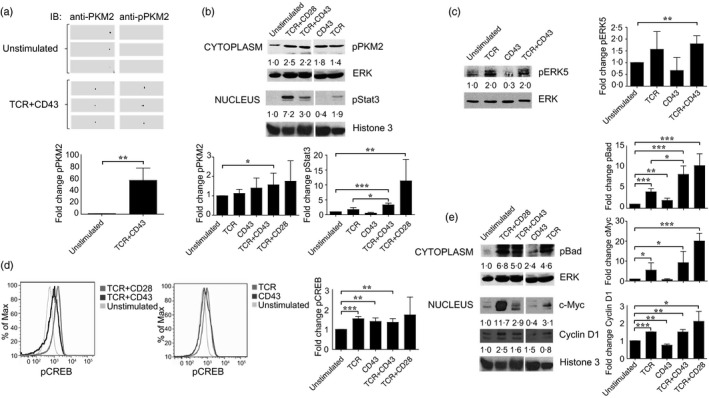
CD43 co‐stimulatory signals induce pyruvate kinase isoform M2 (PKM2) moonlight functions. (a) Quantitative proteomic analysis results were validated in cell lysates from CD4+ T cells activated for 6 hr as described in the Experimental Procedures. PKM2 and PKM2 Y105 phosphorylation was assessed by immunoblot of two‐dimensional gels with samples from three different donors. (b) CD4+ T cells (1·5 × 107) were left unstimulated or stimulated through the T‐cell receptor (TCR), CD43, TCR+CD43, or TCR+CD28 for 3 hr and nuclear and cytosolic extracts were prepared. Phosphorylation of PKM2 on Y105 (pPKM2) and that of signal transducer and activator of transcription (STAT) on Y705 was assessed by immunoblot in cytosolic and nuclear extracts. Total extracellular signal‐regulated kinase 2 (ERK2) and histone 3 levels in the cytoplasm and nuclei, respectively, are shown as loading controls. The data shown are representative of three independent experiments. Numbers represent fold increase values. (c) The levels of pERK5 were evaluated in total cell extracts from unstimulated or TCR, CD43 or TCR+CD43 co‐stimulated CD4+ T cells for 3 hr. Total tubulin levels are shown as loading control. The data shown are representative of three independent experiments. Numbers represent fold increase values. (d) cAMP response element binding protein (CREB) phosphorylation was assessed by phosphoflow analysis of T cells co‐stimulated for 3 hr with TCR+CD43, TCR+CD28, TCR, or CD43 alone and compared with unstimulated cells. The data shown are representative of three independent experiments. Fold change analysis was based on MFI. (e) The activation of downstream targets of the PKM2/STAT3/ERK5 pathway was assessed after 3 hr stimulation in cytoplasmic or nuclear extracts from unstimulated, TCR, CD43, TCR+CD28, or TCR+CD43 co‐stimulated CD4+ T cells, using specific antibodies for phosphorylated Bad (pBad), cyclin D1 and c‐Myc; ERK 2 and histone 3 protein levels are shown as loading control for cytoplasmic and nuclear fractions, respectively. The data shown are representative of three independent experiments. Numbers represent fold increase values. Graphs show fold change in protein phosphorylation or abundance in three donors. P values were considered significant if P ≤ 0·05 (*P <0.05, **P <0.01, and ***P <0.001).
Phosphorylated PKM2 has a protein kinase activity, potentially leading to phosphorylation of the transcription factor STAT3 and up‐regulation of the MEK5/ERK5 pathway.32 TCR+CD43 co‐stimulation significantly increased phosphorylation of STAT3 on Y705 (Fig. 1b), as well as that of ERK5 (Fig. 1c). Engaging the TCR+CD28 resulted in PKM2 Y105 phosphorylation, and in STAT3 phosphorylation (Fig. 1b), as previously reported.43 Engagement of CD43 or of the TCR alone did not lead to significant PKM2, STAT3 or ERK5 phosphorylation (Fig. 1b,c), suggesting that signals from both receptors cooperate to induce the alternative functions of PKM2. Altogether, these data support that co‐stimulating the cells through the TCR+CD43 induces PKM2 tyrosine phosphorylation, favouring the activity of PKM2 protein kinase, as well as STAT3 phosphorylation and activation of the MEK5/ERK5 mitogen‐activated protein kinases, two pathways associated with quiescence, cell survival and proliferation.44, 45
The moonlighting function of PKM2 induced by TCR+CD43 co‐stimulatory signals activates downstream targets of ERK5
To further assess the role of the PKM2/STAT3 pathway in up‐regulating MEK5/ERK5 signalling, we evaluated the activation status of downstream targets of ERK5: CREB, Bad, cyclin D1, c‐Myc and NF‐κB.45 TCR+CD43 co‐stimulation of CD4+ T lymphocytes, as well as TCR or CD43 independent stimulation, resulted in a modest but consistent phosphorylation of the transcription factor CREB (Fig. 1d). In contrast, the abundance of cyclin D1 and c‐Myc significantly increased in cells stimulated with TCR+CD43 or with TCR only, but not in cells with only CD43 stimulation, suggesting that TCR signalling is accountable for c‐Myc and cyclin D1 accumulation in the nucleus (Fig. 1e). Although engagement of CD43 alone induced a modest phosphorylation of the pro‐apoptotic protein Bad compared with that resulting from TCR ligation, co‐stimulating the cells through the TCR+CD43 had a synergistic effect (Fig. 1e), suggesting the activation of anti‐apoptotic pathways. As expected,43, 46, 47 TCR+CD28 stimulation induced the phosphorylation of CREB and Bad, as well as increasing abundance of c‐Myc and cyclin D1 (Fig. 1d,e).
To determine if the CREB, c‐Myc, STAT3, Bad and NF‐κB activation we detected following TCR+CD43 co‐stimulation was dependent on ERK5 enzymatic activity, we stimulated CD4+ T lymphocytes in the presence of XMD8‐92, a specific ERK5 inhibitor.48 As CD43‐mediated signals induced Bad and CREB phosphorylation (Fig. 1d,e), but STAT3 phosphorylation, c‐Myc and NF‐κB activation required signalling through TCR+CD43 (Fig. 1d, e, and see Supplementary material, Fig. S1a), we evaluated the importance of the ERK5 pathway in the activation of the latter proteins in TCR+CD43 co‐stimulated cells. As a consequence of ERK5 inhibition, Bad phosphorylation, but not that of CREB, was reduced, and the up‐regulation of c‐Myc protein levels was partially abolished in TCR+CD43 co‐stimulated cells (Fig. 2a), suggesting the participation of additional pathways. Likewise, NF‐κB activation and STAT3 phosphorylation were found to be dependent on the ERK5 pathway in response to TCR+CD43 co‐stimulation (Fig. 2a). Inhibition of the ERK5 pathway in cells stimulated with TCR only or CD43 only had no impact on Bad or CREB phosphorylation (see Supplementary material, Fig. S1b), further suggesting that co‐stimulation through both receptors is necessary for the activation of the ERK5 pathway.
Figure 2.
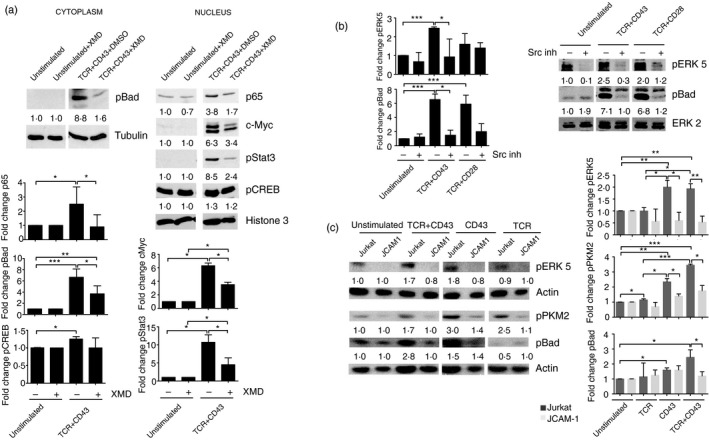
The T‐cell receptor (TCR)+CD43‐induced pyruvate kinase isoform M2 (PKM2)/ signal transducer and activator of transcription (STAT3)/extracellular signal‐regulated kinase 5 (ERK5) pathway targets Bad, nuclear factor‐κB (NF‐κB) and c‐Myc. (a) Cells were pre‐incubated with the ERK5 inhibitor XMD8‐92 (5 μm) 30 min before stimulation for 3 hr with TCR+CD43. Phosphorylation levels of pSTAT3, cAMP response element binding protein (pCREB) and pBad, as well as nuclear c‐Myc and p65 levels, were evaluated by immunoblot; total tubulin and histone 3 levels are shown as loading controls for cytoplasmic and nuclear fractions, respectively. The data shown are representative of three independent experiments. Numbers represent fold increase values. (b) CD4+ T lymphocytes were pre‐incubated with the Src inhibitor PP2 (10 μm) 30 min before stimulation with TCR+CD43 or TCR+CD28. ERK5 and Bad phosphorylation was evaluated by immunoblot; ERK2 levels are shown as loading control. Numbers represent fold increase values. (c) Jurkat and JCAM‐1 cells were stimulated with TCR, CD43, or TCR+CD43, for 3 hr and pPKM2, pBad, and pERK5 phosphorylation levels were evaluated by immunoblot; total actin levels are shown as loading controls. The data shown are representative of three independent experiments. Numbers represent fold increase values. Graphs show fold change in protein phosphorylation or abundance in three donors. P values were considered significant if P ≤ 0·05 (*P <0.05, **P <0.01, and ***P <0.001).
CD43‐dependent signals activate Src kinases, particularly Fyn and Lck.21, 49 Interestingly, PKM250, 51, 52 and the MEK5/ERK5 pathway53, 54 have been described as being targets of Src family kinases. To evaluate the role of Src kinases in the activation of the PKM2/ERK5 pathway, CD4+ T lymphocytes were stimulated in the presence of an Src inhibitor (PP2). We found that the phosphorylation of ERK5 and Bad as a result of TCR+CD43 or TCR+CD28 stimulation was dependent on Src family kinases as both events were abolished in PP2‐treated cells (Fig. 2b). Src inhibition in cells stimulated with TCR only or CD43 only did not significantly reduce ERK5 or Bad phosphorylation (see Supplementary material, Fig. S1b). These data suggest that the phosphorylation of ERK5 and Bad resulting from TCR+CD43 co‐stimulation is Src‐dependent.
Additionally, wild‐type and Lck‐deficient Jurkat cells (JCAM‐1) (see Supplementary material, Fig. S2) were stimulated following the same protocol as T lymphocytes. In wild‐type Jurkat cells, enhanced phosphorylation of PKM2, Bad and ERK5 was observed following TCR+CD43 co‐stimulation. CD43‐dependent signals also induced ERK5, PKM2 and Bad phosphorylation in Jurkat cells, whereas, in contrast to CD4+ T lymphocytes, TCR signalling resulted only in a modest increase in PKM2 phosphorylation, but not in that of ERK5 or Bad. Notably, phosphorylation of ERK5 was comparable in Jurkat cells stimulated with CD43 only or TCR+CD43, and PKM2 and Bad phosphorylation was further increased following TCR+CD43 engagement compared with cells stimulated with TCR only or CD43 only, supporting a co‐stimulatory role for CD43 in the activation of the PKM2/ERK5 pathway. In JCAM‐1 cells, TCR ligation did not induce ERK5, PKM2 or Bad phosphorylation, whereas CD43‐mediated signals resulted in modest PKM2 and Bad phosphorylation, and in TCR+CD43‐stimulated cells, levels of pPKM2 or pBad were comparable to those of cells activated by CD43 only or TCR only, but no ERK5 phosphorylation was detected in either (Fig. 2c). These data suggest that in Jurkat cells, the signalling pathway leading to PKM2, ERK5 and Bad phosphorylation induced in response to TCR+CD43 engagement is dependent on Lck.
Altogether, these results suggest that CD43 co‐stimulatory signals support the activation of the MEK/ERK5 pathway, that up‐regulation of c‐Myc and NF‐κB (p65), and phosphorylation of STAT3 and Bad are dependent on ERK5 activation, and that Src family kinases, namely Lck, participate in PKM2 Y105 phosphorylation in Jurkat cells.
CD43 co‐stimulatory signals activate PKA to synergize with the PKM2/STAT3/ERK5 pathway
CREB is a transcription factor that regulates diverse cellular responses, including proliferation, survival and differentiation.55 Since ERK5 inhibition had no effect on TCR+CD43‐induced CREB phosphorylation (Fig. 2a), we searched for other signalling pathways responsible for the regulation of this transcription factor. In Jurkat cells, stimulation through the TCR alone or co‐stimulation through TCR+CD43 led to CREB phosphorylation (Fig. 3a). Since CD43 signalling alone did not induce CREB phosphorylation in Jurkat cells, and TCR+CD43‐induced CREB phosphorylation was significantly higher than that observed for TCR‐stimulated Jurkat cells, we evaluated that signalling pathways that could be responsible for CREB phosphorylation in TCR+CD43 co‐stimulated cells. We found that in Jurkat cells, CREB phosphorylation is PKA‐dependent while MEK 1/2, p38 or PKC inhibition had no effect on the phosphorylation of this transcription factor (Fig. 3b). PKA activation following TCR+CD43 signalling was confirmed by immunoblot using an antibody that recognizes PKA‐phosphorylated substrates (see Supplementary material, Fig. S3). As CREB is also a target for Akt,56 a kinase that delivers anti‐apoptotic signals through the PI‐3K‐dependent pathway,57 and since the PKA inhibitor (H89) also prevents the activation of Akt,57 we evaluated whether the PI‐3K/Akt pathway was involved in TCR+CD43‐mediated CREB activation. TCR+CD43 co‐stimulation induced Akt phosphorylation in Jurkat cells, and treatment with the PKA inhibitor H89 prevented the activation of this kinase (see Supplementary material, Fig. S4, left panel). Accordingly, inhibition of PI‐3K with LY904002 led to decreased Akt phosphorylation in TCR+CD43 co‐stimulated Jurkat cells, but CREB phosphorylation was not affected (see Supplementary material, Fig. S4, right panel). These data suggest that the phosphorylation of CREB resulting from TCR+CD43 co‐stimulation depends on the activation of the PKA pathway, and that this is independent of the PI‐3K/Akt pathway.
Figure 3.
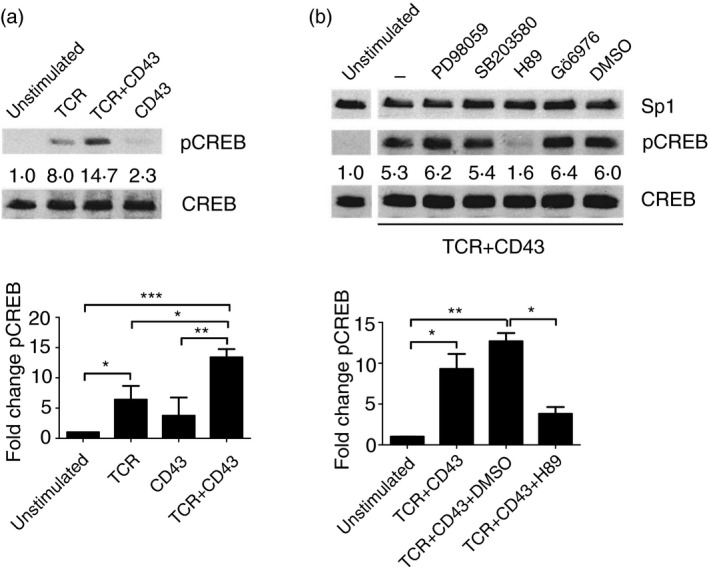
T‐cell receptor (TCR)+CD43 signals induce protein kinase A (PKA) ‐dependent cAMP response element binding protein (CREB) activation. (a) Jurkat cells were stimulated with anti‐TCR, and/or anti‐CD43 antibodies for 10 min and pCREB and total CREB levels were measured in whole cell lysates by immunoblot. The data shown are representative of three independent experiments. (b) Jurkat cells were left untreated or pre‐incubated with enzyme inhibitors for MEK 1/2 (PD98059, 8·3 μm), p38 (SB203580, 0·83 μm), protein kinase A (PKA; H89, 8·3 μm), and protein kinase C (PKC; Gö6976, 3·3 nm) before TCR+CD43 co‐stimulation. pCREB levels were evaluated by immunoblot in whole cell lysates after 10 min of stimulation; CREB and Sp1 levels are shown as loading controls. Numbers represent fold change values. The data shown are representative of two independent experiments. (*P <0.05, **P <0.01, and ***P <0.001).
Expression of wild‐type CD43 favours cell survival following cell activation
The expression of CD43 has been shown to convey a survival advantage for CD4+ and CD8+ splenocytes during apoptosis induction via growth factor withdrawal,58 independent of antibody‐mediated ligation. Based on our results supporting a role for CD43‐mediated signals in activating anti‐apoptotic and pro‐survival molecules, and in view of the fact that T‐cell hybridomas can undergo apoptotic cell death when activated through the T‐cell receptor complex,59 clones of the By155.16 T‐cell hybridoma expressing comparable amounts of the TCR and of human CD43 WT, CD43 ΔIC or CD4 (Fig. 4a) were evaluated for survival in response to PMA/Ionomycin or F23.1 stimulation. Expressing CD43 WT protected the cells from PMA/Ionomycin‐induced cell death, resulting in significantly more live cells (79%), compared with pFneo cells (65%) or BY CD4 cells (61%). On the contrary, expressing a CD43 mutant lacking the intracellular domain (CD43 ΔIC) rendered the cells even more sensitive to PMA/Ionomycin‐induced cell death with a survival toll of 46% (Fig 4b). CD43 WT transfected BY155.16 cells significantly survived more with plate‐bound anti‐TCR monoclonal antibody (F23.1) (96%) compared with BY pFneo (80%) or BY CD4 cells (72%), and expressing CD43 ΔIC also resulted in a higher susceptibility to TCR‐induced cell death (Fig. 4c). All unstimulated cells had a viability of > 92% when evaluated after a 48‐hr incubation. Consistent with previous data showing that the intracellular domain of CD43 is required for the regulation of cell viability,58 these results indicate that CD43 expression protects the cells from apoptotic signals, but also that lacking the CD43 intracellular domain represents a disadvantage for cell survival, Altogether, these results suggest that CD43 participates in cell survival in response to TCR‐ or PMA‐dependent signals, potentially contributing to the regulation of T‐cell homeostasis following activation.
Figure 4.
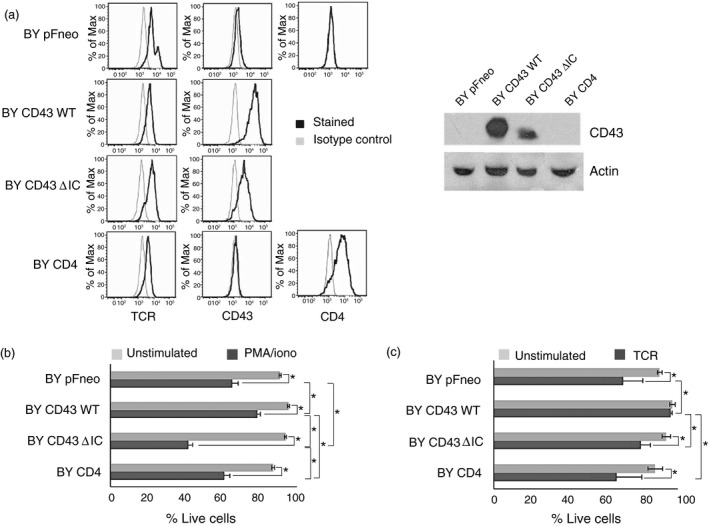
CD43 expression promotes cell survival of activated cells. (a) The murine T‐cell hybridoma BY155.16 was transfected with empty vector (pFneo), full‐length human CD43 (CD43 WT), a mutant lacking the intracellular domain (CD43 ΔIC), or human CD4. The surface expression of each co‐stimulatory molecule was evaluated by FACS analysis (left panel). The molecular weight of the full‐length CD43 (CD43 WT) and truncated CD43 (CD43 ΔIC) was determined by immunoblot (right panel) using the L10 anti‐CD43 monoclonal antibody. Actin levels are shown as loading control. (b) Cells were left unstimulated (ᴓ) or stimulated with PMA (50 ng/ml)/ionomycin (1 μg/ml) (P/I) for 48 hr, and cell viability was measured by quantification of propidium‐iodide‐negative cells. The data shown are representative of four independent experiments. (c) Alternatively, cells were left unstimulated (ᴓ) or stimulated with 4 μg/ml plate‐bound anti‐TCR monoclonal antibody (F23.1) for 48 hr, and cell viability was measured by quantification of propidium iodide‐negative cells. The data shown are representative of three independent experiments. P values were considered significant if P ≤ 0.05, * indicates P values from 0.01 to 0.05.
Discussion
Similar to CD28 signalling cascades,60 CD43 engagement activates multiple signalling pathways, ultimately regulating cell fate.61 To further characterize the participation of CD43 in T‐cell activation, we carried out a proteomic analysis of normal human peripheral blood CD4+ T lymphocytes co‐stimulated with TCR+CD43. The biological processes regulated by the proteins found to be modulated in response to TCR+CD43‐mediated signals, pointed at the ‘generation of precursor metabolites and energy’ and ‘regulation of apoptosis’ as the most enriched biological processes (23% and 13%, respectively, unpublished results), prompting us to explore the participation of CD43 in the regulation of glucose metabolism. Particularly, the proteomic data indicated that TCR+CD43 signalling modulated the abundance of PK, which we were able to validate by immunoblot. Out of the four isoforms of PK, PKM2 is expressed in most cells,62 including activated T cells.63 Sp1, HIF‐1 and c‐Myc activate PKM2 transcription; in addition, c‐Myc also activates the transcription of hnRNPA1 and hnRNPA2 (heterogeneous nuclear ribonucleoprotein), two splicing factors that promote the alternative splicing that generates PKM2 mRNA.64, 65, 66 Interestingly, according to our proteomic analysis, the expression level of these factors was also modulated in response to TCR+CD43 signals (unpublished data).
Pyruvate kinase is a rate‐limiting enzyme that catalyses the last step of glycolysis, converting PEP to pyruvate by transferring a phosphate group from PEP to ADP, releasing one ATP molecule. Contrary to our expectations, under our experimental conditions, TCR+CD43 co‐stimulation did not significantly augment PK glycolytic activity, suggesting rather that CD43 co‐stimulatory signals favoured the alternative functions of PK. Accordingly, we found that co‐stimulating CD4+ human T lymphocytes through TCR+CD43 led to phosphorylation of PKM2 on Y105, a protein modification that impairs the tetramer formation necessary for PKM2 to promote oxidative metabolism for energy production,41 and favours the formation of a dimer that leads to the anabolic metabolism of glucose, supporting the biosynthesis of macromolecules necessary for cell proliferation.50 Although the accumulation of metabolic intermediates upstream of the glycolytic pathway under our experimental conditions remains to be tested, these data correlate with the fact that CD43 engagement did not lead to increased glycolysis.
In addition, we found that STAT3 Y705 was phosphorylated in response to TCR+CD43 co‐stimulation, suggesting that the TCR+CD43‐mediated activation of PKM2 is responsible for the activation of this transcription factor. This is in line with previous reports showing that phosphorylation allows PKM2 to function as a co‐activator for transcription factors such as HIF‐1α, HIF‐2α, β‐catenin, STAT3 and Oct‐4, which in turn favour the transcription of target genes such as: SLC2A1 (Glut‐1), LDHA, PKD1, HK1, VEGFA, CCND1, MYC and MEK5.32, 67, 68, 69 Whether the phosphorylation of STAT3 is directly mediated by PKM2 still remains to be determined in our system.
The MEK5/ERK5 signalling pathway is strongly involved in cell survival and proliferation.45 ERK5 phosphorylation and higher abundance of several ERK5 targets demonstrated the role of CD43 co‐stimulatory signals in activating the MEK/ERK5 pathway. In agreement with this, inhibition of ERK5 led to diminished c‐Myc, p65 and pSTAT3 abundance, suggesting that in TCR+CD43 co‐stimulated cells, the abundance of these molecules was partially dependent on ERK5, but that other signalling pathways participate for their accumulation in the nucleus. Likewise, CREB and Bad, two proteins involved in apoptosis regulation and potential ERK5 targets70 were phosphorylated in response to TCR+CD43 co‐stimulatory signals. Bad and STAT3 phosphorylation were diminished in TCR+CD43 co‐stimulated cells in the presence of the ERK5 inhibitor and consistent with data showing that CD43 signalling leads to Lck and Fyn activation,21, 49 we observed that in TCR+CD43 co‐stimulated T cells, ERK5 and Bad phosphorylation is dependent on Src family kinases. Although CREB can be activated as a result of the MEK5/ERK5 pathway, under our experimental conditions, we found that the PKA pathway is the major mechanism responsible for CREB phosphorylation in response to the TCR+CD43 co‐stimulatory signals. PKA activation leads also to Bad phosphorylation,71 whether this happens in response to TCR+CD43 stimulation remains to be investigated. Under our experimental conditions, TCR+CD43 co‐stimulatory signals parallelled the TCR+CD28 co‐stimulatory ones, although to a lesser extent, in terms of abundance of c‐Myc and cyclin D1 and Bad phosphorylation. Altogether this data further suggest that CD43 co‐stimulatory signals promote the non‐glycolytic functions of PKM2, and that the MEK5/ERK5 and the PKA signalling pathways may be simultaneously activated by CD43, potentially regulating resistance to cell death.
In neutrophils, mast cells, T cells and granulocytes, CD43 is cleaved by γ‐secretase following PMA treatment. As a consequence, the extracellular domain of CD43 is shed from the cell surface, and the intracellular domain, which contains two nuclear localization signals, is translocated into the nucleus58 where it may interact with β‐catenin to promote cell proliferation,72 and with promyelocytic nuclear bodies, to regulate growth factor withdrawal‐induced apoptosis.58, 73 Inhibition of γ‐secretase impairs nuclear translocation of the cytoplasmic domain of CD43 and prevention of apoptosis.58 Consistent with a role for CD43 in cell death protection, targeting CD43 with small interfering RNA increases the susceptibility of breast and lung cancer cells to apoptosis and vulnerability to lysis by natural killer cells.74, 75 Likewise, in the BY155.16 murine T‐cell hybridoma, the expression of wild‐type human CD43 protected the cells against apoptosis following TCR engagement or PMA/ionomycin stimulation; on the contrary, the absence of the intracellular domain rather enhanced cell death toll, suggesting that the CD43 mutant lacking the intracellular domain functioned in a dominant negative fashion. Considering that the BY155.16 hybridoma cells express murine CD43, these data also suggest that murine CD43 could be responsible for the remaining live cells in PMA/ionomycin or TCR‐stimulated cells (40% or 80%, respectively), counterbalancing the dominant negative function of CD43 ΔIC. Furthermore, in addition, to the conserved S72 and S76 shown to participate in regulation of cell movement and proliferation and trafficking, respectively,76 the intracellular region of human CD43 has other PKC phosphorylation pattern sites that are not present in murine CD43 (residues 59–61 and 91–93 of CD43 cytoplasmic domain).61 Whether these sites confer additional capacities to human CD43 over murine CD43 in terms of cell death resistance, and whether murine CD43 can potentially overcome the dominant negative effect of the human CD43 ΔIC favouring the activation on anti‐apoptotic pathways, need to be addressed.
Collectively, our results provide evidence that by regulating the non‐glycolytic functions of PKM2, CD43 co‐stimulatory signals promote the activation of the MEK/ERK5 and the PKA pathways, two pathways associated with cell growth and proliferation.25, 30, 77 Moreover, our data indicate that TCR+CD43 co‐stimulation leads to the activation of multiple signalling pathways that share common key targets, such as CREB and Bad, highlighting the importance of regulating these proteins during cell activation to promote cell survival. Cell survival and proliferation are essential for the effector phase of the immune response and the fine‐tuning of these processes is critical for the appropriate contraction and memory establishment. Hence, through the activation of pro‐survival signalling pathways, CD43 may contribute to the regulation of homeostasis of the immune response.
Author contributions
MEBA designed and performed research, analysed data and wrote the paper; RVE and BJB contributed to experimental design, research and paper revision; CMC, AFA and JPOO contributed to research; GPA contributed to experimental design and paper revision; YR contributed to experimental design, data analysis, paper writing and revision, and led the study.
Disclosures
The authors declare they have no competing interests or other interests that might be perceived to influence the interpretation of results and discussion reported in this paper.
Supporting information
Figure S1. Extracellular signal‐regulated kinase 5 (ERK5), Bad and cAMP response element binding protein (CREB) phosphorylation, as well as p65 nuclear localization require T‐cell receptor (TCR)+CD43 co‐stimulatory signals.
Figure S2. Abundance of Lck, pyruvate kinase isoform M2 (PKM2) and extracellular signal‐regulated kinase 5 (ERK5) in Jurkat and JCAM‐1 cells.
Figure S3. T‐cell receptor (TCR)+CD43 crosslinking induces protein kinase A (PKA) activation.
Figure S4. T‐cell receptor (TCR)+CD43‐induced cAMP response element binding protein (CREB) phosphorylation in Jurkat cells is protein kinase A (PKA) dependent.
Acknowledgements
We thank the blood donors for the generous gift of their lymphocytes. We thank Dr Humberto Vaquera for support with statistical analysis and Erika Melchy for technical support. Work in our laboratories was supported by grants # IN219307, IN206913 and IN212716 from DGAPA/UNAM (Departamento General de Apoyo para el Personal Académico, Universidad Nacional Autónoma de México) and grnats # 100275 and 220990 from CONACyT (Consejo Nacional de Ciencía y Tecnología), México to YR. MEBA and CMC were recipients of scholarships from CONACyT.
References
- 1. Mueller DL, Jenkins MK, Schwartz RH. Clonal expansion versus functional clonal inactivation: a costimulatory signalling pathway determines the outcome of T cell antigen receptor occupancy. Annu Rev Immunol 1989; 7:445–80. [DOI] [PubMed] [Google Scholar]
- 2. Curtsinger JM, Mescher MF. Inflammatory cytokines as a third signal for T cell activation. Curr Opin Immunol 2010; 22:333–40. [DOI] [PMC free article] [PubMed] [Google Scholar]
- 3. Fox CJ, Hammerman PS, Thompson CB. Fuel feeds function: energy metabolism and the T‐cell response. Nat Rev Immunol 2005; 5:844–52. [DOI] [PubMed] [Google Scholar]
- 4. Frauwirth KA, Riley JL, Harris MH, Parry RV, Rathmell JC, Plas DR et al The CD28 signaling pathway regulates glucose metabolism. Immunity 2002; 16:769–77. [DOI] [PubMed] [Google Scholar]
- 5. Zheng Y, Delgoffe GM, Meyer CF, Chan W, Powell JD. Anergic T cells are metabolically anergic. J Immunol 2009; 183:6095–101. [DOI] [PMC free article] [PubMed] [Google Scholar]
- 6. Fukuda M, Carlsson SR. Leukosialin, a major sialoglycoprotein on human leukocytes as differentiation antigens. Med Biol 1986; 64:335–43. [PubMed] [Google Scholar]
- 7. Carlsson SR, Fukuda M. Isolation and characterization of leukosialin, a major sialoglycoprotein on human leukocytes. J Biol Chem 1986; 261:12779–86. [PubMed] [Google Scholar]
- 8. Remold‐O'Donnell E, Zimmerman C, Kenney D, Rosen FS. Expression on blood cells of sialophorin, the surface glycoprotein that is defective in Wiskott–Aldrich syndrome. Blood 1987; 70:104–9. [PubMed] [Google Scholar]
- 9. Park JK, Rosenstein YJ, Remold‐O'Donnell E, Bierer BE, Rosen FS, Burakoff SJ. Enhancement of T‐cell activation by the CD43 molecule whose expression is defective in Wiskott–Aldrich syndrome. Nature 1991; 350:706–9. [DOI] [PubMed] [Google Scholar]
- 10. Sperling AI, Green JM, Mosley RL, Smith PL, DiPaolo RJ, Klein JR et al CD43 is a murine T cell costimulatory receptor that functions independently of CD28. J Exp Med 1995; 182:139–46. [DOI] [PMC free article] [PubMed] [Google Scholar]
- 11. Cannon JL, Mody PD, Blaine KM, Chen EJ, Nelson AD, Sayles LJ et al CD43 interaction with ezrin‐radixin‐moesin (ERM) proteins regulates T‐cell trafficking and CD43 phosphorylation. Mol Biol Cell 2011; 22:954–63. [DOI] [PMC free article] [PubMed] [Google Scholar]
- 12. Woodman RC, Johnston B, Hickey MJ, Teoh D, Reinhardt P, Poon BY et al The functional paradox of CD43 in leukocyte recruitment: a study using CD43‐deficient mice. J Exp Med 1998; 188:2181–6. [DOI] [PMC free article] [PubMed] [Google Scholar]
- 13. Stockton BM, Cheng G, Manjunath N, Ardman B, von Andrian UH. Negative regulation of T cell homing by CD43. Immunity 1998; 8:373–81. [DOI] [PubMed] [Google Scholar]
- 14. Manjunath N, Correa M, Ardman M, Ardman B. Negative regulation of T‐cell adhesion and activation by CD43. Nature 1995; 377:535–8. [DOI] [PubMed] [Google Scholar]
- 15. Onami TM, Harrington LE, Williams MA, Galvan M, Larsen CP, Pearson TC et al Dynamic regulation of T cell immunity by CD43. J Immunol 2002; 168:6022–31. [DOI] [PubMed] [Google Scholar]
- 16. Ford ML, Onami TM, Sperling AI, Ahmed R, Evavold BD. CD43 modulates severity and onset of experimental autoimmune encephalomyelitis. J Immunol 2003; 171:6527–33. [DOI] [PubMed] [Google Scholar]
- 17. Misawa Y, Nagaoka H, Kimoto H, Ishii Y, Kitamura K, Tsunetsugu‐Yokota Y et al CD43 expression in a B cell lymphoma, WEHI 231, reduces susceptibility to G1 arrest and extends survival in culture upon serum depletion. Eur J Immunol 1996; 26:2573–81. [DOI] [PubMed] [Google Scholar]
- 18. Murakami YI, Yatabe Y, Sakaguchi T, Sasaki E, Yamashita Y, Morito N et al c‐Maf expression in angioimmunoblastic T‐cell lymphoma. Am J Surg Pathol 2007; 31:1695–702. [DOI] [PubMed] [Google Scholar]
- 19. Kadaja L, Laos S, Maimets T. Overexpression of leukocyte marker CD43 causes activation of the tumor suppressor proteins p53 and ARF. Oncogene 2004; 23:2523–30. [DOI] [PubMed] [Google Scholar]
- 20. Camacho‐Concha N, Olivos‐Ortiz A, Nunez‐Rivera A, Pedroza‐Saavedra A, Gutierrez‐Xicotencatl L, Rosenstein Y et al CD43 promotes cells transformation by preventing merlin‐mediated contact inhibition of growth. PLoS One 2013; 8f:e80806. [DOI] [PMC free article] [PubMed] [Google Scholar]
- 21. Pedraza‐Alva G, Merida LB, Burakoff SJ, Rosenstein Y. CD43‐specific activation of T cells induces association of CD43 to Fyn kinase. J Biol Chem 1996; 271:27564–8. [DOI] [PubMed] [Google Scholar]
- 22. Cruz‐Munoz ME, Salas‐Vidal E, Salaiza‐Suazo N, Becker I, Pedraza‐Alva G, Rosenstein Y. The CD43 coreceptor molecule recruits the ζ‐chain as part of its signaling pathway. J Immunol 2003; 171:1901–8. [DOI] [PubMed] [Google Scholar]
- 23. Pedraza‐Alva G, Merida LB, Burakoff SJ, Rosenstein Y. T cell activation through the CD43 molecule leads to Vav tyrosine phosphorylation and mitogen‐activated protein kinase pathway activation. J Biol Chem 1998; 273:14218–24. [DOI] [PubMed] [Google Scholar]
- 24. Layseca‐Espinosa E, Pedraza‐Alva G, Montiel JL, del Rio R, Fierro NA, Gonzalez‐Amaro R et al T cell aggregation induced through CD43: intracellular signals and inhibition by the immunomodulatory drug leflunomide. J Leukoc Biol 2003; 74:1083–93. [DOI] [PubMed] [Google Scholar]
- 25. Fierro NA, Pedraza‐Alva G, Rosenstein Y. TCR‐dependent cell response is modulated by the timing of CD43 engagement. J Immunol 2006; 176:7346–53. [DOI] [PubMed] [Google Scholar]
- 26. Stefanova I, Hemmer B, Vergelli M, Martin R, Biddison WE, Germain RN. TCR ligand discrimination is enforced by competing ERK positive and SHP‐1 negative feedback pathways. Nat Immunol 2003; 4:248–54. [DOI] [PubMed] [Google Scholar]
- 27. Silverman LB, Wong RC, Remold‐O'Donnell E, Vercelli D, Sancho J, Terhorst C et al Mechanism of mononuclear cell activation by an anti‐CD43 (sialophorin) agonistic antibody. J Immunol 1989; 142:4194–200. [PubMed] [Google Scholar]
- 28. del Rio R, Rincon M, Layseca‐Espinosa E, Fierro NA, Rosenstein Y, Pedraza‐Alva G. PKCθ is required for the activation of human T lymphocytes induced by CD43 engagement. Biochem Biophys Res Commun 2004; 325:133–43. [DOI] [PubMed] [Google Scholar]
- 29. Santana MA, Pedraza‐Alva G, Olivares‐Zavaleta N, Madrid‐Marina V, Horejsi V, Burakoff SJ et al CD43‐mediated signals induce DNA binding activity of AP‐1, NF‐AT, and NFκB transcription factors in human T lymphocytes. J Biol Chem 2000; 275:31460–8. [DOI] [PubMed] [Google Scholar]
- 30. Mattioli I, Dittrich‐Breiholz O, Livingstone M, Kracht M, Schmitz ML. Comparative analysis of T‐cell costimulation and CD43 activation reveals novel signaling pathways and target genes. Blood 2004; 104:3302–4. [DOI] [PubMed] [Google Scholar]
- 31. Luo W, Semenza GL. Emerging roles of PKM2 in cell metabolism and cancer progression. Trends Endocrinol Metab 2012; 23:560–6. [DOI] [PMC free article] [PubMed] [Google Scholar]
- 32. Gao X, Wang H, Yang JJ, Liu X, Liu ZR. Pyruvate kinase M2 regulates gene transcription by acting as a protein kinase. Mol Cell 2012; 45:598–609. [DOI] [PMC free article] [PubMed] [Google Scholar]
- 33. Song H, Jin X, Lin J. Stat3 upregulates MEK5 expression in human breast cancer cells. Oncogene 2004; 23:8301–9. [DOI] [PubMed] [Google Scholar]
- 34. Straus DB, Weiss A. Genetic evidence for the involvement of the lck tyrosine kinase in signal transduction through the T cell antigen receptor. Cell 1992; 70:585–93. [DOI] [PubMed] [Google Scholar]
- 35. Sleckman BP, Peterson A, Jones WK, Foran JA, Greenstein JL, Seed B et al Expression and function of CD4 in a murine T‐cell hybridoma. Nature 1987; 328:351–3. [DOI] [PubMed] [Google Scholar]
- 36. Hu B. Methods of Enzymatic Analysis. Weinheim, Germany: New York Academy Press, 1963. [Google Scholar]
- 37. Vera‐Estrella R, Barkla BJ, Amezcua‐Romero JC, Pantoja O. Day/night regulation of aquaporins during the CAM cycle in Mesembryanthemum crystallinum . Plant, Cell Environ 2012; 35:485–501. [DOI] [PubMed] [Google Scholar]
- 38. Schreiber E, Matthias P, Müller MM, Schaffner W. Rapid detection of octamer binding proteins with ‘mini extracts’, prepared from a small number of cells. Nucleic Acids Res 1989; 17:6419. [DOI] [PMC free article] [PubMed] [Google Scholar]
- 39. Krutzik PO, Clutter MR, Trejo A, Nolan GP. Fluorescent cell barcoding for multiplex flow cytometry. Curr Protoc Cytom 2011; Chapter 6:Unit 6.31.1‐6.31.15. doi: 10.1002/0471142956.cy0631s55. [DOI] [PMC free article] [PubMed] [Google Scholar]
- 40. FlowJo Software. Tree Star, Inc., 1997. –2012.
- 41. Hitosugi T, Kang S, Vander Heiden MG, Chung TW, Elf S, Lythgoe K et al Tyrosine phosphorylation inhibits PKM2 to promote the Warburg effect and tumor growth.Sci Signal 2009; 2:ra73. [DOI] [PMC free article] [PubMed] [Google Scholar]
- 42. Marjanovic S, Eriksson I, Nelson BD. Expression of a new set of glycolytic isozymes in activated human peripheral lymphocytes. Biochim Biophys Acta 1990; 1087:1–6. [DOI] [PubMed] [Google Scholar]
- 43. Goodman WA, Young AB, McCormick TS, Cooper KD, Levine AD. Stat3 phosphorylation mediates resistance of primary human T cells to regulatory T cell suppression. J Immunol 2011; 186:3336–45. [DOI] [PMC free article] [PubMed] [Google Scholar]
- 44. Egwuagu CE. STAT3 in CD4+ T helper cell differentiation and inflammatory diseases. Cytokine 2009; 47:149–56. [DOI] [PMC free article] [PubMed] [Google Scholar]
- 45. Drew BA, Burow ME, Beckman BS. MEK5/ERK5 pathway: the first fifteen years. Biochim Biophys Acta 2012; 1825:37–48. [DOI] [PMC free article] [PubMed] [Google Scholar]
- 46. Villalba M, Bushway P, Altman A. Protein kinase C‐theta mediates a selective T cell survival signal via phosphorylation of BAD. J Immunol 2001; 166:5955–63. [DOI] [PubMed] [Google Scholar]
- 47. Hsueh YP, Liang HE, Ng SY, Lai MZ. CD28‐costimulation activates cyclic AMP‐responsive element‐binding protein in T lymphocytes. J Immunol 1997; 158:85–93. [PubMed] [Google Scholar]
- 48. Yang Q, Deng X, Lu B, Cameron M, Fearns C, Patricelli MP et al Pharmacological inhibition of BMK1 suppresses tumor growth through promyelocytic leukemia protein. Cancer Cell 2010; 18:258–67. [DOI] [PMC free article] [PubMed] [Google Scholar]
- 49. Alvarado M, Klassen C, Cerny J, Horejsi V, Schmidt RE. MEM‐59 monoclonal antibody detects a CD43 epitope involved in lymphocyte activation. Eur J Immunol 1995; 25:1051–5. [DOI] [PubMed] [Google Scholar]
- 50. Mazurek S. Pyruvate kinase type M2: a key regulator of the metabolic budget system in tumor cells. Int J Biochem Cell Biol 2011; 43:969–80. [DOI] [PubMed] [Google Scholar]
- 51. Burr JG, Dreyfuss G, Penman S, Buchanan JM. Association of the src gene product of Rous sarcoma virus with cytoskeletal structures of chicken embryo fibroblasts. Proc Natl Acad Sci USA 1980; 77:3484–8. [DOI] [PMC free article] [PubMed] [Google Scholar]
- 52. Wu S, Le H. Dual roles of PKM2 in cancer metabolism. Acta Biochim Biophys Sin (Shanghai) 2013; 45:27–35. [DOI] [PubMed] [Google Scholar]
- 53. Suzaki Y, Yoshizumi M, Kagami S, Koyama AH, Taketani Y, Houchi H et al Hydrogen peroxide stimulates c‐Src‐mediated big mitogen‐activated protein kinase 1 (BMK1) and the MEF2C signaling pathway in PC12 cells: potential role in cell survival following oxidative insults. J Biol Chem 2002; 277:9614–21. [DOI] [PubMed] [Google Scholar]
- 54. Sun W, Kesavan K, Schaefer BC, Garrington TP, Ware M, Johnson NL et al MEKK2 associates with the adapter protein Lad/RIBP and regulates the MEK5‐BMK1/ERK5 pathway. J Biol Chem 2001; 276:5093–100. [DOI] [PubMed] [Google Scholar]
- 55. Mayr B, Montminy M. Transcriptional regulation by the phosphorylation‐dependent factor CREB. Nat Rev Mol Cell Biol 2001; 2:599–609. [DOI] [PubMed] [Google Scholar]
- 56. Du K, Montminy M. CREB is a regulatory target for the protein kinase Akt/PKB. J Biol Chem 1998; 273:32377–9. [DOI] [PubMed] [Google Scholar]
- 57. Duronio V. The life of a cell: apoptosis regulation by the PI3K/PKB pathway. Biochem J 2008; 415:333–44. [DOI] [PubMed] [Google Scholar]
- 58. Seo W, Ziltener HJ. CD43 processing and nuclear translocation of CD43 cytoplasmic tail are required for cell homeostasis. Blood 2009; 114:3567–77. [DOI] [PubMed] [Google Scholar]
- 59. Shi YF, Sahai BM, Green DR. Cyclosporin A inhibits activation‐induced cell death in T‐cell hybridomas and thymocytes. Nature 1989; 339:625–6. [DOI] [PubMed] [Google Scholar]
- 60. Chen L, Flies DB. Molecular mechanisms of T cell co‐stimulation and co‐inhibition. Nat Rev Immunol 2013; 13:227–42. [DOI] [PMC free article] [PubMed] [Google Scholar]
- 61. Bravo‐Adame M, Sandoval‐Hernandez M, Migueles‐Lozano O, Rosenstein Y. CD43 In: Choi S, ed. Encyclopedia of Signaling Molecules: New York: Springer, 2012: 320–8. [Google Scholar]
- 62. Imamura K, Tanaka T. Multimolecular forms of pyruvate kinase from rat and other mammalian tissues. I. Electrophoretic studies. J Biochem 1972; 71:1043–51. [DOI] [PubMed] [Google Scholar]
- 63. Wang R, Dillon CP, Shi LZ, Milasta S, Carter R, Finkelstein D et al The transcription factor Myc controls metabolic reprogramming upon T lymphocyte activation. Immunity 2011; 35:871–82. [DOI] [PMC free article] [PubMed] [Google Scholar]
- 64. Clower CV, Chatterjee D, Wang Z, Cantley LC, Vander Heiden MG, Krainer AR. The alternative splicing repressors hnRNP A1/A2 and PTB influence pyruvate kinase isoform expression and cell metabolism. Proc Natl Acad Sci USA 2010; 107:1894–9. [DOI] [PMC free article] [PubMed] [Google Scholar]
- 65. Discher DJ, Bishopric NH, Wu X, Peterson CA, Webster KA. Hypoxia regulates β‐enolase and pyruvate kinase‐M promoters by modulating Sp1/Sp3 binding to a conserved GC element. J Biol Chem 1998; 273:26087–93. [DOI] [PubMed] [Google Scholar]
- 66. Luo W, Hu H, Chang R, Zhong J, Knabel M, O'Meally R et al Pyruvate kinase M2 is a PHD3‐stimulated coactivator for hypoxia‐inducible factor 1. Cell 2011; 145:732–44. [DOI] [PMC free article] [PubMed] [Google Scholar]
- 67. Luo W, Semenza GL. Pyruvate kinase M2 regulates glucose metabolism by functioning as a coactivator for hypoxia‐inducible factor 1 in cancer cells. Oncotarget 2011; 2:551–6. [DOI] [PMC free article] [PubMed] [Google Scholar]
- 68. Yang W, Xia Y, Ji H, Zheng Y, Liang J, Huang W et al Nuclear PKM2 regulates β‐catenin transactivation upon EGFR activation. Nature 2011; 480:118–22. [DOI] [PMC free article] [PubMed] [Google Scholar]
- 69. Lee J, Kim HK, Han YM, Kim J. Pyruvate kinase isozyme type M2 (PKM2) interacts and cooperates with Oct‐4 in regulating transcription. Int J Biochem Cell Biol 2008; 40:1043–54. [DOI] [PubMed] [Google Scholar]
- 70. Wang X, Tournier C. Regulation of cellular functions by the ERK5 signalling pathway. Cell Signal 2006; 18:753–60. [DOI] [PubMed] [Google Scholar]
- 71. Lizcano JM, Morrice N, Cohen P. Regulation of BAD by cAMP‐dependent protein kinase is mediated via phosphorylation of a novel site, Ser155. Biochem J 2000; 349:547–57. [DOI] [PMC free article] [PubMed] [Google Scholar] [Retracted]
- 72. Andersson CX, Fernandez‐Rodriguez J, Laos S, Sikut R, Sikut A, Baeckstrom D et al CD43 has a functional NLS, interacts with β‐catenin, and affects gene expression. Biochem Biophys Res Commun 2004; 316:12–7. [DOI] [PubMed] [Google Scholar]
- 73. Salomoni P, Pandolfi PP. The role of PML in tumor suppression. Cell 2002; 108:165–70. [DOI] [PubMed] [Google Scholar]
- 74. Fu Q, Cash SE, Andersen JJ, Kennedy CR, Madadi AR, Raghavendra M et al Intracellular patterns of sialophorin expression define a new molecular classification of breast cancer and represent new targets for therapy. Br J Cancer 2014; 110:146–55. [DOI] [PMC free article] [PubMed] [Google Scholar]
- 75. Fu Q, Cash SE, Andersen JJ, Kennedy CR, Oldenburg DG, Zander VB et al CD43 in the nucleus and cytoplasm of lung cancer is a potential therapeutic target. Int J Cancer 2013; 132:1761–70. [DOI] [PubMed] [Google Scholar]
- 76. Mody PD, Cannon JL, Bandukwala HS, Blaine KM, Schilling AB, Swier K et al Signaling through CD43 regulates CD4 T‐cell trafficking. Blood 2007; 110:2974–82. [DOI] [PMC free article] [PubMed] [Google Scholar]
- 77. Pedraza‐Alva G, Merida LB, del Rio R, Fierro NA, Cruz‐Munoz ME, Olivares N et al CD43 regulates the threshold for T cell activation by targeting Cbl functions. IUBMB Life 2011; 63:940–8. [DOI] [PMC free article] [PubMed] [Google Scholar]
Associated Data
This section collects any data citations, data availability statements, or supplementary materials included in this article.
Supplementary Materials
Figure S1. Extracellular signal‐regulated kinase 5 (ERK5), Bad and cAMP response element binding protein (CREB) phosphorylation, as well as p65 nuclear localization require T‐cell receptor (TCR)+CD43 co‐stimulatory signals.
Figure S2. Abundance of Lck, pyruvate kinase isoform M2 (PKM2) and extracellular signal‐regulated kinase 5 (ERK5) in Jurkat and JCAM‐1 cells.
Figure S3. T‐cell receptor (TCR)+CD43 crosslinking induces protein kinase A (PKA) activation.
Figure S4. T‐cell receptor (TCR)+CD43‐induced cAMP response element binding protein (CREB) phosphorylation in Jurkat cells is protein kinase A (PKA) dependent.