

Abstract
OBJECTIVES
Adult guidelines suggest an area under the curve/minimum inhibitory concentration (AUC/MIC) > 400 corresponds to a vancomycin trough serum concentration of 15 to 20 mg/L for methicillin-resistant Staphylococcus aureus infections, but obtaining these troughs in children are difficult. The primary objective of this study was to assess the likelihood that 15 mg/kg of vancomycin every 6 hours in a child achieves an AUC/MIC > 400.
METHODS
This retrospective chart review included pediatric patients >2 months to <18 years with a positive S aureus blood culture and documented MIC who received at least two doses of vancomycin with corresponding trough. Patients were divided into two groups: group 1 initially receiving ≥15 mg/kg every 6 hours, and group 2 initially receiving any other dosing ranges or intervals. AUCs were calculated four times using three pharmacokinetic methods.
RESULTS
A total of 36 patients with 99 vancomycin trough serum concentrations were assessed. Baseline characteristics were similar between groups. For troughs in group 1 (n = 55), the probability of achieving an AUC/MIC > 400 ranged from 16.4% to 90.9% with a median trough concentration of 11.4 mg/L, while in group 2 (n = 44) the probability of achieving AUC/MIC > 400 ranged from 15.9% to 54.5% with mean trough concentration of 9.2 mg/L. The AUC/MICs were not similar between the different pharmacokinetic methods used; however, a trapezoidal equation (Method A) yielded the highest correlation coefficient (r2 = 0.59). When dosing every 6 hours, an AUC/MIC of 400 correlated to a trough serum concentration of 11 mg/L.
CONCLUSIONS
The probability of achieving an AUC/MIC > 400 using only a trough serum concentration and an MIC with patients receiving 15 mg/kg every 6 hours is variable based on the method used to calculate the AUC. An AUC/MIC of 400 in children correlated to a trough concentration of 11 mg/L using a trapezoidal Method to calculate AUC.
Keywords: area under curve, child, microbial sensitivity tests, pharmacokinetics, staphylococcus aureus, therapeutic drug monitoring, vancomycin
Introduction
Vancomycin, an antibiotic indicated for methicillin-resistant Staphylococcus aureus (MRSA) infections,1 is commonly used for serious infections such as meningitis, osteomyelitis, endocarditis, bacteremia, hospital-acquired pneumonia, and severe skin and soft tissue infections. The Clinical Practice Guidelines by the Infectious Diseases Society of America for the Treatment of MRSA infections in adults and children recommend targeting vancomycin serum trough concentrations of 15 to 20 mg/L for serious infections. These recommendations for higher troughs for the pediatric population were extrapolated from adult studies.2
The area under the curve (AUC) over 24 hours/minimum inhibitory concentration (MIC) of ≥ 400 best predicts the efficacy of vancomycin, and a trough vancomycin serum concentration between 15 and 20 mg/L has been shown to achieve an AUC/MIC ≥ 400 when the MIC is ≤ 1 in adult patients.1,3 The Infectious Diseases Society of America guidelines recommend vancomycin dosing of 15 mg/kg every 6 hours or 60 mg/kg/day for pediatric patients with serious infection.2 However, these dosing recommendations can lead to subtherapeutic trough concentrations, and doses of 70 to 85 mg/kg/day may be needed to achieve target vancomycin serum trough concentrations of 15 to 20 mg/L.4,5
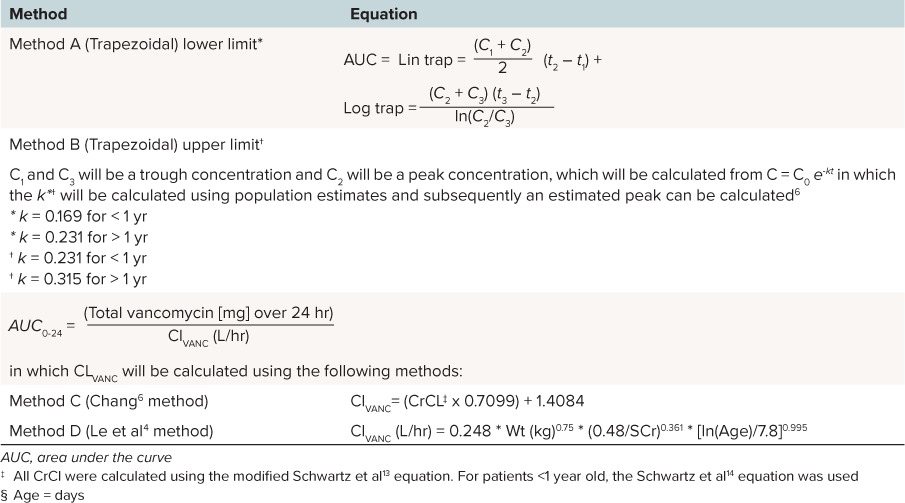
Several different methods have been used to calculate an AUC for vancomycin. In the first method, the AUC can be calculated with the trapezoidal rule using two vancomycin serum concentrations. The Chang6 and Le et al4 methods, which are pediatric-specific methods, use total daily dose of vancomycin divided by the vancomycin clearance; however, each method defines vancomycin clearance differently. In practice, the Chang6 and Le et al4 methods are easier to implement and do not require additional vancomycin concentrations to be drawn. See Table 1 for the specific equations.
Table 1.
Calculation of Area Under the Serum Concentration Time Curve
Frymoyer and colleagues7 used a Monte Carlo simulation to explore the relationship between vancomycin dose, AUC/MIC ratio, and trough vancomycin serum concentration. They performed a simulation in a 25-kg child who received 15 mg/kg every 6 hours, 15 mg/kg every 8 hours, and 20 mg/kg every 8 hours using three different pharmacokinetic models. They found that an AUC/MIC > 400 corresponded to a trough vancomycin serum concentration of 7 to 10 mg/L if the MIC of MRSA is 1 for patients on 15 mg/kg every 6 hours of vancomycin. They also found that the AUC/MIC calculations were similar between the three pharmacokinetic methods. However, the question of applicability to the clinical arena remains as these were simulated data.
The primary study objectives were to assess the likelihood that 15 mg/kg of vancomycin every 6 hours will achieve an AUC/MIC > 400 in a pediatric patient with S aureus infections and to determine the trough serum vancomycin concentration associated with the calculated AUC/MIC ratio. Secondary objectives were to compare the different methods used to calculate AUC and to assess clinical outcomes relative to AUC/MIC of patients who continue on vancomycin for at least 24 hours.
Methods
Study Design and Patient Population
This was a retrospective chart review that included any pediatric patient 2 months to 18 years of age admitted to a pediatric unit at an inner city teaching hospital in Baltimore, Maryland from July 1, 2007, to August 30, 2013. Patients with a blood culture positive for S aureus who received at least two doses of vancomycin and had a corresponding trough vancomycin serum concentration were included. Patients were excluded if they were on dialysis or had serum creatinine values outside of the normal range per age8 or trough concentrations drawn more than 1 hour before the next the dose of vancomycin. General practice at the hospital during this time was for prescribers to empirically dose patients on vancomycin.
Patients were divided into two groups based on their initial regimen of vancomycin: group 1 received doses of vancomycin ≥ 15 mg/kg every 6 hours, while group 2 received < 15 mg/kg every 6 hours or received vancomycin at ≥ 15 mg/kg at other dosing intervals such as every 8 or 12 hours. Vancomycin MIC values were measured using specimens that were banked by E-test (Biomeriux, Durham, NC). Analysis followed the criteria of Clinical and Laboratory Standards Institute and conducted by two trained personnel in a single laboratory.9 In cases when more than one sample per subject had been stored, the first sample was used for analysis. This study qualified as exempt by the University of Maryland Institutional Review Board.
Data Collection
Data collection included patient demographics (i.e., sex, race, age, weight, and height), medical history, admission diagnosis, admitting unit, laboratory data throughout their course (i.e., serum creatinine, blood culture results, including organism and MIC), vancomycin administration information (i.e., doses, dosing intervals, infusion times), and concomitant use of other nephrotoxic medications. Trough vancomycin serum concentrations were assayed by the clinical laboratory according to manufacturer specifications without modification. Reported values were obtained from the medical record.
Hospital length of stay (LOS), intensive care unit (ICU) LOS (if applicable), 30-day mortality (if applicable), time to first blood culture negative for S aureus, and vancomycin-associated adverse effects (i.e., red-man syndrome and vancomycin-associated nephrotoxicity) were collected for patients who were on vancomycin for > 24 hours. In the absence of an alternative explanation, vancomycin-associated nephrotoxicity was defined as two or three consecutively elevated serum creatinine concentrations (i.e., increase of 0.5 mg/dL or ≥ 50% increase from baseline, whichever is greater) after several days of vancomycin therapy.1
AUC Calculations
AUCs were calculated for each trough vancomycin concentration using three different pharmacokinetic methods. Method A and Method B were calculated using the trapezoidal rule.6 Methods A and B used the lower or upper limits of published elimination rate constants in pediatric patients, respectively (Table 1). Methods C and D calculated AUC using the Chang6 and Le et al4 methods, respectively.
Statistical Analysis
Descriptive statistics were used for the primary objective, and Mann-Whitney U or the Student's t-test was calculated for AUC comparisons. χ2 or Fisher's exact test was calculated for nominal data. A Pearson correlation analysis was performed, and the r2 values were used to determine correlation between calculated AUC24 and trough vancomycin serum concentrations.
Results
A total of 90 patients with MIC data were evaluated, and 36 patients were included in the study. Fifty-four patients were excluded; 30 were < 2 months of age, 16 did not receive vancomycin, and 8 had abnormal renal function. Twenty patients were in group 1 (≥ 15 mg/kg every 6 hours) with 55 corresponding troughs. Sixteen patients were in group 2 (< 15 mg/kg every 6, 8, or 12 hours) with 44 correlating troughs. The average number of trough concentrations per patient was the same in both groups (2.75). Baseline characteristics are summarized in Table 2.
Table 2.
Baseline Characteristics

The majority of patients in both groups were male (group 1: 70%, group 2: 68.75%). Patients in group 1 were slightly older and weighed more than patients in group 2. Group 2 included 4 patients who were admitted to the Shock Trauma Center compared to no patients in group 1 (p = 0.03). The most common admission diagnosis was infection, 40% in group 1 and 37.5% in group 2. The majority of isolates in group 1 (70%) were methicillin-sensitive S aureus (MSSA), while the majority in group 2 (75%) were MRSA (p = 0.01). In group 1, 50% of the S aureus isolates had vancomycin MIC > 1, while 87.5% of the isolates in group 2 had an MIC > 1 (p = 0.03).
AUC24/MIC Comparing Methods
Patients in group 1 were exposed to larger doses of vancomycin as these patients were initially treated with recommended empiric vancomycin regimens of at least 15 mg/kg every 6 hours. The median dose over the course of treatment in group 1 was 20 mg/kg every 6 hours, compared to the median dose of 15 mg/kg every 6 hours in group 2 (p < 0.001) as seen in Table 3. The median dose of vancomycin increased in both groups as these patients required increased doses of vancomycin in order to achieve higher vancomycin troughs. The median trough was higher in group 1 than group 2, 11.4 mg/L and 9.2 mg/L, respectively (p < 0.001).
Table 3.
AUC24/MIC by Method and Corresponding Trough Vancomycin Concentration

For the primary objective, in group 1, the likelihood of achieving an AUC/MIC > 400 varied from 16.4% to 90.9% based on the AUC calculation method utilized. The likelihood of achieving an AUC/MIC > 400 was lower for patients in group 2 (15.9%–54.5%) who were initially on < 15 mg/kg every 6 hours or receiving vancomycin every 8 or 12 hours. Method C (Chang6 method) yielded the lowest percentage of patients achieving an AUC/MIC > 400 in groups 1 (16.4%) and 2 (15.9%), with a median AUC/MIC ratio of 160.81 in group 1 and 54.04 in group 2. Method D (Le et al4 method) yielded the highest percentage of patients achieving an AUC/MIC > 400 in both group 1 (90.9%) and group 2 (54.4%; Table 3). Using Method D, the median AUC/MIC in group 1 was 743.29 and 457.5 in group 2.
The Figure compares the measured trough concentrations with the AUC/MIC ratio based on a 6-hour frequency interval using Method A calculations (trapezoidal lower limit of Ke method). Although Method D yielded the highest percentage of achieving an AUC/MIC > 400, Method A (trapezoidal lower limit Ke method) yielded a correlation constant closest to 1 (r2 = 0.59113). Based on the line of regression, an AUC/MIC = 400 correlates with a trough of 10.98 mg/dL. Method D (Le4 method) did not yield as high of a correlation constant (r2 = 0.23536), and an AUC/MIC = 400 corresponded to a trough of 8.41 mg/dL. For Methods B and C, the correlation constants were 0.4846 and 0.1789, respectively.
Figure.

Method A area under the curve/minimum inhibitory concentrations (AUC/MICs) and troughs based on dosing every 6 hours.
Secondary Outcomes Results
A total of 29 patients received vancomycin for at least 24 hours. Seventeen patients achieved an AUC/MIC > 400 within the first 24 hours of starting vancomycin using Method A calculation. These patients had a median shorter hospital LOS than the 13 patients (19.6 days versus 23.5 days, respectively) who had an AUC/MIC < 400; however, this was not statistically significant (p = 0.11). Eighteen patients who received vancomycin for at least 24 hours were admitted to the ICU. Eight of the 18 patients in the ICU who achieved an AUC/MIC > 400 had a shorter median ICU LOS (13.8 days) compared to the 10 patients in the ICU with an AUC/MIC < 400 and median ICU LOS of 15.6 days, although this was not statistically significant (p = 0.41; Table 4). There was no significant difference in time to first negative blood culture between the two groups; however, there was a trend that group 1 achieved a negative blood culture about 1 day faster (p = 0.36). There were no incidents of vancomycin-associated nephrotoxicity or red man syndrome in either group.
Table 4.
Clinical Outcomes of Patients on Vancomycin > 24 hours Using AUC/MIC Calculated per Method A

Discussion
Unlike a previously published article,7 our data use actual patient trough concentrations and MIC isolates, not simulated data. Also, we report the clinical outcomes and adverse effects for these patients. In this study, the likelihood of achieving an AUC/MIC > 400 varied from 16.4% to 90.9% for patients receiving ≥ 15 mg/kg every 6 hours of vancomycin depending on the method used to calculate the AUC/MIC ratio. Method D (Le et al4) had the highest percentage of patients achieving an AUC/MIC > 400 (90.9%). The correlation coefficient (r2) comparing AUC/MIC to trough concentrations from Method A had the highest correlation, r2 = 0.59, versus the other methods, which indicates this method is the most accurate if trough concentrations are being used. The calculated trough for an AUC/MIC = 400 was about 11 mg/dL using Method A.
Le and colleagues4 used a Monte Carlo simulation to determine corresponding trough concentrations for an AUC/MIC ≥ 400 and found the corresponding trough concentration to be about 9 mg/L. The authors stated that patients younger than 2 years of age would empirically need 70 mg/kg/day of vancomycin in order to have a higher probability of achieving an AUC/MIC > 400.4 One limitation of the study by Le and colleagues4 is that different dosing intervals were included, which may have caused the vancomycin troughs to be low. If a patient is given the same total daily dose of vancomycin, but the medication is given less frequently, the trough concentration will be lower but the AUC will still be the same. Similarly, in our study, patients in group 2, who had a lower likelihood of achieving an AUC/MIC > 400, were younger and many were < 2 years of age. These patients were receiving low doses and/or less frequent dosing (initially, none of the patients in group 2 received the recommended dose of 60 mg/kg/day). In addition, more of the isolates in group 2 had a vancomycin MIC > 1, which would require higher doses of vancomycin. All of these factors contribute to the difficulty in achieving an AUC/MIC > 400.
The Frymoyer et al7 study compared AUC/MIC calculations using the Lamarre et al,10 Wrishko et al,11 and Chang6 methods and found that the AUC/MIC ratios were similar between the different calculation methods. The Chang6 method is based on pediatric oncology patients' creatinine clearance and total daily vancomycin dose. Since serum creatinine is not the best estimate of renal clearance in children and is not predictable in the pediatric population,12 the Chang6 method may not be preferred. The Wrishko et al11 method is derived from using linear and logarithmic trapezoidal rules.
In our study, the AUC/MIC ratio calculations differed between calculation methods when using actual patient data. Methods A and B utilize the trapezoidal method, which uses a fundamental mathematical equation to calculate an AUC. Methods C and D were developed from Monte Carlo simulations but do not use vancomycin concentrations.4,6 The AUC/MIC of 400 using Method A (trapezoidal lower limit Ke method)9 correlated to a trough concentration of 10.98 mg/L, while the Method D AUC/MIC of 400 correlated to a trough of 8.41 mg/L. Both of these trough concentrations are similar to the 9 mg/L that was reported by Le and colleagues.4 In our study, the correlated trough calculated is most likely higher due to the number of patients with an MIC > 1. Although Method D yielded the highest percentage of patients achieving an AUC/MIC > 400, the correlation coefficient (r2 = 0.24) was lower than for Method A (r2 = 0.59). Method A correlated best with trough concentrations, which seems likely since Method A requires trough concentrations for the calculation, while Methods C and D do not. In practice if patients have only one trough concentration, Method A should be used to estimate the AUC. Both Methods A and B (trapezoidal methods) in our study used population estimates to calculate a peak concentration in order to calculate an AUC. This method can also be easily utilized in practice if two concentrations are drawn, ideally a peak and trough. Additional studies using a patient's individualized elimination rate constant and volume of distribution are needed in order to validate a method to accurately calculate an AUC/MIC ratio.
Frymoyer and colleagues7 found that an AUC/MIC > 400 corresponded to a trough concentration of 7 to 10 mg/L when the MIC is 1 for MRSA in patients receiving vancomycin 15 mg/kg every 6 hours. These data agree with our data and further support the idea that higher target troughs vancomycin serum concentrations of 15 to 20 mg/L in the pediatric population may not be necessary. For pediatric patients to achieve troughs of 15 to 20 mg/L, they will require large doses of vancomycin, which may lead to increased adverse effects.6
There is a lack of outcome data available for the pediatric population with regards to achieving an AUC/MIC > 400. In the 29 patients included in the outcomes analysis, hospital and ICU LOS were numerically shorter in the patients who achieved an AUC/MIC > 400 although no outcomes reached statistical significance. The patients in group 1 achieved a negative blood culture a median of 1 day sooner compared to patients in group 2. More studies are needed to determine if AUC/MIC > 400 impacts outcomes in pediatric patients.
Limitations
Limitations include the small population size and the retrospective nature of this study. Several patients had their first vancomycin trough concentration drawn before their third dose of vancomycin, which was assumed to be steady state. Only one patient had two random drug concentrations drawn to calculate the patient's individual elimination constant. Population values were used for the patients' elimination constants for Methods A and B.
Conclusion
In conclusion, the likelihood of achieving an AUC/MIC > 400 varies widely based on the method used to calculate AUC and is more likely to occur with empiric vancomycin doses of 15 mg/kg every 6 hours. Although not statistically significant, the patients who achieved an AUC/MIC > 400 did have a shorter ICU and hospital LOS along with a faster time to first negative blood culture. Since Method A yielded the highest correlation coefficient when comparing AUC/MIC to trough concentration, this method may be most appropriate to utilize when calculating an AUC/MIC concentration. It is also a method that can be performed with current vancomycin practices. In this study, an AUC/MIC of 400 correlated to a trough of 11 mg/L.
Acknowledgment
Platform presentation at Pediatric Pharmacy Advocacy Group Annual Meeting in Nashville, Tennessee, in May 2014.
Abbreviations
- AUC
area under the curve
- ICU
intensive care unit
- LOS
length of stay
- MIC
minimum inhibitory concentration
- MRSA
methicillin-resistant Staphylococcus aureus
- MSSA
methicillin-sensitive Staphylococcus aureus
Footnotes
Disclosure The authors declare no conflicts or financial interest in any product or service mentioned in the manuscript, including grants, equipment, medications, employment, gifts, and honoraria. The authors had full access to all the data in the study and take responsibility for the integrity of the data and the accuracy of the data analysis.
Copyright Published by the Pediatric Pharmacy Advocacy Group. All rights reserved. For permissions, email: matthew.helms@ppag.org.
REFERENCES
- 1. Rybak M, Lomaestro B, Rotschafer JC, . et al. Therapeutic monitoring of vancomycin in adult patients: a consensus review of the American Society of Health-System Pharmacists, the Infectious Diseases Society of America, and the Society of Infectious Diseases Pharmacists. Am J Health Syst Pharm. 2009; 66( 1): 82– 98. [DOI] [PubMed] [Google Scholar]
- 2. Liu C, Bayer A, Cosgrove SE, . et al. Clinical practice guidelines by the Infectious Diseases Society of America for the treatment of methicillin-resistant Staphylococcus aureus infections in adults and children: executive summary. Clin Infec Dis. 2011; 52( 3): 285– 292. [DOI] [PubMed] [Google Scholar]
- 3. Moise-Broder PA, Forrest A, Birmingham MC, . et al. Pharmacodynamics of vancomycin and other antimicrobials in patients with Staphylococcus aureus lower respiratory tract infections. Clin Pharmacokinet. 2004; 43( 13): 925– 942. [DOI] [PubMed] [Google Scholar]
- 4. Le J, Bradley JS, Murray W, . et al. Improved vancomycin dosing in children using area under the curve exposure. Pediatr Infect Dis J. 2013; 32( 4): e155– 163. [DOI] [PMC free article] [PubMed] [Google Scholar]
- 5. Eiland LS, English TM, Eiland EH 3rd. . Assessment of vancomycin dosing and subsequent serum concentrations in pediatric patients. Ann Pharmacother. 2011; 45( 5): 582– 589. [DOI] [PubMed] [Google Scholar]
- 6. Chang D. Influence of malignancy on the pharmacokinetics of vancomycin in infants and children. Pediatr Infect Dis J. 1995; 14( 8): 667– 673. [DOI] [PubMed] [Google Scholar]
- 7. Frymoyer A, Guglielmo BJ, Hersh AL.. Desired vancomycin trough serum concentration for treating invasive methicillin-resistant Staphylococcal infections. Pediatr Infect Dis J. 2013; 32( 10): 1077– 1079. [DOI] [PubMed] [Google Scholar]
- 8. Rodvold KA, Everett JA, Pryka RD, . et al. Pharmacokinetics and administration regimens of vancomycin in neonates, infants and children. Clin Pharmacokinet. 1997; 33( 1): 32– 51. [DOI] [PubMed] [Google Scholar]
- 9. Clinical Laboratory and Standards Institute (CLSI). . Methods for Dilution Antimicrobial Susceptibility Tests for Bacteria That Grow Aerobically: Approved Standard. 8th ed. CLSI document M07-A8 Wayne, PA: CLSI; 2009. [Google Scholar]
- 10. Lamarre P, Lebel D, Ducharme MP.. A population pharmacokinetic model for vancomycin in pediatric patients and its predictive value in a naive population. Antimicrob Agents Chemother. 2000; 44( 2): 278– 282. [DOI] [PMC free article] [PubMed] [Google Scholar]
- 11. Wrishko RE, Levine M, Khoo D, . et al. Vancomycin pharmacokinetics and Bayesian estimation in pediatric patients. Ther Drug Monit. 2000; 22( 5): 522– 531. [DOI] [PubMed] [Google Scholar]
- 12. Gao A, Cachat F, Faouzi M, . et al. Comparison of the glomerular filtration rate in children by the new revised Schwartz formula and a new generalized formula. Kidney Int. 2013; 83( 3): 524– 530. [DOI] [PubMed] [Google Scholar]
- 13. Schwartz GJ, Work DF.. Measurement and estimation of GFR in children and adolescents. J Am Soc Nephrol. 2009; 4( 11): 1832– 643. [DOI] [PubMed] [Google Scholar]
- 14. Schwartz GJ, Feld LG, Langford DJ.. A simple estimated of glomerular filtration rate in full-term infants during the first year of life. J Pediatr. 1984; 104( 6): 849– 54. [DOI] [PubMed] [Google Scholar]