Abstract
An understanding of the articular cartilage degenerative process is necessary for the prevention and treatment of joint disease. The present study aimed to examine how long‐term immobilization‐induced cartilage degeneration is aggravated by remobilization. Sixty 8‐week‐old male Wistar rats were used in this study. The unilateral knee joint was immobilized using an external fixator for 8 weeks. The rats were killed at 0 and 3 days, and at 1, 2, 4 and 8 weeks after removing the fixator. After the rats were killed, the maximum knee extension angles were measured. Histological sections at the medial mid‐condylar region (non‐contact, transitional and contact regions of the femur and tibia) were prepared and scored. The cartilage thickness and number of chondrocytes were measured, and CD44 and Col2‐3/4c expression levels were assessed immunohistochemically. The histological assessment revealed progressive aggravation of cartilage degeneration in the transitional region, with a decreased number of chondrocytes and CD44‐positive chondrocytes as well as poor scoring over time, particularly in the tibia. Cyst formation was confirmed in the transitional region of the tibia at 8 weeks post‐remobilization. The cartilage thickness in the transitional region was thicker than that in the contact region, particularly in the tibia. Col2‐3/4c expression was observed in the non‐contact and transitional regions, and the knee extension angle was recovered. In conclusion, immobilization‐induced cartilage degeneration was aggravated by remobilization over time in the transitional region, followed by observations of a decreased number of chondrocytes and morphological disparity between different cartilage regions.
Keywords: aggravation, cartilage, cyst, degeneration, immobilization, remobilization
Introduction
Joint immobilization can be induced by various conditions. For example, this condition occurs after disuse resulting from spinal cord injury (McCarthy & Oakley, 2002; Moriyama et al. 2004), articular cartilage deformities in rheumatoid and osteoarthritic knees (Waugh et al. 1980), or treatment with an external fixator (Balci et al. 2014). Joint immobilization causes decreased mobility and functional impairment consequent to the degeneration of joint structures, such as articular cartilage, or restriction of the range of joint motion (ROM). Remobilization is one approach used to prevent or reduce this degeneration (Kunz et al. 2014). The articular cartilage consists of chondrocytes embedded in abundant extracellular matrix (ECM); this tissue is hypovascular and thus has the lowest potential for restoration. Various pathological processes are involved in cartilage degeneration. In post‐traumatic osteoarthritis, excessive loading stresses induce the release of inflammatory mediators in the synovium and by chondrocytes, causing cartilage degeneration and chondrocyte and osteocyte death (Dare & Rodeo, 2014; Racine & Aaron, 2014). Osteochondrosis, which is caused by the formation of clefts through the cartilage and into the subchondral bone (McCoy et al. 2013), can also occur. Thus, an understanding of the processes underlying cartilage degeneration is necessary for the development of strategies used to prevent and treat joint diseases (Vanwanseele et al. 2002; Hagiwara et al. 2009).
Previous studies of the effects of joint immobilization on cartilage structures in immobilized rat models have reported the following changes: decreases in the number of chondrocytes (Trudel et al. 2005; Hagiwara et al. 2009) and cartilage ECM (Jortikka et al. 1997; Hagiwara et al. 2010), changes in cartilage thickness (Trudel et al. 2005; Hagiwara et al. 2009), upregulation of destructive factors in the ECM (Ando et al. 2009; Leong et al. 2010), and cartilage surface alterations (Nagai et al. 2015). Because of the different patterns of mechanical stress, these degenerative effects differ according to the assessed region, which might include the contact region (area of contact between the cartilage of two bones when the knee joint is immobilized by a fixator and weighted), non‐contact region (area where the cartilage of two bones is not in contact when the knee joint is immobilized by a fixator and weighted) and transitional region (region between the contact and non‐contact regions; Vanwanseele et al. 2002; Trudel et al. 2005; Hagiwara et al. 2009, 2010). Thus, the degenerative pattern observed with regard to the ECM or chondrocytes differs depending on the assessment region or weighting condition.
Previous reports investigated the effects of remobilization on joint structures, the capsule or motion (Hildebrand et al. 2004; Usuba et al. 2007; Matsuzaki et al. 2013), and cartilage (Akeson et al. 1977; Haapala et al. 1999; Ando et al. 2011) after immobilization. Ando et al. studied the post‐remobilization reversibility of the effects on cartilage induced by short‐term immobilization using an external fixator. One of the studies reported that although the atrophic changes resulting from decreased mechanical stress in the non‐contact region were reversible, the loss of chondrocytes and hypertrophic chondrocytes in the contact and transitional regions resulting from increased mechanical stress were irreversible after immobilization (Ando et al. 2011). However, no previous reports have described the irreversible histological processes in cartilage that are induced by long‐term immobilization.
The purpose of this study was to examine the effect of remobilization on cartilage degeneration induced by long‐term knee joint immobilization in a rat model with regard to different regions and time intervals. It was hypothesized that the immobilization‐induced cartilage degeneration in both the contact and transitional regions would be aggravated.
Materials and methods
Sample preparation and surgical procedure
The experimental design of this study was approved by the College Animal Research Committee. Sixty 8‐week‐old male Wistar rats (body weight: 170–217 g) were used in this study. The left knee joints of the rats in the experimental group were immobilized for 8 weeks at 140 ± 5 ° of knee flexion, using Kirschner wire and resin according to a previously described method (Nagai et al. 2014). The left knee joints of rats in the control group were subjected to sham surgery and remained freely movable postoperatively. Thereafter, external fixators or wires used in the sham surgery were removed at the end of 8 weeks. The rats were killed at 0 and 3 days, and at 1, 2, 4 and 8 weeks (n = 5/time period) after removing the fixator. In the 0‐day group, histological alterations were assessed at the end of the 8‐week immobilization period and designated as the baseline.
The animals were maintained in plastic cages in environmentally controlled rooms, and were provided rat chow and water ad libitum.
Maximum knee extension angle analysis
After an experimental period, the animals were killed under anesthesia with intraperitoneal nembutal and exsanguination. An angle analysis was subsequently performed in all animals except for the 0‐day group. The ROM was defined as the angle (0–180 °) between a straight line connecting the greater trochanter and caput fibulae to a line connecting the caput fibulae and lateral malleolus, with the hip joint at 90 ° of flexion. The maximum knee extension was defined as 180 °. The maximum knee extension angle was measured in intact limbs according to previously described methods (Nagai et al. 2014).
Histological assessment
After the knee extension angle analysis, the knees were removed, fixed with 4% paraformaldehyde and decalcified in 10% ethylenediaminetetraacetic acid (EDTA). Decalcified specimens were subsequently embedded in paraffin. Six‐micrometer sections were obtained at the medial mid‐condylar region of the knee in the sagittal plane and were alternately stained with hematoxylin and eosin (HE) and safranin O (SO). At least five tissue sections per animal were stained with each staining agent. In all sections, hypocellular areas in the contact region were selected for histological analysis by a single trained observer. The six regions (non‐contact, transitional and contact regions in the femur and tibia; Fig. 1) were evaluated on slides as previously described (Ando et al. 2008; Hagiwara et al. 2009; Nagai et al. 2015). Light microscopic images were captured in each region (original magnification, 200 ×). The images from each sample were quantified using the imagej software program (US National Institutes of Health, Bethesda, MD, USA).
Figure 1.
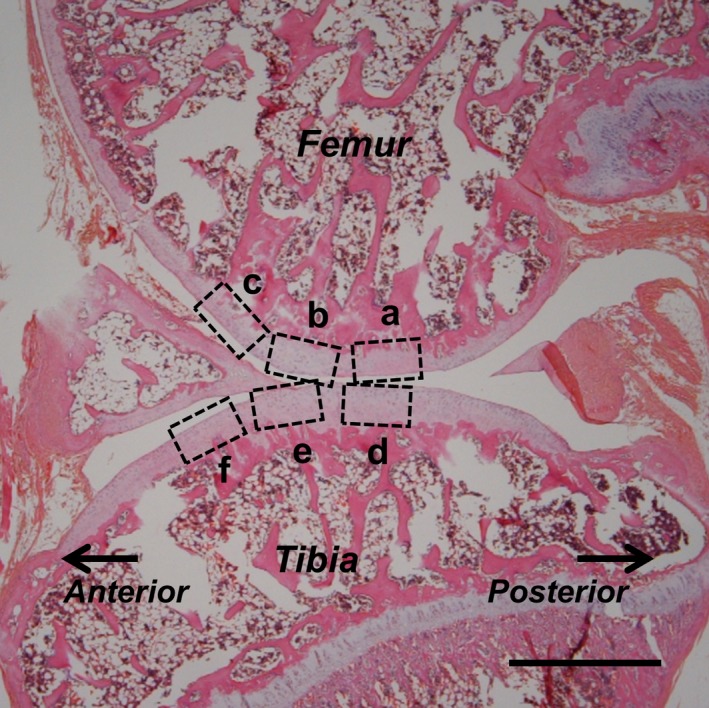
Regions of assessment used in the histological imaging of sagittal sections (stained with HE after 8 weeks of immobilization) of the knee at the femur (a–c) and tibia (d–f), representing the contact (a, d), transitional (b, e) and non‐contact regions (c, f). Scale bar: 1 mm.
Assessment regions
Cartilage degeneration and effects on cartilage thickness are more evident on the medial side than in the lateral compartment after immobilization (Jurvelin et al. 1986; Haapala et al. 1999). Thus, only the medial side of the knee joint was assessed. Six cartilage regions were evaluated. The contact region of the femur (Fig. 1a) is the dominant weight‐bearing region of the femur and is located at apposed regions when the knee is flexed to 140 ° (consistent with the angle of immobilization). The contact region of the tibia (Fig. 1d) is the weight‐bearing surface of the tibia and is distributed across the surface of the femur when the knee is flexed to 140 °. During the histological examination, hypocellularity was observed in the contact region after the 8‐week immobilization (Fig. 3b). The transitional region includes both the femur (Fig. 1b) and tibial sides (Fig. 1e), which are located 0.5 ± 0.1 mm anterior to the centers of the respective contact regions. The transitional regions were defined as previously described (Nagai et al. 2015). Morphologically, this region referred to the distance from the centers of the contact regions to the formation of a convex shape around the centers of the contact regions. The non‐contact regions of the femur (Fig. 1c) and tibia (Fig. 1f) are located 0.5 ± 0.1 mm anterior to the centers of the respective transitional regions.
Figure 3.
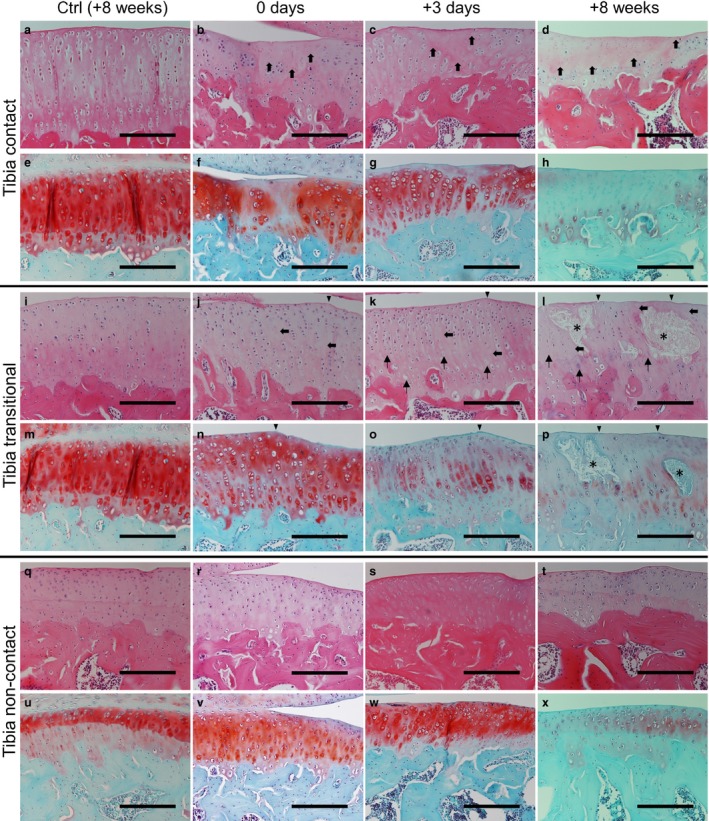
Histological changes in the tibia at 8 weeks in the control group (HE: a, i and q; SO: e, m and u) and at 0 days (HE: b, j and r; SO: f, n and v), 3 days (HE: c, k and s; SO: g, o and w) and 8 weeks (HE: d, l and t; SO: h, p and x) in the experimental group. After immobilization, hypocellularity was observed in the surface‐to‐middle layers in the contact regions (b; bold arrows). Slight surface irregularities (arrowhead) and hypocellularity (bold arrows) were observed in the transitional region (j), whereas only hypertrophic chondrocytes were observed in the non‐contact region (r). SO staining intensity was reduced in all regions (f, n and v). After the remobilization period, hypocellularity (c, d, k and l; bold arrows) and reduced SO staining intensity (g, h, o and p) were observed over time in both the contact and transitional regions. The presence of chondrocytic lacunae with pyknotic or absent nuclei and cell degeneration over time were confirmed in the transitional regions of the experimental group (k and l; arrows). Cyst formation (asterisks) was observed frequently in the transitional region of the tibia at 8 weeks (l and p). Hypertrophic chondrocytes were observed in the non‐contact region throughout the experimental period (s and t). Low SO staining intensity was also observed in the non‐contact region (w and x). Scale bars: 200 μm.
Histological grading
The modified Mankin histological grading scheme (Ando et al. 2008, 2011; Hagiwara et al. 2009) was used to evaluate articular cartilage degeneration. The grading scheme consisted of five items (I: structure; II‐1: cell‐tangential zone; II‐2: cell‐transitional and radial zone; III: SO staining; IV: tidemark; V: pannus formation), and each item was graded as follows: I, 0–10; II‐1, 0–2; II‐2, 0–10; III, 0–4; IV, 0–3; and V, 0–3. A high score indicated cartilage degeneration.
Cartilage thickness
Cartilage thickness was defined as the distance between the cartilage surface and the osteochondral junction. At each site, a 400‐μm‐long span of the cartilage surface was defined, and the area of cartilage within this span was measured. The average cartilage thickness was calculated by dividing this area by its width. Areas of non‐cartilaginous tissue, such as bone and bone marrow, were removed.
Number of chondrocytes
To determine the number of chondrocytes, cells within rectangles with a depth of 100 μm and length of 400 μm from the surface in each image were quantified manually. The presence of chondrocytic lacunae with pyknotic or absent nuclei was interpreted as chondrocyte death (apoptosis or necrosis); these were excluded from the quantification.
Immunohistochemistry
Immunohistochemical staining was performed to determine the expression levels of Col2‐3/4c and CD44. Immunohistochemical staining for Col2‐3/4c expression (kindly donated by Dr A.R. Poole) – specifically for the cleavage of native type II collagen by mammalian collagenases – was performed according to previously described methods (Stoop et al. 2001). The hyaluronan receptor CD44 is expressed on chondrocytes. Tissue sections intended for CD44 staining were deparaffinized and immersed in 3% H2O2 in phosphate‐buffered saline (PBS). These sections were then treated with 1% trypsin in PBS, followed by incubation with 5% normal goat serum. Subsequently, tissue sections were incubated with an antibody specific for CD44 antibody (ab65829, 1 : 200 dilution; Abcam, Cambridge, UK) and subsequently rinsed with PBS, before treatment with a biotinylated rabbit anti‐rat IgG secondary antibody (1 : 200 dilution) and further analyzed using the Elite ABC kit (1 : 100 dilution; Vector Laboratories, Burlingame, CA, USA). Immunoreactivity was visualized with a diaminobenzidine solution, followed by counterstaining with hematoxylin. Tissue sections from all time points and controls were stained simultaneously for CD44 or Col2‐3/4c to ensure consistent staining between the animals. CD44‐positive cells and Col2‐3/4c‐positive staining were determined qualitatively by a single trained observer. CD44 positivity was confirmed to indicate chondrocytes in almost all cartilage layers, using tissue sections from normal rats. The observer confirmed the depth of the cartilage layer where the chondrocytes were present. Col2‐3/4c positivity was confirmed using tissue sections from an osteoarthritis rat model as a positive control, and tissue sections from normal rats as a negative control. The highest intensity of Col2‐3/4c expression was defined as heavy cartilage degeneration in positive control sections, and lowest intensity of Col2‐3/4c expression was defined in the negative control sections: there was no staining intensity. Both results were confirmed by all of the authors.
Statistical analysis
All data are presented as the mean ± standard deviation. The software program jmp11 (SAS Institute, Cary, NC, USA) was used for the statistical analysis. Regarding histological grading, differences between the experimental and control groups at each time point were determined using the Mann–Whitney U‐test. The Kruskal–Wallis and Steel–Dwass post hoc tests were used to determine differences between the time points. For the other results, differences between the experimental and control groups were determined using repeated two‐way analysis of variance (anova). Differences between the experimental and control groups at each time point were determined using the unpaired t‐test. Differences between time periods were determined using one‐way anova and the Tukey–Kramer test.
Results
Maximum knee extension angle analysis
The angles did not change significantly in the control animals. Although the angles in the experimental group recovered rapidly (after 1 week), no significant differences were observed except when the 2‐ and 8‐week animals were compared with the 3‐day animals (Fig. 2; §P < 0.05). The angles were significantly higher in the control group than in the experimental group throughout the experimental period. Thus, an 8‐week recovery period did not fully restore the animals’ restricted ROM to a normal state.
Figure 2.
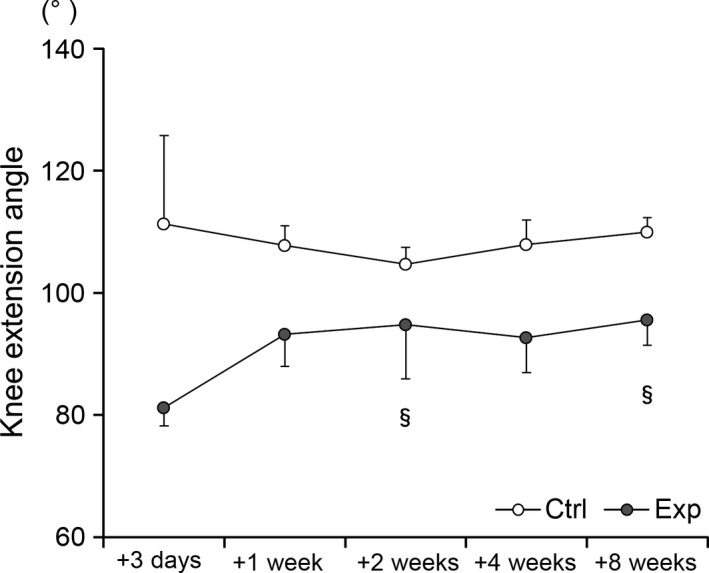
Significant recovery of the maximum extension angle of the knee after 2 and 8 weeks of remobilization in the experimental group (§ P < 0.05, comparison with the angle after 3 days). The results of the control group (ctrl) are indicated by white circles; those of the experimental group (exp) are indicated by gray circles.
Histological assessment
Throughout the experimental period, similar histological changes were observed in the cartilage of the femur and tibia. No degeneration, such as erosion and hypocellularity, was evident in the control group (Fig. 3a,i,q), and these samples appeared to be well stained with SO in all regions and at all time points (Fig. 3e,m,u). After immobilization, hypocellularity was observed in the surface and middle layers of the contact regions (Fig. 3b; bold arrows). Marked degeneration was observed in the contact region. Slight surface irregularities (arrowhead) and hypocellularity (bold arrows) were observed in the transitional region (Fig. 3j), whereas only hypertrophic chondrocytes were observed in the non‐contact region (Fig. 3r). Compared with the control group, the SO staining intensity was reduced in both the contact and transitional regions (Fig. 3f,n), and slightly reduced in the non‐contact regions (Fig. 3v). After the remobilization period, increased hypocellularity (Fig. 3c,d,k,l; bold arrows) and decreased SO staining intensity (Fig. 3g,h,o,p) were observed over time in both the contact and transitional regions. In the transitional region, surface irregularities (arrowheads), the presence of chondrocytic lacunae with pyknotic or absent nuclei (arrows), and cyst formation (asterisks) were observed in the cartilage over time. Cyst formation was observed frequently in the tibia (3/5 preparations; Fig. 3l,p) at 8 weeks. In the non‐contact region, the presence of hypertrophic chondrocytes (Fig. 3s,t) and low SO staining intensity over time was confirmed, particularly in the calcified cartilage (Fig. 3w,x).
Histological grading
The scores were significantly higher in the experimental groups than in the control group for all regions throughout the experimental period (Fig. 4). The scores for the contact regions were the highest among all scores for all other regions in the same bone, except the transitional region of the tibia at 8 weeks. The score for the transitional region of the tibia increased over time in the experimental group after 2 weeks. However, no significant difference was observed between the time points in any region in both the control and experimental groups. The significant differences between the control and experimental groups in terms of the score at the same time points are shown in Fig. 4 (**P < 0.01, *P < 0.05).
Figure 4.
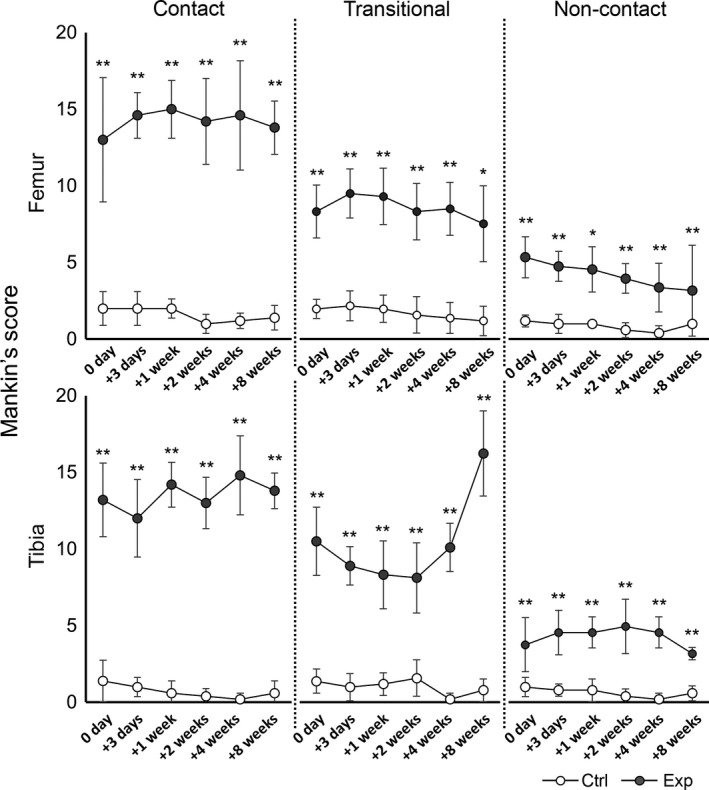
Time course of changes in the modified Mankin scores of the femur (upper row) and tibia (lower row). The results of the control group (ctrl) are indicated by white circles; those of the experimental group (exp) are indicated by gray circles. In the experimental group, the scores in all regions increased more significantly than those in the control group (**P < 0.01, *P < 0.05). At the transitional region of the tibia, the score was increased after 2 weeks. However, no significant differences were observed between time points.
Cartilage thickness
No significant difference in cartilage thickness was observed between the time points in any region in both the control and experimental groups. In a comparison of the transitional region of the femur and the tibial contact regions, significant differences were observed between the two groups (Fig. 5; transitional region of the femur: P < 0.05; contact region of the tibia: P < 0.01). On the same bone, the thickness in the transitional region was greater than in the contact region in the experimental group. Although no remarkable differences were observed between regions in the same bone in the control group, the thickness in the transitional region of the tibia was nearly 1.5‐fold thicker than that in the contact region throughout the experimental period. Significant differences in cartilage thickness between the control and experimental groups at the same time point are shown in Fig. 5 (**P < 0.01, *P < 0.05).
Figure 5.
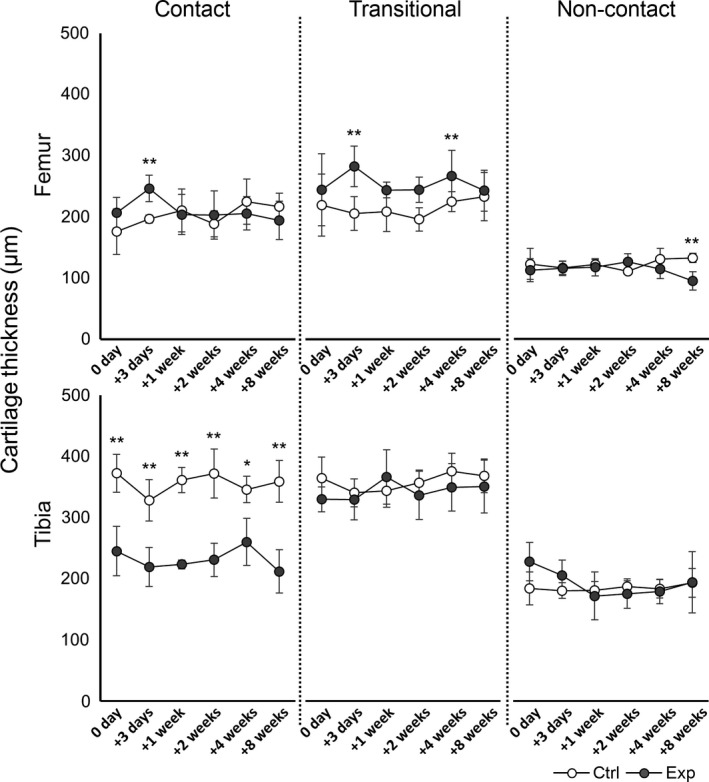
The time course of changes in cartilage thickness in the femur (upper row) and tibia (lower row). The results of the control group (ctrl) are indicated by white circles; those of the experimental group (exp) are indicated by gray circles. In the experimental group, differences in the transitional region of the femur and contact region of the tibia were more significant than those in the control group. In the experimental group, the thickness in the transitional regions was greater than that in the contact regions in the same bone, particularly the tibia, throughout the experimental period. Significant differences in cartilage thickness between the control and experimental groups at the same time point are indicated (**P < 0.01, *P < 0.05).
Number of chondrocytes
No significant differences in the numbers of chondrocytes were observed between the time points in any region in the control group. In comparison, in the experimental group, the number of chondrocytes decreased significantly compared with the control group in all regions except the non‐contact region of the femur throughout the experimental period (Fig. 6, P < 0.05). In the transitional region of the tibia, the average value in the experimental group was similar to that in the control group at the 2‐week time point. However, the number of chondrocytes was significantly reduced at 8 weeks compared with the number of chondrocytes at 0 and 3 days, and 1 and 2 weeks (Fig. 6; §8 weeks vs. 0 day, and 1 and 2 weeks: P < 0.01; 8 weeks vs. 3 days: P < 0.05). Fewer chondrocytes were observed in the contact regions compared with the number of chondrocytes in other regions in the same bone, except the transitional region of the tibia at 8 weeks. Significant differences between the control and experimental groups in terms of the numbers of chondrocytes at the same time points are shown in Fig. 6 (**P < 0.01, *P < 0.05).
Figure 6.
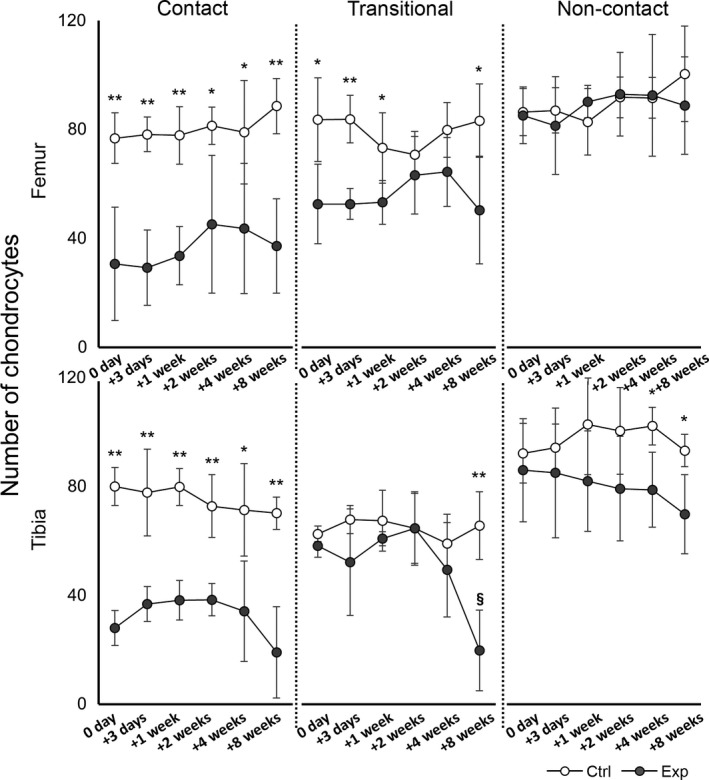
Time course of changes in the number of chondrocytes in the femur (upper row) and tibia (lower row). The results of the control group (ctrl) are indicated by white circles; those of the experimental groups (exp) are indicated by gray circles. In the experimental group, the number of cells decreased significantly in all regions except the non‐contact region of the femur (P < 0.05). In the transitional region of the tibia, the number of cells at 8 weeks was significantly lower than the number at 0 and 3 days, and 1 and 2 weeks (§ P < 0.05). Significant differences in the number of chondrocytes between the control and experimental groups at the same time point are indicated (**P < 0.01, *P < 0.05).
Immunohistochemistry
Similar immunohistochemical changes were observed in cartilage from both the femur and tibia throughout the experimental period.
Col2‐3/4c expression
In the control groups, Col2‐3/4c staining was absent in the middle‐to‐deep layers of cartilage in all regions throughout the experimental period (Fig. 7a,e,i at 8 weeks; data from other time points are not shown). After 8 weeks of immobilization, slight staining intensity was observed in all regions of experimental group cartilage at 0 days (Fig. 7b,f,j). After the remobilization period, 3 days to 8 weeks in the experimental group, slight staining intensity was observed in the contact region and the periphery of enucleated chondrocytes over time, particularly at 8 weeks (Fig. 7d). In contrast, increased intensity was observed in the cytoplasm of chondrocytes and the periphery of enucleated chondrocytes in nearly all cartilage layers in all regions at 3 days (Fig. 7c,g,k). The intensity at 3 days was stronger than that at 0 days, and was maintained in the transitional and non‐contact regions until 8 weeks (Fig. 7h,l). Increased or high levels of staining intensity were also observed within cysts (Fig. 7h).
Figure 7.
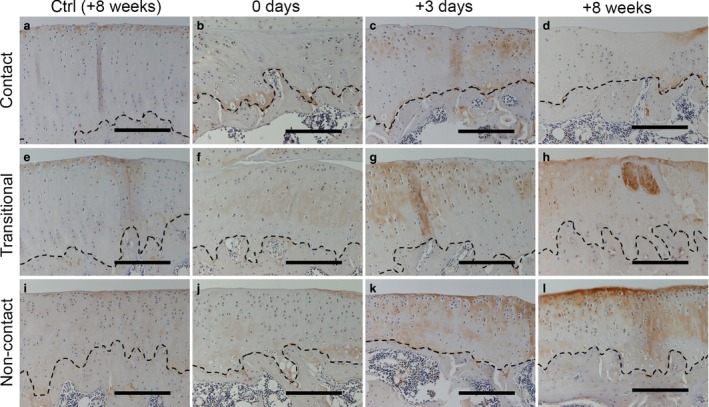
Immunohistochemical staining to detect Col2‐3/4c in the tibia at 0 days (b, f and j), 3 days (c, g and k) and 8 weeks (d, h and l) after remobilization. No staining intensity was observed in the middle‐to‐deep layer of cartilage in the control group at 8 weeks (a, e and i). Slight staining intensity was observed in the contact region throughout the experimental period (b–d). In the experimental group, positive staining intensity was observed in most layers in both the transitional (f–h) and non‐contact regions (j–l). The staining intensities at 3 days and 8 weeks were stronger than that at 0 days. The stippled lines indicate the boundary between the calcified cartilage and subchondral bone. Scale bars: 200 μm.
CD44 expression
In the control group, CD44 expression was confirmed in nearly all layers of the cartilage in all regions throughout the experimental period (Fig. 8a,e,i at 8 weeks; data from other time points are not shown). In the experimental group at 0 days after immobilization, the number of positive cells in the middle‐to‐deep layers of the cartilage were markedly decreased in the contact region (Fig. 8b; asterisks) and slightly decreased in the transitional region (Fig. 8f; asterisk). Apparent changes were not observed in the non‐contact region (Fig. 8j). After the remobilization period (3 days to 8 weeks in the experimental group), the expression appeared to decrease over time in the middle‐to‐deep layers of cartilage in the transitional region, with a notable reduction in the contact region at 8 weeks (Fig. 8c,d,g,h; asterisks). In the non‐contact region, CD44 expression was confirmed in nearly all layers of the experimental groups (Fig. 8k,l). High staining intensity was observed within cysts (Fig. 8h).
Figure 8.
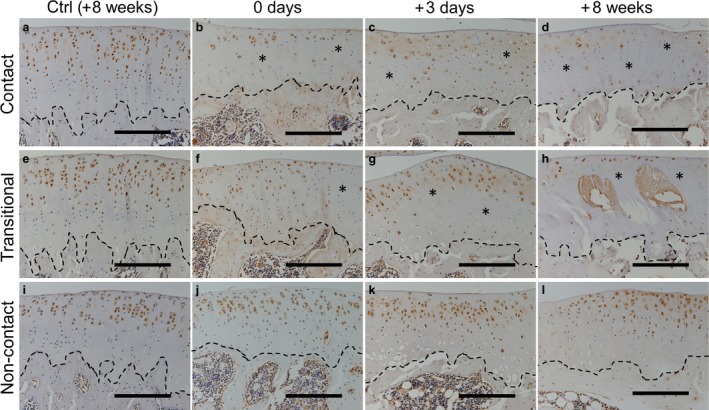
Immunohistochemical staining to detect CD44 expression in the tibia at 0 days (b, f and j), 3 days (c, g and k) and 8 weeks (d, h and l) after remobilization. Positive cells were observed in most layers of the cartilage in the control group at 8 weeks (a, e and i) and in the non‐contact region in the experimental group (j, k and l). Reduced expression (asterisks) over time was confirmed in the contact and transitional regions (b–d and f–h). The stippled lines indicate the boundary between the calcified cartilage and subchondral bone. Scale bars: 200 μm.
Discussion
This study investigated the effects of remobilization after long‐term immobilization on the ECM, hyaluronan receptor reactivity and cartilage degeneration according to regional differences. Although cartilage degeneration was induced by immobilization in all assessed regions, to the best of the authors’ knowledge this was the first report to describe an increase in cartilage degeneration induced by immobilization and aggravated by remobilization only in the transitional region.
It was hypothesized that both the contact and transitional regions would be aggravated. However, increased degeneration, characterized by cyst formation, was only observed in the transitional regions, particularly in the tibia.
Previous studies of the articular effects of immobilization for at least 8 weeks reported atrophic changes (Kiviranta et al. 1987; Haapala et al. 1999), necrosis and apoptosis (Trudel et al. 2005) of chondrocytes in the contact region as a result of increased compressive stress. Using histology, similar degenerative effects were confirmed in the contact region, as well as a reduced ability of chondrocytes to bind to hyaluronan, as indicated by the reduced expression of CD44 and the appearance of Col2‐3/4c staining in the contact and transitional regions after 8 weeks of immobilization. Because articular cartilage is avascular, no external cell supply is available to compensate for cell losses (Aigner & Kim, 2002); consistent with this finding, it is difficult to repair cartilage damage. In such cases, the degenerative effects in the contact region are believed to have already occurred by the eighth week of immobilization.
In the experimental group, a decreased number of chondrocytes and histological degeneration of the ECM were observed in the tibia transitional region at 0 days, with progression after 2 weeks. This degeneration was consistent with reported signs in previous studies (Hagiwara et al. 2009; Ando et al. 2011). Furthermore, the decreased hyaluronan‐binding ability of chondrocytes in the samples was also confirmed, based on reduced CD44 expression as well as collagen cleavage indicated by Col2‐3/4c staining throughout the experimental period, particularly after remobilization. Other studies have reported cartilage softening and surface irregularities after immobilization, particularly in the transitional region (Jurvelin et al. 1986; Trudel et al. 2003; Hagiwara et al. 2009; Nagai et al. 2015). Softened cartilage or a loss of functioning chondrocytes needed to repair and maintain the ECM will render the cartilage more vulnerable to mechanical stress (Palmoski & Brandt, 1981; Aigner & Kim, 2002). Chondrocytes are more likely to be damaged by the occurrence of matrix deformation in the context of impact injury, resulting in chondrocyte apoptosis (Borrelli et al. 1997; Chen et al. 2001; Smith et al. 2004) and brittle cartilage in the transitional region after 8 weeks of immobilization and throughout the experimental period. Regarding the cyst interiors, a high or increased Col2‐3/4c intensity might indicate a cystic characteristic. However, the possibility of an artifact due to the high CD44 staining intensity cannot be denied, as CD44 hyaluronan receptor expression could be observed around chondrocytes, rather than degenerated chondrocytes.
Interestingly, cyst formation has never been reported in previous studies of the effects of remobilization on cartilage or joint structures after immobilization. Several differences exist between previous studies and the present study. Some previous studies used a canine model of immobilization via cast fixation, in which the fixed joint was unloaded (Säämänen et al. 1990; Haapala et al. 1999). Haapala and colleagues revealed that glycosaminoglycan concentration and collagen cross‐linking were restored at most sites, except in the upper areas of uncalcified cartilage in the medial femoral and tibial condyles after remobilization (Haapala et al. 1999). Another previous study used a rat model of immobilization via external fixation, in which the fixed joint was loaded. In that study, SO staining revealed a decrease in the concentration of glycosaminoglycan in all regions throughout the experimental period in the experimental group (Hagiwara et al. 2009). However, that study failed to quantitatively investigate biochemical alterations. The above‐described finding indicated that changes in the ECM differed according to the load condition and fixation type. In addition, cartilage thickness differs between species (Ahern et al. 2009). These inter‐species differences and the load state of the knee joint might have led to dramatic histological discord in this study.
In the experimental group, the morphological characteristics in the transitional region included an increased thickness relative to the contact region, especially in the tibia, resulting in the addition of excessive mechanical stress to the transitional region with joint movement, rather than to the contact region. Non‐physiological stress, such as excessive cyclic compression, causes cartilage degeneration (Ko et al. 2013), and results from an increased release of proinflammatory and soluble mediators under abnormal conditions, such as osteoarthritis (Lee et al. 2003; Smith et al. 2004). In addition, rapid (after 1 week) recovery of the knee extension angle was confirmed. Consistent with this finding, it was proposed that fragile cartilage in the transitional region was exposed to non‐physiological stress by a wide ROM from the early phase of the remobilization period. The mechanical stress induced by remobilization and the morphological alterations after 8 weeks of immobilization in the transitional region might have contributed to additional cell death or cartilage degeneration, including cyst formation, at 8 weeks. However, whether cyst formation was responsible for the aggravated degeneration observed in the present study is unclear. Thus, further study is needed to investigate whether these alterations are accelerated by an extended remobilization period and pathological processes of aggravated degeneration, such as cyst formation.
Two limitations of this study were identified. First, the investigation of cartilage degeneration after immobilization was performed using a small sample size. With regard to the study design, the use of a larger sample size for the statistical analysis would be recommended. However, the present results and investigation of the pathological mechanisms involved in immobilization enhance the understanding of the pathology of cartilage degeneration after remobilization. Second, immature samples were used at the start of the experiment. The maturity level of samples might have affected chondrocyte degeneration during the immobilization period.
Concluding remarks
In conclusion, the present results suggest that cartilage degeneration, determined by the formation of cysts and characterized by regional morphological disparities and the decreased number of chondrocytes after immobilization, was aggravated by remobilization in the periphery of the contact region, particularly in the tibia.
Author contributions
All of the authors were involved in the study conceptualization and design, data analysis and interpretation, and approval of the final manuscript. MN, AI, JT, HI, SY and HK performed the statistical analysis and prepared a draft of the manuscript. MN, TA and HK approved the final version of the manuscript for publication. HK is the laboratory chairman and obtained funding for this study. MN performed the data collection and synthesis.
Acknowledgements
The authors would like to thank Dr A.R. Poole (McGill University, Montreal, Canada) for the generous provision of the Col2‐3/4c antibody, the use of which contributed largely to the new findings. This study was supported in part by a JSPS KAKENHI Grant‐in‐Aid for Scientific Research (A) (no. 25242055) and a JSPS KAKENHI Grant‐in‐Aid for Challenging Exploratory Research (no. 25560258).
References
- Ahern BJ, Parvizi J, Boston R, et al. (2009) Preclinical animal models in single site cartilage defect testing: a systematic review. Osteoarthritis Cartilage 17, 705–713. [DOI] [PubMed] [Google Scholar]
- Aigner T, Kim HA (2002) Apoptosis and cellular vitality: issues in osteoarthritic cartilage degeneration. Arthritis Rheum 46, 1986–1996. [DOI] [PubMed] [Google Scholar]
- Akeson WH, Woo SL, Amiel D, et al. (1977) Rapid recovery from contracture in rabbit hindlimb. A correlative biomechanical and biochemical study. Clin Orthop Relat Res 122, 359–365. [PubMed] [Google Scholar]
- Ando A, Hagiwara Y, Chimoto E, et al. (2008) Intra‐articular injection of hyaluronan diminishes loss of chondrocytes in a rat immobilized‐knee model. Tohoku J Exp Med 215, 321–331. [DOI] [PubMed] [Google Scholar]
- Ando A, Hagiwara Y, Tsuchiya M, et al. (2009) Increased expression of metalloproteinase‐8 and ‐13 on articular cartilage in a rat immobilized knee model. Tohoku J Exp Med 217, 271–278. [DOI] [PubMed] [Google Scholar]
- Ando A, Suda H, Hagiwara Y, et al. (2011) Reversibility of immobilization‐induced articular cartilage degeneration after remobilization in rat knee joints. Tohoku J Exp Med 224, 77–85. [DOI] [PubMed] [Google Scholar]
- Balci HI, Kocaoglu M, Eralp L, et al. (2014) Knee flexion contracture in haemophilia: treatment with circular external fixator. Haemophilia 20, 879–883. [DOI] [PubMed] [Google Scholar]
- Borrelli J Jr, Torzilli PA, Grigiene R, et al. (1997) Effect of impact load on articular cartilage: development of an intra‐articular fracture model. J Orthop Trauma 11, 319–326. [DOI] [PubMed] [Google Scholar]
- Chen CT, Burton‐Wurster N, Borden C, et al. (2001) Chondrocyte necrosis and apoptosis in impact damaged articular cartilage. J Orthop Res 19, 703–711. [DOI] [PubMed] [Google Scholar]
- Dare D, Rodeo S (2014) Mechanisms of post‐traumatic osteoarthritis after ACL injury. Curr Rheumatol Rep 16, 448. [DOI] [PubMed] [Google Scholar]
- Haapala J, Arokoski JP, Hyttinen MM, et al. (1999) Remobilization does not fully restore immobilization induced articular cartilage atrophy. Clin Orthop Relat Res 362, 218–229. [PubMed] [Google Scholar]
- Hagiwara Y, Ando A, Chimoto E, et al. (2009) Changes of articular cartilage after immobilization in a rat knee contracture model. J Orthop Res 27, 236–242. [DOI] [PubMed] [Google Scholar]
- Hagiwara Y, Ando A, Chimoto E, et al. (2010) Expression of collagen types I and II on articular cartilage in a rat knee contracture model. Connect Tissue Res 51, 22–30. [DOI] [PubMed] [Google Scholar]
- Hildebrand KA, Sutherland C, Zhang M (2004) Rabbit knee model of post‐traumatic joint contractures: the long‐term natural history of motion loss and myofibroblasts. J Orthop Res 22, 313–320. [DOI] [PubMed] [Google Scholar]
- Jortikka MO, Inkinen RI, Tammi MI, et al. (1997) Immobilisation causes longlasting matrix changes both in the immobilised and contralateral joint cartilage. Ann Rheum Dis 56, 255–261. [DOI] [PMC free article] [PubMed] [Google Scholar]
- Jurvelin J, Kiviranta I, Tammi M, et al. (1986) Softening of canine articular cartilage after immobilization of the knee joint. Clin Orthop Relat Res 207, 246–252. [PubMed] [Google Scholar]
- Kiviranta I, Jurvelin J, Tammi M, et al. (1987) Weight bearing controls glycosaminoglycan concentration and articular cartilage thickness in the knee joints of young beagle dogs. Arthritis Rheum 30, 801–809. [DOI] [PubMed] [Google Scholar]
- Ko FC, Dragomir C, Plumb DA, et al. (2013) In vivo cyclic compression causes cartilage degeneration and subchondral bone changes in mouse tibiae. Arthritis Rheum 65, 1569–1578. [DOI] [PMC free article] [PubMed] [Google Scholar]
- Kunz RI, Coradini JG, Silva LI, et al. (2014) Effects of immobilization and remobilization on the ankle joint in Wistar rats. Braz J Med Biol Res 47, 842–849. [DOI] [PMC free article] [PubMed] [Google Scholar]
- Lee MS, Trindade MC, Ikenoue T, et al. (2003) Regulation of nitric oxide and bcl‐2 expression by shear stress in human osteoarthritic chondrocytes in vitro . J Cell Biochem 90, 80–86. [DOI] [PubMed] [Google Scholar]
- Leong DJ, Gu XI, Li Y, et al. (2010) Matrix metalloproteinase‐3 in articular cartilage is upregulated by joint immobilization and suppressed by passive joint motion. Matrix Biol 29, 420–426. [DOI] [PMC free article] [PubMed] [Google Scholar]
- Matsuzaki T, Yoshida S, Kojima S, et al. (2013) Influence of ROM exercise on the joint components during immobilization. J Phys Ther Sci 25, 1547–1551. [DOI] [PMC free article] [PubMed] [Google Scholar]
- McCarthy C, Oakley E (2002) Management of suspected cervical spine injuries: the paediatric perspective. Accid Emerg Nurs 10, 163–169. [DOI] [PubMed] [Google Scholar]
- McCoy AM, Toth F, Dolvik NI, et al. (2013) Articular osteochondrosis: a comparison of naturally‐occurring human and animal disease. Osteoarthritis Cartilage 21, 1638–1647. [DOI] [PMC free article] [PubMed] [Google Scholar]
- Moriyama H, Yoshimura O, Sunahori H, et al. (2004) Progression and direction of contractures of knee joints following spinal cord injury in the rat. Tohoku J Exp Med 204, 37–44. [DOI] [PubMed] [Google Scholar]
- Nagai M, Aoyama T, Ito A, et al. (2014) Contributions of biarticular myogenic components to the limitation of the range of motion after immobilization of rat knee joint. BMC Musculoskelet Disord 15, 224. [DOI] [PMC free article] [PubMed] [Google Scholar]
- Nagai M, Aoyama T, Ito A, et al. (2015) Alteration of cartilage surface collagen fibers differs locally after immobilization of knee joints in rats. J Anat 226, 447–457. [DOI] [PMC free article] [PubMed] [Google Scholar]
- Palmoski MJ, Brandt KD (1981) Running inhibits the reversal of atrophic changes in canine knee cartilage after removal of a leg cast. Arthritis Rheum 24, 1329–1337. [DOI] [PubMed] [Google Scholar]
- Racine J, Aaron RK (2014) Post‐traumatic osteoarthritis after ACL injury. R I Med J 97, 25–28. [PubMed] [Google Scholar]
- Säämänen AM, Tammi M, Jurvelin J, et al. (1990) Proteoglycan alterations following immobilization and remobilization in the articular cartilage of young canine knee (stifle) joint. J Orthop Res 8, 863–873. [DOI] [PubMed] [Google Scholar]
- Smith RL, Carter DR, Schurman DJ (2004) Pressure and shear differentially alter human articular chondrocyte metabolism: a review. Clin Orthop Relat Res 427 Suppl, S89–S95. [PubMed] [Google Scholar]
- Stoop R, Buma P, van der Kraan PM, et al. (2001) Type II collagen degradation in articular cartilage fibrillation after anterior cruciate ligament transection in rats. Osteoarthritis Cartilage 9, 308–315. [DOI] [PubMed] [Google Scholar]
- Trudel G, Himori K, Goudreau L, et al. (2003) Measurement of articular cartilage surface irregularity in rat knee contracture. J Rheumatol 30, 2218–2225. [PubMed] [Google Scholar]
- Trudel G, Himori K, Uhthoff HK (2005) Contrasting alterations of apposed and unapposed articular cartilage during joint contracture formation. Arch Phys Med Rehabil 86, 90–97. [DOI] [PubMed] [Google Scholar]
- Usuba M, Akai M, Shirasaki Y, et al. (2007) Experimental joint contracture correction with low torque–long duration repeated stretching. Clin Orthop Relat Res 456, 70–78. [DOI] [PubMed] [Google Scholar]
- Vanwanseele B, Lucchinetti E, Stussi E (2002) The effects of immobilization on the characteristics of articular cartilage: current concepts and future directions. Osteoarthritis Cartilage 10, 408–419. [DOI] [PubMed] [Google Scholar]
- Waugh W, Newton G, Tew M (1980) Articular changes associated with a flexion deformity in rheumatoid and osteoarthritic knees. J Bone Joint Surg Br 62, 180–183. [DOI] [PubMed] [Google Scholar]


