

Abstract
Key points
Arachidonic acid (AA) greatly enhances the activity of the voltage‐gated proton (Hv) channel, although its mechanism of action and physiological function remain unclear.
In the present study, we analysed the effects of AA on proton currents through Hv channels heterologously expressed in HEK293T cells.
The dramatic increase in proton current amplitude elicited by AA was accompanied by accelerated activation kinetics and a leftward shift in the voltage‐dependence of activation.
Mutagenesis studies suggest the two aforementioned effects of AA reflect two distinct structural mechanisms.
Application of phospholipase A2, which liberates AA from phospholipids in the membrane, also enhances Hv channel activity, supporting the idea that AA modulates Hv channel activity within physiological contexts.
Abstract
Unsaturated fatty acids are key components of the biological membranes of all cells, and precursors of mediators for cell signalling. Arachidonic acid (AA) is an unsaturated fatty acid known to modulate the activities of various ion channels, including the voltage‐gated proton (Hv) channel, which supports the rapid production of reactive oxygen species (ROS) in phagocytes through regulation of pH and membrane potential. However, the molecular mechanisms and physiological functions of the effects of AA on Hv channels remain unclear. In the present study, we report an electrophysiological analysis of the effects of AA on the mouse Hv channel (mHv1) heterologously expressed in HEK293T cells. Application of AA to excised inside‐out patch membranes rapidly induced a robust increase in the amplitude of the proton current through mHv1. The current increase was accompanied by accelerated activation kinetics and a small leftward shift of the current–voltage relationship. In monomeric channels lacking the coiled‐coil region of the channel protein, the shift in the current–voltage relationship was diminished but activation and deactivation remained accelerated. Studies with several AA derivatives showed that double bonds and hydrophilic head groups are essential for the effect of AA, although charge was not important. The application of phospholipase A2 (PLA2), which generates AA from cell membrane phospholipids, stimulated mHv1 activity to a similar extent as direct application of ∼20 μm AA, suggesting that endogenous AA may regulate Hv channel activity.
Key points
Arachidonic acid (AA) greatly enhances the activity of the voltage‐gated proton (Hv) channel, although its mechanism of action and physiological function remain unclear.
In the present study, we analysed the effects of AA on proton currents through Hv channels heterologously expressed in HEK293T cells.
The dramatic increase in proton current amplitude elicited by AA was accompanied by accelerated activation kinetics and a leftward shift in the voltage‐dependence of activation.
Mutagenesis studies suggest the two aforementioned effects of AA reflect two distinct structural mechanisms.
Application of phospholipase A2, which liberates AA from phospholipids in the membrane, also enhances Hv channel activity, supporting the idea that AA modulates Hv channel activity within physiological contexts.
Abbreviations
- AA
arachidonic acid
- AEA
anandamide
- 2‐AG
2‐arachidonyl glycerol
- AAME
arachidonic acid methyl ester
- Hv channel
voltage‐gated proton channel
- mHv1
mouse Hv channel
- PKC
protein kinase C
- PLA2
phospholipase A2
- ROS
reactive oxygen species
- WT
wild‐type
- WBCs
white blood cells
Introduction
Voltage‐gated ion channels play essential roles in the generation and modulation of electrical activity which is important to many biological processes in excitable cells, such as neurons and muscle fibres. The proteins comprising the channels share a number of common features. For example, the first four transmembrane segments (S1–S4) commonly constitute the voltage sensor domain, whereas the remaining two transmembrane segments (S5–S6) form the pore domain. Ion channels are often directly or indirectly modulated by unsaturated fatty acids (Meves, 1994; Boland & Drzewiecki, 2008; Meves, 2008; Roberts‐Crowley et al. 2009). Examples include the Kv1.1, Nav1.5 and Cav3.1 channels, which are all suppressed by unsaturated fatty acids (Meves, 1994; Boland & Drzewiecki, 2008; Meves, 2008; Roberts‐Crowley et al. 2009), and the Kir2.3, Kv7.1 and TRAAK channels, which are all enhanced (Meves, 1994; Boland & Drzewiecki, 2008; Meves, 2008). However, the detailed molecular mechanisms and the physiological importance of the actions of fatty acids on ion channels remain largely unknown.
Arachidonic acid (AA) is an omega‐6 polyunsaturated fatty acid with four double bonds and is a component of membrane phospholipids, esterified in the sn‐2 position of the glycerol backbone. AA is released from cell membranes by phospholipase A2 (PLA2) during inflammatory reactions, after which the free AA functions as a second messenger. In phagocytes such as neutrophils and macrophages, the liberated AA or its metabolized derivatives (lipid mediators: prostaglandin, thromboxane, leukotriene; neurotransmitters: anandamide, 2‐arachidonylglycerol) regulate various biological reactions, including production of reactive oxygen species (ROS) by NADPH oxidase (Hii & Ferrante, 2007; Boland & Drzewiecki, 2008). The generation of ROS induces membrane depolarization and reduces the pH of the cytoplasm, which restricts the activity of NADPH oxidase (DeCoursey, 2003, 2013). Voltage‐gated proton (Hv) channels help to sustain NADPH oxidase activity through simultaneous regulation of membrane potential and pH.
Hv channels mediate proton conductance across the plasma membrane in response to changes in membrane potential and/or cytoplasmic pH in phagocytes and spermatozoa (Ramsey et al. 2006; Sasaki et al. 2006; Okochi et al. 2009; Morgan et al. 2009; Ramsey et al. 2009; Lishko et al. 2010). Each channel contains four transmembrane helices, which show similarity to the voltage‐sensor domain (S1–S4) of authentic classical voltage‐gated ion channels but lack the region corresponding to the ion pore domain (S5–S6). S4 is part of a long helix that also includes the cytoplasmic coiled‐coil domain, and mediates the formation of a dimeric structure (Fujiwara et al. 2014; Takeshita et al. 2014) that influences the voltage‐dependent gating of the channel (Koch et al. 2008; Fujiwara et al. 2012, 2014). In previous studies, application of a low concentration of AA (10 μm or less) induced a several‐fold increase in proton current amplitude in neutrophils, eosinophils, macrophages and spermatozoa (DeCoursey & Cherny, 1993; Kapus et al. 1994; Schrenzel et al. 1996; Gordienko et al. 1996; Susztak et al. 1997; Cherny et al. 2001; Morgan et al. 2007; Lishko et al. 2010). However, a comprehensive study of AA over a broad range of concentrations has never been performed. In addition, details of the molecular mechanisms by which AA influences Hv channel activity have not yet been described.
In the present study, we used the patch clamp technique to quantitatively analyse AA‐induced alterations in the activity of mouse Hv channels (mHv1) heterologously expressed in HEK293T cells. An inside‐out patch configuration was chosen because it provides a stable patch membrane and enables strict control of the pH at the inside surface of the membrane (in the bath buffer). It also excludes possible indirect actions of AA as a precursor of intracellular second messengers. Our findings indicate that AA greatly enhances mHv1 currents mainly by accelerating their activation kinetics. Moreover, similar effects were exerted by PLA2, which liberates AA from cell membrane phospholipids. These findings suggest that enhancement of Hv channel activity by AA may occur within physiological contexts.
Methods
Electrophysiology
The cDNAs for wild‐type (WT), mutant and truncated mHv1 (Sasaki et al. 2006; Koch et al. 2008; Fujiwara et al. 2012) in pIRES2‐EGFP, a biscistronic vector, were transfected into HEK293T cells, after which the cells were cultured for 24 h in Dulbecco's modified Eagle's medium supplemented with 10% fetal bovine serum. Electrophysiological recordings were carried out 2–10 h after reseeding, which corresponded to 18–30 h after transfection. A coverslip containing HEK293T cells was placed in a recording chamber containing bath solution (see below) on the stage of an inverted fluorescence microscope (IX71; Olympus Inc., Tokyo, Japan). The cells successfully transfected were identified based on the fluorescence signal from expressed green fluorescent protein. Macroscopic currents were then recorded in the inside‐out patch clamp configuration using an Axopatch‐200B amplifier (Molecular Devices, Sunnyvale, CA, USA). The pipette resistance in the solution was 7–12 MΩ. The recorded currents were low‐pass filtered at 2 kHz using a four‐pole Bessel filter circuit built into the amplifier, and the sampling frequency was 10 kHz. Current traces were digitally filtered at 500 Hz or 1 kHz. The holding potential was −80 mV, and the recording temperature was room temperature (∼25°C). Fatty acids are known to be adsorbed onto the surfaces of plastic tubes and dishes and to be taken up into cells, which makes the effective free fatty acid concentration considerably lower than the nominal concentration (Bruno et al. 2007; Börjesson et al. 2008). To avoid these problems, we used a rapid‐perfusion system (OctaflowII; ALA Scientific Instruments, Farmingdale, NY, USA) constructed of Teflon and quartz components, which minimized fatty acid binding to the system. The flux rate was 0.66 μl s–1. All fatty acid concentrations stated in the present work were the nominal concentrations after dilution. PLA2 was added to the bath using a pipette instead of the rapid perfusion system.
Solutions and reagents
The bath and pipette solutions contained 75 mm N‐methyl‐d‐glucamine, 3 mm MgCl2, 1 mm EGTA, 10–20 mm glucose and 180 mm Hepes (pH 7.0). When PLA2 was applied to the patch membrane, 2 mm CaCl2 and 1 mm β‐mercaptoethanol were added to the solutions. AA, anandamide (AEA), 2‐arachidonyl glycerol (2‐AG), arachidonic acid methyl ester and stearic acid were purchased from Cayman (Ann Arbor, MI, USA). The chemical structures are shown in Fig. 4 F. The 10 mm stock solutions in ethanol were stored at −20°C after N2 gas purge in a glass vessel. Once the stock solutions were diluted to their final concentrations and then ultrasonicated by 45 kHz for 10 s, they were used within 3 h. A control experiment with solution containing 1% ethanol (corresponding to 100 μm fatty acid) elicited no change in the proton current (Fig. 4 E). PLA2 from honeybee venom was purchased from Sigma (St Louis, MO, USA). The 142 μm stock solutions in phosphate‐buffered saline were stored at 4°C or −20°C.
Figure 4. Effects of fatty acid derivatives on mHv1 .
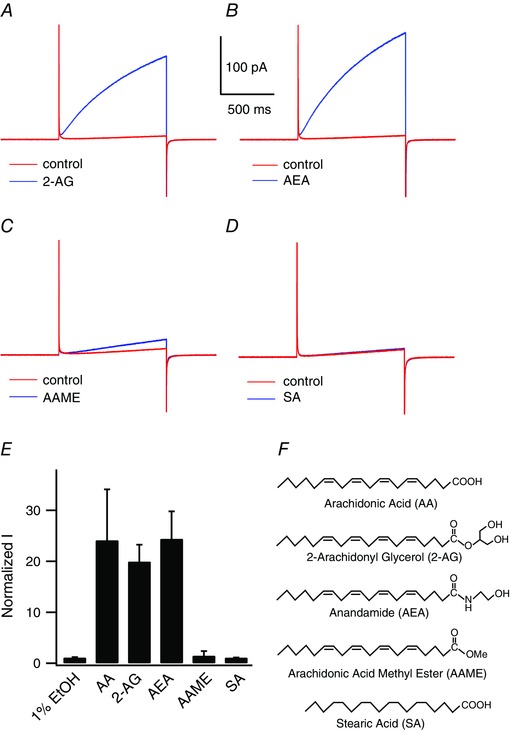
Representative mHv1 current traces recorded without (red) or with (blue) 50 μm fatty acid at +100 mV. A, 2‐AG. B, AEA. C, AAME. D, stearic acid. E, normalized mHv1 current amplitudes at the end of 1 s depolarizing step pulses in the presence of the indicated fatty acids. Values were normalized to the current amplitude without fatty acids. Bars are the mean ± SD of data from three to 17 different patches (1%EtOH, n = 3; SA, n = 3; AA, n = 17; 2‐AG, n = 3; AEA, n = 3; AAME, n = 7). F, fatty acid structures: AA (C20:4), 2‐AG (C20:4), AEA (C20:4), AAME (C20:4), SA (C18:0).
Statistical analysis
Data were analysed using Clampfit (Axon Instruments, Foster City, CA, USA) and Igor Pro (WaveMetrics Inc., Portland, OR, USA) software. The activation time constant was obtained by fitting the activation phase of the outward proton currents with a double exponential. The deactivation time constant was obtained by fitting the deactivation tail currents elicited by hyperpolarization steps from the holding potential with a single exponential. Steady‐state currents elicited by depolarization steps were also calculated from the abovementioned fittings. Data were analysed statistically are reported as the mean ± SD.
Results
Electrophysiology of mHv1 and the effects of AA
The effect of AA on Hv channel activity was assessed using inside‐out patch clamp recordings to measure proton currents through mHv1. In earlier studies using whole‐cell or perforated patch clamp with native immune cells, increases in proton current amplitude were examined using AA at concentrations up to 10 μm (Kapus et al. 1994; Schrenzel et al. 1996; Gordienko et al. 1996; Susztak et al. 1997; Cherny et al. 2001; Morgan et al. 2007). Higher concentrations were problematical because AA often destabilized the patch seal or stimulated cell viability (Kapus et al. 1994). Although the free AA concentration in the cytoplasm of unstimulated white blood cells (WBCs) is known to be below the micromolar level (Meves, 1994; Hii & Ferrante, 2007; Boland & Drzewiecki, 2008; Meves, 2008), higher concentrations (>10 μm, or in some cases >100 μm) are attained during inflammatory responses (Meves, 1994; Hii & Ferrante, 2007; Boland & Drzewiecki, 2008; Meves, 2008). Thus, to fully understand the effects of AA on proton channels, it would appear to be necessary to determine the effects of a wider range of AA concentrations on the proton current. To avoid the aforementioned problems encountered with intact cells, we measured proton currents using an excised patch membrane, which enabled the formation of a more stable seal than in the whole cell configuration. It also excluded possible indirect effects of AA exerted through production of downstream mediators and enabled the pH to be tightly controlled. This is particularly important when recording proton currents because the gating of mHv1 is itself sensitive to pH differences across the membrane (DeCoursey, 2013; Fujiwara & Okamura, 2014).
Figure 1 A shows representative records illustrating the changes of mHv1 currents elicited upon application of AA along with 1 s step pulses to 100 mV every 30 s. An ∼25‐fold increase in the outward proton current was observed immediately after the addition of 50 μm AA. The current then rapidly returned to the unstimulated level upon washing out the AA. This stimulation of mHv1 currents by AA was more robust than that described in previous studies using a lower AA concentration (Kapus et al. 1994; Schrenzel et al. 1996; Gordienko et al. 1996; Susztak et al. 1997; Cherny et al. 2001; Morgan et al. 2007). Representative traces of mHv1 currents before and after the addition of 50 μm AA are shown in Fig. 1 B, and the current–voltage (I–V) relationships are shown in Fig. 1 C.
Figure 1. Enhancement of mHv1 currents by AA .
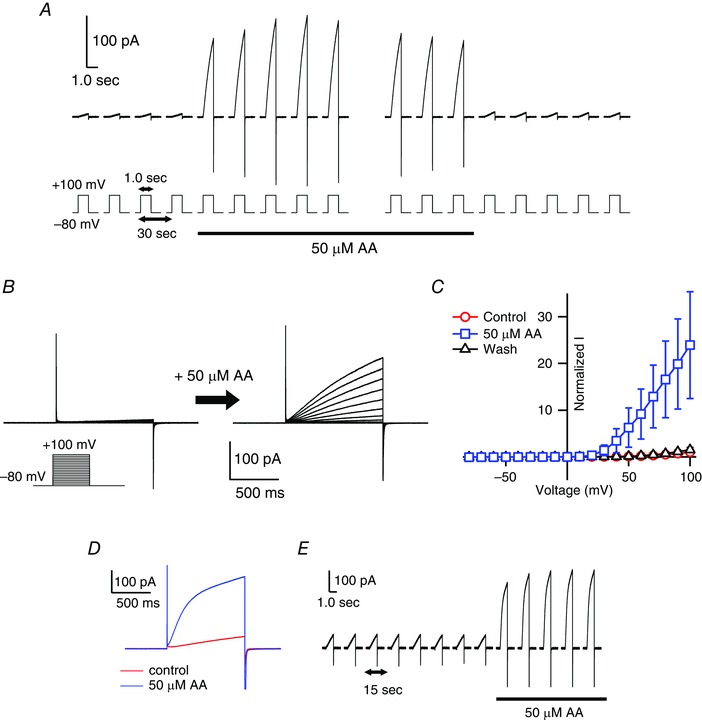
A, representative traces of currents through mHv1 expressed in HEK293T cells. The currents were measured in the excised inside‐out patch configuration. Depolarizing voltage pulses (+100 mV, 1 s in duration) were applied every 30 s from a holding potential of −80 mV. The black underbar indicates the period of the addition of 50 μm AA using a rapid‐perfusion system. In each raw trace, the pipette capacitance was corrected using the trace from a 0 mV step pulse. B, families of current traces evoked using 1 s depolarizing pulses in 10 mV increments from −80 mV to +100 mV before (left) and after (right) application of 50 μm AA. Pulse protocols are indicated in the inset. C, normalized I–V relationships for the end of depolarizing step pulses in (B) before (red) and after (blue) AA application and after washout (black). Current amplitudes were normalized to the amplitude without AA at +100 mV. Symbols are the mean ± SD of data from the following numbers of patches: control, n = 19; 50 μm AA, n = 14; washout, n = 6. Where absent, SD was smaller than the symbol. D, representative current traces of the mHv1 without (red) or with (blue) 50 μm AA by outside‐out patch configuration. Depolarizing voltage pulses (+100 mV, 1 s in duration) were applied from a holding potential of −80 mV. E, current traces were measured every 15 s with 1 s depolarizing voltage pulse to +100 mV by outside‐out configuration. The black bar indicates the period of application of 50 μm AA using a rapid‐perfusion system.
AA‐induced enhancement of mHv1 currents was first detectable at a concentration of 5 μm with an ∼2‐fold increase (1.6 ± 0.4 fold, n = 9), and larger proton currents were induced at higher concentrations (Fig. 2). At 50 μm, AA usually did not affect the seal resistance, and this concentration was used in most experiments. At >100 μm AA, seal destabilization frequently occurred upon membrane depolarization and, at >200 μm AA, the seal broke immediately. The AA concentrations that activated mHv1 (Fig. 2 C) were in the range 10–100 μm, which is within the range of physiological AA concentrations in native cells.
Figure 2. Dose–response relationship of the effects of AA on mHv1 currents .
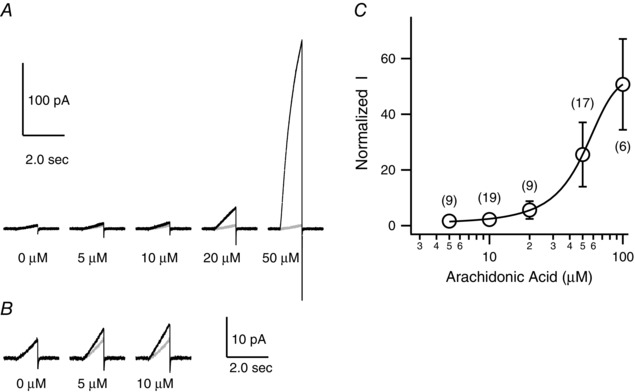
A, representative current traces evoked by depolarizing voltage pulses (+100 mV, 1 s in duration) in the presence of 0, 5, 10, 20 or 50 μm AA (black). Grey overlapped traces were recorded in the absence of AA. B, expansion (5×) of the indicated traces in (A). These current traces were filtered at 500 Hz. C, dose–response of the effect of AA on normalized current amplitude at the end of the depolarizing steps in (A). Current amplitudes were normalized to the amplitude without AA at +100 mV. The curve was fitted using the sigmoid equation. Symbols are the mean ± SD of data from six to 19 different patches (corresponding to the number shown in brackets). Where absent, SD is smaller than the symbol.
We also examined changes in mHv1 currents elicited by application of AA from the extracellular side of the membrane in the outside‐out patch clamp configuration (Fig. 1 D and E). As with the inside‐out configuration, proton currents were rapidly increased upon the addition of AA, and the reaction was reversible. The similarity of the responses elicited in the inside‐out and outside‐out configurations indicates that AA induces alterations in mHv1 activity after its incorporation into the membrane. Detailed comparison of the effects by AA on inside‐out and outside‐out patches was not possible in the present study because of instability of the outside‐out patch membranes.
Alteration of mHv1 gating kinetics by AA
To determine the mechanism by which mHv1 current amplitude is enhanced by AA, we estimated the changes in the activation and deactivation kinetics of the current (Fig. 3 A–F). Because of the extremely slow rising phase of the current (Fig. 1 B), long (60 s) depolarizing pulses were applied to obtain the activation time constant (Fig. 3 A). The mHv1 activation kinetics were fitted by double exponential functions and were significantly faster in the presence of AA than in its absence (Fig. 3 B–D). Following treatment with AA, the activation time constant for the major component was approximately two orders of magnitude smaller than the control without AA. The time constants for activation without AA were τfast = 6.8 ± 2.0 s (12.5 ± 4.9%) and τslow = 43.4 ± 15.1 s (87.5 ± 4.9%) at 80 mV; those with AA were τfast = 140 ± 43 ms (13.3 ± 6.4%) and τslow = 560 ± 165 ms (86.7 ± 6.4%) at 80 mV (Table 1). The deactivation kinetics of mHv1 with or without AA could be fitted by a single exponential function (Fig. 3 E and F). AA also accelerated the deactivation kinetics such that the time constant was 5‐fold smaller with AA than without it.
Figure 3. Analysis of the activation kinetics and voltage‐dependence of mHv1 .
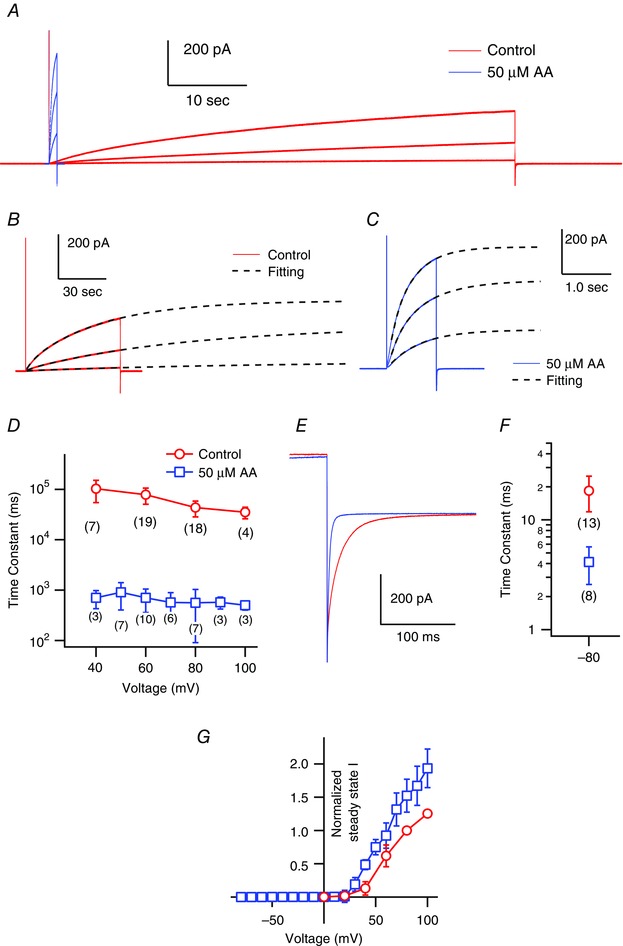
A, representative mHv1 current traces. Shown are 1 s and 60 s depolarizing step pulses (+40, +60, +80 mV) without (red) and with (blue) AA. B, The activation phases of mHv1 currents in absence of AA (the same as red traces shown in A) were fitted by a double exponential function. C, The activation phases in presence of 50 uM AA (the same as blue traces shown in A) were fitted by a double exponential function. In B and C, black broken lines are fitted curves and voltage steps were +40, +60, +80 mV. D, the time constants for the major component of the activation phase measured at +40, +60, +80 and +100 mV (control) and +40, +50, +60, +70, +80, +90 and +100 mV (AA). Data are the mean ± SD of data from three to 19 different patches (the numbers in brackets). Where absent, the SD is smaller than the symbol. E, enlarged image of the deactivation phase of the mHv1 current at −80 mV after a depolarizing step pulse to +80 mV (control) or +50 mV (AA). Pipette capacitance was subtracted using the current traces at 0 mV. F, the deactivation phases were fitted by a single exponential function and the time constants were plotted. Symbols are the mean ± SD of data from eight or 13 different patches (numbers in brackets). G, normalized I–V relationships of the steady‐state mHv1 currents were calculated using double exponential fitting. Values were normalized to the mHv1 current amplitude in the absence of AA at +80 mV for datasets from each patch. Symbols are the mean ± SD of data from three to 20 different patches (control: 0, +20, +40, +60, +80, +100 mV, n = 5, 5, 17, 20, 20, 5; with AA: −80 to +70, +80, +90, +100 mV, n = 6, 5, 4, 3). Where absent, SD is smaller than the symbol.
Table 1.
Fitting parameter of activation phase of mHv1 currents
| Voltage (mV) | Major component (s) | Ratio (%) | Minor component (s) | Ratio (%) | n |
|---|---|---|---|---|---|
| Control | |||||
| 40 | 102.8 ± 48.2 | 93.9 ± 4.2 | 7.7 ± 3.6 | 6.1 ± 4.2 | 7 |
| 60 | 78.3 ± 27.6 | 92.7 ± 2.9 | 6.9 ± 3.2 | 7.3 ± 2.9 | 19 |
| 80 | 43.4 ± 15.1 | 87.5 ± 4.9 | 6.8 ± 2.0 | 12.6 ± 4.9 | 18 |
| 100 | 35.1 ± 9.1 | 86.1 ± 3.7 | 5.9 ± 1.6 | 13.9 ± 3.7 | 4 |
| 50 μm AA | |||||
| 40 | 0.703 ± 0.190 | 92.6 ± 5.5 | 0.111 ± 0.006 | 7.4 ± 5.5 | 3 |
| 50 | 0.904 ± 0.360 | 83.5 ± 9.1 | 0.186 ± 0.055 | 16.5 ± 9.1 | 7 |
| 60 | 0.704 ± 0.202 | 91.0 ± 9.8 | 0.171 ± 0.066 | 9.0 ± 9.8 | 10 |
| 70 | 0.568 ± 0.126 | 86.3 ± 8.4 | 0.132 ± 0.024 | 13.7 ± 8.4 | 6 |
| 80 | 0.560 ± 0.165 | 86.7 ± 6.4 | 0.140 ± 0.043 | 13.3 ± 6.4 | 7 |
| 90 | 0.573 ± 0.147 | 81.3 ± 3.2 | 0.133 ± 0.040 | 18.7 ± 3.2 | 3 |
| 100 | 0.501 ± 0.080 | 84.0 ± 6.2 | 0.105 ± 0.012 | 16.0 ± 6.2 | 3 |
Parameters of the major and minor exponential component of activation phase of mHv1‐derived outward currents in the absence (upper) and presence (lower) of 50 μm AA at distinct membrane voltages.
We could not plot conductance–voltage (G–V) relationships based on the tail currents. Instead, the steady‐state I–V relationships in the presence and absence of AA were compared (Fig. 3 G). We calculated the steady‐state amplitude of the mHv1 current from the double‐exponential fitting (Fig. 3 B and C). The normalized steady‐state I–V relationships clearly show a negative shift of 10–20 mV upon AA application.
These findings show that the AA‐induced increases of proton currents through mHv1 mainly reflect acceleration of the activation kinetics and a negative shift in the voltage‐dependence of the channel opening.
Double bonds and a hydrophilic head group are essential for the AA effect but charge is not
The double bonds and negative charge of unsaturated fatty acids are known to affect the behaviour of some ion channels (Börjesson et al. 2008; Hoshi et al. 2013 a). For example, docosahexaenoic acid, eicosapentaenoic acid, linolenic acid and oleic acid all shift the G–V relationships of voltage‐gated K+ channels, including the Shaker K channel and BK channel, in the negative direction, although uncharged fatty acids such as docosahexaenoic acid‐methyl ester do not cause such a shift (Börjesson et al. 2008; Hoshi et al. 2013 a). The effects of several saturated and unsaturated fatty acids on proton currents in macrophages indicate that double bonds are necessary for the potentiation of Hv channel activity in native cells (Kapus et al. 1994). On the other hand, charge may not be necessary because AEA, which has no charge at the site corresponding to the carboxyl group of AA, also enhances the proton currents in spermatozoa (Lishko et al. 2010).
When we analysed the effects of various fatty acids on mHv1 currents, we found that stearic acid (C18:0), a saturated fatty acid, had no effect on proton currents (Fig. 4 D), as reported previously for the native Hv channel (Kapus et al. 1994). This further confirms that double bonds are necessary for the actions of unsaturated fatty acids. In addition, at what would be an effective AA concentration (50 μm), AAME (the uncharged form of AA) had little effect on mHv1 currents (Fig. 4 C). We also examined the effects of the endocannabinoids AEA and 2‐AG. These uncharged fatty acids are known neurotransmitters that are released from postsynaptic neurons and retrogradely activate CB1 or CB2 receptors on presynaptic nerve terminals (Piomelli & Sasso, 2014). Application of AEA or 2‐AG enhanced mHv1 currents to the same degree as AA did (Fig. 4 A, B and E), suggesting that charge is not necessary for the effect of AAs on mHv1. The head groups of AA, AEA, 2‐AG and AAME contain a carboxyl group, amide group, glycerol group and ester group, respectively (Fig. 4 F). The first three of those are hydrophilic, whereas the last is hydrophobic, suggesting a hydrophilic head group is essential for the AA effect, whereas charge is not essential.
AA does not alter dimer co‐operativity
Under physiological conditions, Hv channels interact via their cytoplasmic C‐terminal coiled‐coil domain to form dimers (Koch et al. 2008; Fujiwara et al. 2012) and they show co‐operative gating (Tombola et al. 2008; Gonzalez et al. 2010; Fujiwara et al. 2012). The activation kinetics of the monomeric Hv channel are faster than those of the dimeric WT channel (Koch et al. 2008; Fujiwara et al. 2012, 2013), and the accelerated gating in the monomer appears to be similar to the gating of mHv1 in the presence of AA. We therefore examined whether the AA‐induced acceleration of the mHv1 activation kinetics was related to the co‐operativity between the two protomers. Accordingly, we employed a C‐terminal truncated version of mHv1 (ΔC), which is known to operate as a monomer (Koch et al. 2008), and a second mutant in which three sequential residues in the linker region between S4 and the coiled‐coil domain were replaced with glycine (GGG). Although dimeric, the GGG mutant shows no gating co‐operatively (Fujiwara et al. 2012). If AA does not alter the proton current carried by the monomeric constructs, this will mean that the effect by AA is mediated through modification of the dimerization or co‐operativity. Figure 5 shows representative current traces recorded from mHv1 ΔC and GGG in the absence and presence of AA. The amplitudes of the currents through both constructs were still increased in the presence of AA (Fig. 5 A and B) and AA accelerated activation (4.1 ± 1.6‐fold faster time constant; n = 4) of ΔC (Fig. 5 C). Unlike with mHv1 WT, AA elicited no shift in the normalized steady‐state I–V relationship of ΔC (Fig. 5 E). With the GGG mutant, AA accelerated activation (13.0 ± 4.5‐fold times faster time constant; n = 3) and shifted the I–V relationships 10–20 mV leftward (Fig. 5 B, D and F). Analysis of tail currents at −80 mV showed that deactivation kinetics was accelerated in both the GGG mutant (16.2 ± 4.4‐fold; n = 3) and ΔC (2.2 ± 0.3‐fold; n = 4)(Fig. 5 G and H). These results suggest AA does not accelerate gating by modifying the co‐operativity within dimeric mHv1 and that dimer formation, but not co‐operative gating, is required for the shift of I–V relationship by AA.
Figure 5. Effects of AA on mHv1 mutant constructs .
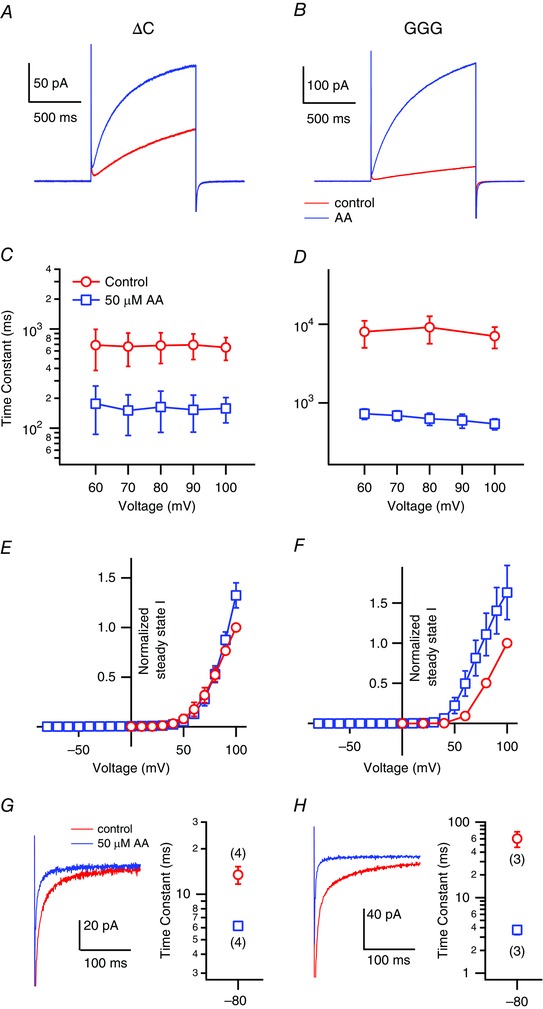
Representative current traces recorded from mHv1 ΔC (A) and GGG (B) mutants without (red) or with (blue) 50 μm AA at +100 mV. The activation time constants of the ΔC (C) and GGG (D) mutants fitted using a single exponential are shown. Symbols are the mean ± SD of data from three or four different patches, respectively. Where absent, SD is smaller than the symbol. Normalized I–V relationships of the steady‐state Hv currents of the ΔC (E) and GGG (F) mutants calculated by single exponential fitting. Values were normalized to the current amplitude without AA at 100 mV for datasets from each patch. Symbols are the mean ± SD of data from three or four different patches. Where absent, SD is smaller than the symbol. Enlarged current images and the time constants of the deactivation phase of the mHv1 ΔC (G) and GGG (H). The currents shown were with repolarization at −80 mV after a depolarizing step pulse to +100 mV in the presence (blue) and absence of 50 μm AA (red). Pipette capacitance was subtracted using the current traces with depolarizing step to 0 mV. The time constants of deactivation phases at −80 mV after depolarization steps were fitted by a single exponential function. Symbols are the mean ± SD of data from three or four different patches (numbers in brackets).
Previous studies report that co‐operative gating within dimeric Hv channels exhibits sigmoidal activation kinetics (Tombola et al. 2008; Gonzalez et al. 2010; Fujiwara et al. 2012). The activation phase of mHv1 WT in the absence or presence of AA clearly shows a sigmoidal rising phase (Fig. 6 A, B and E). By contrast, there was no sigmoidicity in the activation phase of ΔC, irrespective of AA application (Fig. 6 C, D and E), which indicates that AA does not affect mHv1 co‐operativity.
Figure 6. Test for effects of AA on co‐operativity of mHv1 .
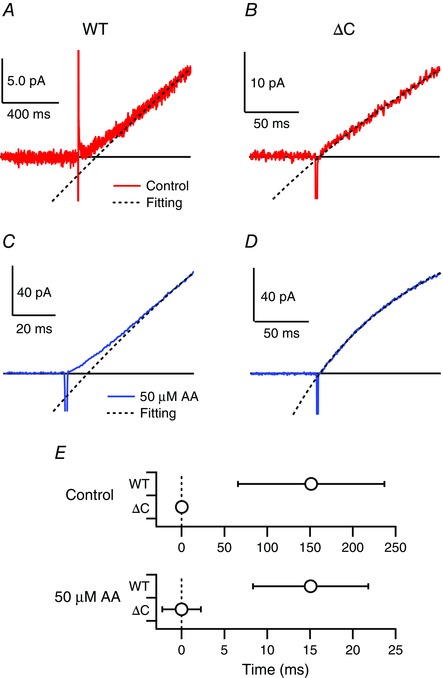
Expanded depiction of the activation phases of currents through mHv1 WT (A) and ΔC (B) without AA at +80 mV. Pipette capacitance was subtracted using current traces at 0 mV. Solid and black broken lines respectively indicate raw traces and fitted curves. The black line indicates the zero line. Expanded depiction of the activation phases of currents through the mHv1 WT (C) and ΔC (D) with AA at +80 mV. Blue solid and black broken lines, respectively, indicate raw traces and fitted curves. Pipette capacitance was subtracted using current traces at 0 mV. E, delay times without (control) or with AA (AA). Delay times are determined by crossing time between the fitting curve and the zero line.
AA accelerates mHv1 gating despite deletion of the N‐terminal phosphorylation site
The protein kinase C (PKC) activator phorbol 12‐myristate 13‐acetate induces Hv currents in native cells, and the phosphorylation site has been identified as Thr29 situated within the intracellular N‐terminal domain (Musset et al. 2010). To determine whether the actions of AA are phosphorylation‐dependent, we tested the effect of AA on mHv1 N‐terminal truncation mutants (ΔN) lacking residues 1–32 or 1–44. Figure 7 clearly shows that AA accelerated both activation and deactivation kinetics in mHv1 ΔN, indicating the mechanism underlying the gating acceleration induced by AA differs from that responsible for the gating induced by phosphorylation.
Figure 7. AA stimulates mHv1 lacking its PKC phosphorylation site .
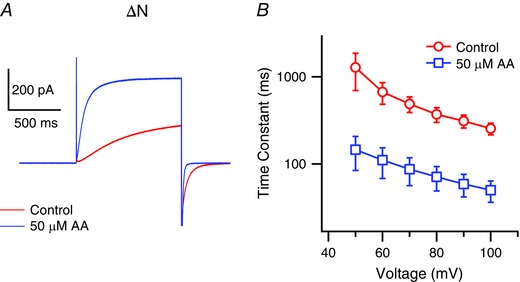
A, representative current traces recorded with mHv1 ΔN without (red) or with (blue) 50 μm AA at +80 mV. B, activation time constants for mHv1 ΔN fitted using a single exponential are shown. Symbols are the mean ± SD of data from three different patches for each condition. Where absent, SD is smaller than the symbol.
mHv1 is stimulated by endogenous AA liberated by PLA2
AA is a second‐messenger molecule released by PLA2 during inflammatory reactions. To determine whether AA liberated from cell membranes enhances mHv1 activity, we measured proton currents through mHv1 elicited upon applying PLA2, instead of exogenous AA. Figure 8 shows representative current traces recorded every 15 s after application of PLA2. Ca2+ is known to be required for PLA2 activity (Dennis et al. 2011). In the absence of Ca2+, PLA2 did not release AA from the membrane and caused no enhancement of mHv1 currents (Fig. 8 A, lower). In the presence of Ca2+, we observed a maximum ∼6‐fold increase in mHv1 current amplitude following application of 10 nm PLA2 (Fig. 8 A, upper). After reaching the maximum, the current amplitude gradually declined to the control level. Subsequent application of a higher concentration of PLA2 (50 nm) to the same patch had no effect. However, when we added the same high concentration of PLA2 to a new patch membrane, it immediately interfered with the stability of the seal and often broke the patch membrane. These results indicate that PLA2 initially generates AA from the patch membrane, after which the AA concentration near patch gradually declines, probably as a result of depletion of AA from the membrane. The concentration of AA near membrane surface achievable with PLA2 was estimated to be ∼20 μm based on the AA dose–response relationship (Fig. 8 B). These values are consistent with the AA concentration within WBCs during inflammatory reactions, and with the idea that AA functions as an activator of mHv1 in the context of actual physiological events.
Figure 8. Effects of PLA2 on mHv1 .
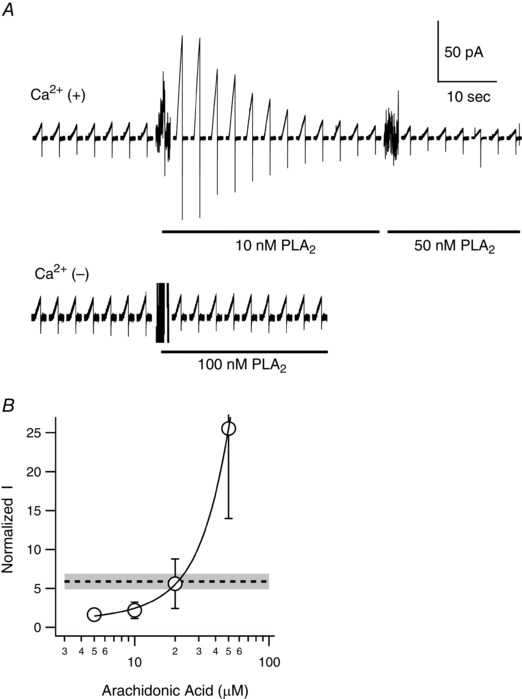
A, series of proton current traces recorded before and after application of PLA2 to HEK293T cells expressing mHv1. Recordings were made using the inside‐out patch clamp mode in the presence (upper) and absence (lower) of Ca2+. Depolarizing voltage pulses (+100 mV, 1 s in duration) were applied every 15 s from a holding potential of −80 mV. The presence of 10, 50 or 100 nm PLA2 is indicated by the black underbar. The noises when PLA2 was added are artefacts caused by pipette mixing. B, expanded dose–response curve for AA from Fig. 2 B. The broken line indicates the normalized current amplitude upon PLA2 application. The grey region shows the SD (n = 4).
Discussion
In the present study, we used excised inside‐out patch clamp recordings to analyse the AA‐induced enhancement of proton currents through mHv1 heterologously expressed in HEK293T cells. This method enabled us to examine with a wider range of doses of AA than in previous studies of native cells. We found that AA induced a marked increase in mHv1 currents that was accompanied by (1) a significant acceleration of the activation kinetics and (2) a minor negative shift in the voltage‐dependence of activation. The former was the major factor for enhancing the Hv channel activity. Experiments with AA derivatives and other fatty acids showed that double bonds and a hydrophilic head group, but not net charge, were important for the AA effect. Application of PLA2 induced a several‐fold increase in proton current amplitude, indicating that AA‐induced enhancement of Hv channel activity may occur within the context of physiological events.
Measurement of proton currents through mHv1 using inside‐out patch clamp recording
We found that the time constant of the major component of the rising phase of mHv1 currents was ∼35 s at 100 mV with symmetrical pH in intra‐ and extracellular solutions (Fig. 3 A and D). This is significantly slower than the time constant measured from whole‐cell recordings, which was ∼2 s at 100 mV (Fujiwara et al. 2013). We did not pursue detailed mechanisms for this phenomenon. We found that Hv channel activities are largest just after patch excision and gradually decrease to a steady‐state level. This suggests that some biochemical conditions are changed or endogenous factors for regulating gating kinetics are lost in the inside‐out patch mode.
Mechanism by which AA enhances mHv1 activity
Using 1 s depolarizing step pulses, we observed a ∼25‐fold increase in mHv1 current amplitude upon exposure to AA (Fig. 1). Because we used an inside‐out patch configuration in this experiment, the involvement of indirect effects from products derived from AA or insertion into the plasma membrane of channels from an intracellular pool is improbable. Three possible changes could account for the observed AA‐induced enhancement of proton currents: (1) acceleration of the activation kinetics, (2) a leftward shift in the voltage‐dependence of activation and (3) an increase in the single channel conductance. We tested the first two possibilities and found that the AA‐induced current increase was accompanied by a reduction in the time constant of approximately two orders of magnitude and a 10–20 mV negative shift in the activation threshold. On the other hand, it is difficult to estimate unitary mHv1 conductance because of its small size. However, using noise analysis, Hv conductance was estimated to be ∼15 fS at physiological pH (pHo//pHi = 7.5//7.2) (Cherny et al. 2003).
AA reportedly induces a several‐fold increase in outward currents through Hv channels natively expressed in WBCs (Kapus et al. 1994; Gordienko et al. 1996; Schrenzel et al. 1996; Susztak et al. 1997; Cherny et al. 2001; DeCoursey, 2003). In these previous studies, the proton current increase was accompanied by accelerated activation and deactivation kinetics (several‐fold smaller time constant) and a 10–20 mV shift in the G–V relationships toward negative voltages (Kapus et al. 1994; Gordienko et al. 1996; Cherny et al. 2001; DeCoursey, 2003; Morgan et al. 2007). The effect of AA on mHv1 in the present study is qualitatively similar to that seen previously with native cells, although we observed a pronounced acceleration of the activation kinetics. This difference could be a result of the different AA concentrations used: proton currents in native WBCs were tested using ∼10 μm AA (Kapus et al. 1994; Gordienko et al. 1996; Schrenzel et al. 1996; Susztak et al. 1997; Cherny et al. 2001; Morgan et al. 2007), whereas we most often used 50 μm AA. The 2‐fold increase in mHv1 current amplitude that we observed with 10 μm AA (Fig. 2 B) appears to be consistent with the results of earlier studies, although quantitative comparison is difficult because of the different recording conditions.
Three experimental findings in the present study provide insight into the molecular mechanism of Hv channel modulation by AA. First, the effects of AA on mHv1 currents were similar regardless of whether AA was applied to the intracellular or extracellular side of the membrane (Fig. 1). This suggests that AA acts on mHv1 after incorporation into the membrane but does not directly target the channel from the aqueous space. Second, comparison of the effects of diverse AA derivatives showed that double bonds in the fatty acids and hydrophilic functional groups were required for the AA effect, whereas the negative charge of AA was not required (Fig. 4). In a previous study of native Hv channels, the potency of unsaturated fatty acids showed a correlation with the number of double bonds (Kapus et al. 1994). Third, monomeric mHv1 (ΔC mutant) showed no shift in the voltage‐dependence of activation but did exhibit accelerated activation kinetics upon AA stimulation (Fig. 5). On the other hand, the responses to AA of a dimeric construct that did not show co‐operativity as a result of substitutions within the linker between S4 and the coiled coil domain (GGG mutant) were similar to those of the WT channel (Fig. 5). The AA‐induced shift in the I–V relationship thus appears to depend on the dimeric organization of the protein but not dimer co‐operativity. A shift of the voltage‐dependence of steady‐state conductance could take place as the result of the distinct effect of AA on activation and deactivation kinetics and, in particular, based on a two‐state transition model: more remarkable acceleration in the activation step than in the deactivation step will result in increase of free energy difference between two states, causing a negative shift of the I–V curve. However, AA‐induced acceleration of deactivation kinetics was more significant in GGG than in the ΔC mutant, which lacks I–V shift (Fig. 5 G and H). Although more quantitative analysis are still required, these results suggest that AA interacts with multiple responsive sites on the channel, which play distinct roles.
Phosphorylation of Hv channels at Thr29, in the N‐terminal region, underlies the PKC‐induced increases proton currents in WBCs (Musset et al. 2010). In the present study, we demonstrated that proton currents through two mHv1 N‐terminal truncation mutants (which started at D33 or W45) were still enhanced by AA (Fig. 7), indicating the AA‐induced gating acceleration is dependent on a mechanism other than a mechanism of the regulation of gating kinetics by phosphorylation of the N‐terminus.
Amino acid residues essential for the action of AA have been suggested for the BK, Nav1.5 and Cav3.1 channels (Xiao et al. 2001; Talavera et al. 2004; Hoshi et al. 2013 b). In those cases, the essential residues are near the intracellular surface of the pore domain (S5–S6). mHv1 consists of a voltage sensor domain similar to that of other classical voltage‐gated ion channels (S1–S4), although it has no region corresponding to the conduction pore domain (S5–S6). A previous study reported that unsaturated fatty acids affect the voltage‐dependence of the Shaker K channel by shifting the G–V curve in the negative direction with an electrostatic effect on positive charge residues in the voltage sensor (S4) (Börjesson et al. 2008). In that case, the charge on the unsaturated fatty acids is necessary, and the features of the acyl chain probably help to place the molecule's carboxyl group in a suitable position close to the voltage sensor of the Kv channel (Börjesson et al. 2008). A similar mechanism has recently been proposed for modulation of KCNQ1 channel (Liin et al. 2015). In the present study, AEA and 2‐AG, which are uncharged but polar unsaturated fatty acids, enhanced mHv1 activity, whereas an uncharged unsaturated fatty acid, AAME, showed little, if any, effect on mHv1 currents (Fig. 4). These findings suggest that the polar nature of the functional group of unsaturated fatty acids is essential for enhancement of mHv1 activity, although a net charge is not.
Physiological significance of the AA‐induced enhancement of Hv channel activity and its relationship with respiratory bursting in WBCs and its function in the nervous system
Termed a ‘respiratory burst’, activated NADPH oxidase catalyses the rapid generation of ROS to eliminate pathogens in phagocytes such as neutrophils and eosinophils (Hii & Ferrante, 2007; DeCoursey, 2013). During respiratory bursts, AA is released from cell membranes through the action of PLA2, which is activated by cellular Ca2+ and mitogen‐activated protein kinase‐dependent phosphorylation (Hii & Ferrante, 2007). Within the stimulated cells, the AA concentration reaches 10–100 μm (Hii & Ferrante, 2007; Meves, 2008), which is consistent with the dose–response relationship that we observed for AA stimulation of mHv1 (Fig. 2). In addition, when we applied PLA2 from the intracellular side, we found that endogenous AA released by the enzyme from the patch membrane enhanced mHv1 currents. We estimated that the concentration of released AA was ∼20 μm, indicating that the liberated AA has the ability of function as a modulator within a physiological context (Fig. 8). During respiratory bursts in neutrophils and eosinophils, native proton currents increase with a negative shift in their voltage dependence, accelerated activation gating and slowed deactivation kinetics; this is known as the ‘enhanced gating mode’ (Bánfi et al. 1999; DeCoursey, 2013).
The human Hv channel is phosphorylated by PKC on Thr29, and the PKC‐induced enhancement of human Hv channel activity is diminished by mutation of Thr29 (Musset et al. 2010). Moreover, phorbol 12‐myristate 13‐acetate (PMA) stimulation of proton currents in granulocytes from PLA2 knockout mice caused changes similar to those in WT mice (Morgan et al. 2007). These results suggest that sustained maintenance of Hv channels in the enhanced gating mode depends largely on signals involving PKC. By contrast, the probable physiological outcome of AA‐induced enhancement of Hv channel activity is a rapid and reversible increase in the supply of protons into phagosomes during the primary stage of the enhanced gating mode. In addition, the intracellular Ca2+ concentration is quickly elevated (within several seconds) in the stimulated cells (Sage et al. 1990). In vitro, this induces half‐activation of unphosphorylated PLA2 (full‐activation requires phosphorylation) (Tucker et al. 2009). Following engulfment of zymosan, the resultant elevation in the intracellular Ca2+ concentration leads to PLA2 translocation from the cytoplasm to the phagosomal membrane within several minutes (Girotti et al. 2004; Bréchard et al. 2013). Those observations suggest that PLA2 probably rapidly supplies AA to the phagosomal membrane, where it enhances Hv channel activity for a short time after cell stimulation.
Recent analysis of the regulation of phagosome luminal pH following particle engulfment by M2 macrophages (Canton et al. 2014) showed that phagosomal pH undergoes transient alkalization (pH 8) and then gradual acidification (pH 5) linked to NADPH oxidase activity. To avoid excessive alkalization, Hv channels should be active following a short delay after particle engulfment. This suggests that AA works as an activator to accelerate Hv channel opening in the phagosomal membrane. Consistent with this idea, in neutrophils from WT mice, phagosomal pH remains near neutral after ingestion of zymosan (El Chemaly et al. 2014), whereas phagosomes in Hv channel‐deficient neutrophils show an alkaline pH shift after a very short delay following zymosan ingestion. Hv channel activity thus appears to stabilize the pH within phagosomes following ROS production by quickly delivering protons to phagosomal lumens.
Hv channels have also been detected in microglia (Eder & DeCoursey, 2001; Okochi et al. 2009; Kettenmann et al. 2011; DeCoursey, 2013), which are the resident macrophage‐like cells within the brain (Eyo & Dailey, 2013). Microglia produce ROS through the activity of NADPH oxidase for induction of apoptosis, phagocytic clearance of dead cells and synapse remodelling (Kettenmann et al. 2011). As in other phagocytes, Hv channels in microglia transport protons to the extracellular space as charge compensation and to help sustain ROS production by NADPH oxidase, which can exacerbate neuronal cell death in the ischaemic brain (Wu et al. 2012).
Neuronal–microglial communications are crucial for proper maintenance of the neuronal nano‐environment in healthy brains (Davalos et al. 2005; Nimmerjahn et al. 2005; Li et al. 2012). However, it is unclear how microglia recognize neuronal signalling. It may be that AA serves as the signal operating through regulation of Hv channel activity in microglia because AA and 2‐AG are released from postsynaptic cells and diffused into the synaptic cleft to mediate retrograde modulation (Nomura et al. 2008; Long et al. 2009) and directly regulate presynaptic ion channels (Sigel et al. 2011). Upon nerve injury, AA synthesized by the activated PLA2 (Sun et al. 2004) may diffuse throughout the injury site, where it could rapidly activate Hv channels and induce proton efflux from microglia at the lesion, thereby contributing to effective phagocytic clearance and synapse remodelling after cell death.
Additional information
Competing interests
The authors declare that they have no competing interests.
Author contributions
AK and YO designed the experiments. AK performed the electrophysiological experiments. AK and YO wrote the paper. All authors have approved the final version of the manuscript and agree to be accountable for all aspects of the work. All persons designated as authors qualify for authorship, and all those who qualify for authorship are listed.
Funding
This work was supported by grants from the Japan Society for the Promotion of Science (KAKENHI: 25253016 and 15H05901 to YO and 15K18516 to AK). AK was supported by a Research Fellowship from the Japan Society for the Promotion of Science for Young Scientists (10J01585 to AK).
References
- Bánfi BB, Schrenzel J, Nüsse O, Lew DP, Ligeti E, Krause K & Demaurex N (1999). A novel H+ conductance in eosinophils: unique characteristics and absence in chronic granulomatous disease. J Exp Med 190, 183–194. [DOI] [PMC free article] [PubMed] [Google Scholar]
- Boland LM & Drzewiecki MM (2008). Polyunsaturated fatty acid modulation of voltage‐gated ion channels. Cell Biochem Biophys 52, 59–84. [DOI] [PubMed] [Google Scholar]
- Börjesson SI, Hammarström S & Elinder F (2008). Lipoelectric modification of ion channel voltage gating by polyunsaturated fatty acids. Biophys J 95, 2242–2253. [DOI] [PMC free article] [PubMed] [Google Scholar]
- Bréchard S, Plançon S & Tschirhart EJ (2013). New insights into the regulation of neutrophil NADPH oxidase activity in the phagosome: a focus on the role of lipid and Ca(2+) signaling. Antioxid Redox Signal 18, 661–676. [DOI] [PMC free article] [PubMed] [Google Scholar]
- Bruno MJ, Koeppe RE & Andersen OS (2007). Docosahexaenoic acid alters bilayer elastic properties. Proc Natl Acad Sci USA 104, 9638–9643. [DOI] [PMC free article] [PubMed] [Google Scholar]
- Canton J, Khezri R, Michael G & Grinsteina S (2014). Contrasting phagosome pH regulation and maturation in human M1 and M2 macrophages. Mol Biol Cell 25, 3330–3341. [DOI] [PMC free article] [PubMed] [Google Scholar]
- El Chemaly A, Nunes P, Jimaja W, Castelbou C & Demaurex N (2014). Hv1 proton channels differentially regulate the pH of neutrophil and macrophage phagosomes by sustaining the production of phagosomal ROS that inhibit the delivery of vacuolar ATPases. J Leukoc Biol 95, 827–839. [DOI] [PubMed] [Google Scholar]
- Cherny V V, Henderson LM, Xu W, Thomas LL & DeCoursey TE (2001). Activation of NADPH oxidase‐related proton and electron currents in human eosinophils by arachidonic acid. J Physiol 535, 783–794. [DOI] [PMC free article] [PubMed] [Google Scholar]
- Cherny V V, Murphy R, Sokolov V, Levis RA & DeCoursey TE (2003). Properties of single voltage‐gated proton channels in human eosinophils estimated by noise analysis and by direct measurement. J Gen Physiol 121, 615–628. [DOI] [PMC free article] [PubMed] [Google Scholar]
- Davalos D, Grutzendler J, Yang G, Kim J V, Zuo Y, Jung S, Littman DR, Dustin ML & Gan W‐B (2005). ATP mediates rapid microglial response to local brain injury in vivo. Nat Neurosci 8, 752–758. [DOI] [PubMed] [Google Scholar]
- DeCoursey TE (2003). Voltage‐gated proton channels and other proton transfer pathways. Physiol Rev 83, 475–579. [DOI] [PubMed] [Google Scholar]
- DeCoursey TE (2013). Voltage‐gated proton channels: molecular biology, physiology, and pathophysiology of the H(V) family. Physiol Rev 93, 599–652. [DOI] [PMC free article] [PubMed] [Google Scholar]
- DeCoursey TE & Cherny V V (1993). Potential, pH, and arachidonate gate hydrogen ion currents in human neutrophils. Biophys J 65, 1590–1598. [DOI] [PMC free article] [PubMed] [Google Scholar]
- Dennis EA, Cao J, Hsu Y‐H, Magrioti V & Kokotos G (2011). Phospholipase A2 enzymes: physical structure, biological function, disease implication, chemical inhibition, and therapeutic intervention. Chem Rev 111, 6130–6185. [DOI] [PMC free article] [PubMed] [Google Scholar]
- Eder C & DeCoursey TE (2001). Voltage‐gated proton channels in microglia. Prog Neurobiol 64, 277–305. [DOI] [PubMed] [Google Scholar]
- Eyo UB & Dailey ME (2013). Microglia: key elements in neural development, plasticity, and pathology. J Neuroimmune Pharmacol 8, 494–509. [DOI] [PMC free article] [PubMed] [Google Scholar]
- Fujiwara Y, Kurokawa T & Okamura Y (2014). Long α helices projecting from the membrane as the dimer interface in the voltage‐gated H(+) channel. J Gen Physiol 143, 377–386. [DOI] [PMC free article] [PubMed] [Google Scholar]
- Fujiwara Y, Kurokawa T, Takeshita K, Kobayashi M, Okochi Y, Nakagawa A & Okamura Y (2012). The cytoplasmic coiled‐coil mediates cooperative gating temperature sensitivity in the voltage‐gated H(+) channel Hv1. Nat Commun 3, 816. [DOI] [PubMed] [Google Scholar]
- Fujiwara Y, Kurokawa T, Takeshita K, Nakagawa A, Larsson HP & Okamura Y (2013). Gating of the designed trimeric/tetrameric voltage‐gated H+ channel. J Physiol 591, 627–640. [DOI] [PMC free article] [PubMed] [Google Scholar]
- Fujiwara Y & Okamura Y (2014). Temperature‐sensitive gating of voltage‐gated proton channels. Curr Top Membr 74, 259–292. [DOI] [PubMed] [Google Scholar]
- Girotti M, Evans JH, Burke D & Leslie CC (2004). Cytosolic phospholipase A2 translocates to forming phagosomes during phagocytosis of zymosan in macrophages. J Biol Chem 279, 19113–19121. [DOI] [PubMed] [Google Scholar]
- Gonzalez C, Koch HP, Drum BM & Larsson HP (2010). Strong cooperativity between subunits in voltage‐gated proton channels. Nat Struct Mol Biol 17, 51–56. [DOI] [PMC free article] [PubMed] [Google Scholar]
- Gordienko D V, Tare M, Parveen S, Fenech CJ, Robinson C & Bolton TB (1996). Voltage‐activated proton current in eosinophils from human blood. J Physiol 496, 299–316. [DOI] [PMC free article] [PubMed] [Google Scholar]
- Hii CS & Ferrante A (2007). Regulation of the NADPH oxidase activity and anti‐microbial function of neutrophils by arachidonic acid. Arch Immunol Ther Exp (Warsz) 55, 99–110. [DOI] [PubMed] [Google Scholar]
- Hoshi T, Wissuwa B & Tian Y (2013. a). Omega‐3 fatty acids lower blood pressure by directly activating large‐conductance Ca2+‐dependent K+ channels. Proc Natl Acad Sci USA 110, 4816–4821. [DOI] [PMC free article] [PubMed] [Google Scholar]
- Hoshi T, Xu R & Hou S (2013. b). A point mutation in the human Slo1 channel that impairs its sensitivity to omega‐3 docosahexaenoic acid. J Gen Physiol 142, 507–522. [DOI] [PMC free article] [PubMed] [Google Scholar]
- Kapus A, Romanek R & Grinstein S (1994). Arachidonic acid stimulates the plasma membrane H+ conductance of macrophages. J Biol Chem 269, 4736–4745. [PubMed] [Google Scholar]
- Kettenmann H, Hanisch U, Noda M & Verkhratsky A (2011). Physiology of microglia. Physiol Rev 91, 461–553. [DOI] [PubMed] [Google Scholar]
- Koch HP, Kurokawa T, Okochi Y, Sasaki M, Okamura Y & Larsson HP (2008). Multimeric nature of voltage‐gated proton channels. Proc Natl Acad Sci USA 105, 9111–9116. [DOI] [PMC free article] [PubMed] [Google Scholar]
- Li Y, Du X‐F, Liu C‐S, Wen Z‐L & Du J‐L (2012). Reciprocal regulation between resting microglial dynamics and neuronal activity in vivo. Dev Cell 23, 1189–1202. [DOI] [PubMed] [Google Scholar]
- Liin SI, Silverå Ejneby M, Barro‐Soria R, Skarsfeldt MA, Larsson JE, Starck Härlin F, Parkkari T, Bentzen BH, Schmitt N, Larsson HP & Elinder F (2015). Polyunsaturated fatty acid analogs act antiarrhythmically on the cardiac IKs channel. Proc Natl Acad Sci USA 112, 5714–5719. [DOI] [PMC free article] [PubMed] [Google Scholar]
- Lishko P V, Botchkina IL, Fedorenko A & Kirichok Y (2010). Acid extrusion from human spermatozoa is mediated by flagellar voltage‐gated proton channel. Cell 140, 327–337. [DOI] [PubMed] [Google Scholar]
- Long JZ, Li W, Booker L, Burston JJ, Kinsey SG, Schlosburg JE, Pavón FJ, Serrano AM, Selley DE, Parsons LH, Lichtman AH & Cravatt BF (2009). Selective blockade of 2‐arachidonoylglycerol hydrolysis produces cannabinoid behavioral effects. Nat Chem Biol 5, 37–44. [DOI] [PMC free article] [PubMed] [Google Scholar]
- Meves H (1994). Modulation of ion channels by arachidonic acid. Prog Neurobiol 43, 175–186. [DOI] [PubMed] [Google Scholar]
- Meves H (2008). Arachidonic acid and ion channels: an update. Br J Pharmacol 155, 4–16. [DOI] [PMC free article] [PubMed] [Google Scholar]
- Morgan D, Capasso M, Musset B, Cherny V V, Ríos E, Dyer MJS & DeCoursey TE (2009). Voltage‐gated proton channels maintain pH in human neutrophils during phagocytosis. Proc Natl Acad Sci USA 106, 18022–18027. [DOI] [PMC free article] [PubMed] [Google Scholar]
- Morgan D, Cherny V V, Finnegan A, Bollinger J, Gelb MH & DeCoursey TE (2007). Sustained activation of proton channels and NADPH oxidase in human eosinophils and murine granulocytes requires PKC but not cPLA2 alpha activity. J Physiol 579, 327–344. [DOI] [PMC free article] [PubMed] [Google Scholar]
- Musset B, Capasso M, Cherny V V, Morgan D, Bhamrah M, Dyer MJS & DeCoursey TE (2010). Identification of Thr29 as a critical phosphorylation site that activates the human proton channel Hvcn1 in leukocytes. J Biol Chem 285, 5117–5121. [DOI] [PMC free article] [PubMed] [Google Scholar]
- Nimmerjahn A, Kirchhoff F & Helmchen F (2005). Resting microglial cells are highly dynamic surveillants of brain parenchyma in vivo. Science 308, 1314–1318. [DOI] [PubMed] [Google Scholar]
- Nomura DK, Blankman JL, Simon GM, Fujioka K, Issa RS, Ward AM, Cravatt BF & Casida JE (2008). Activation of the endocannabinoid system by organophosphorus nerve agents. Nat Chem Biol 4, 373–378. [DOI] [PMC free article] [PubMed] [Google Scholar]
- Okochi Y, Sasaki M, Iwasaki H & Okamura Y (2009). Voltage‐gated proton channel is expressed on phagosomes. Biochem Biophys Res Commun 382, 274–279. [DOI] [PubMed] [Google Scholar]
- Piomelli D & Sasso O (2014). Peripheral gating of pain signals by endogenous lipid mediators. Nat Neurosci 17, 164–174. [DOI] [PMC free article] [PubMed] [Google Scholar]
- Ramsey IS, Moran MM, Chong JA & Clapham DE (2006). A voltage‐gated proton‐selective channel lacking the pore domain. Nature 440, 1213–1216. [DOI] [PMC free article] [PubMed] [Google Scholar]
- Ramsey IS, Ruchti E, Kaczmarek JS & Clapham DE (2009). Hv1 proton channels are required for high‐level NADPH oxidase‐dependent superoxide production during the phagocyte respiratory burst. Proc Natl Acad Sci USA 106, 7642–7647. [DOI] [PMC free article] [PubMed] [Google Scholar]
- Roberts‐Crowley ML, Mitra‐Ganguli T, Liu L & Rittenhouse AR (2009). Regulation of voltage‐gated Ca2+ channels by lipids. Cell Calcium 45, 589–601. [DOI] [PMC free article] [PubMed] [Google Scholar]
- Sage S, Pintado E, Mahaut‐Smith M & Merritt J (1990). Rapid kinetics of agonist‐evoked changes in cytosolic free Ca2+ concentration in fura‐2‐loaded human neutrophils. Biochem J 265, 915–918. [DOI] [PMC free article] [PubMed] [Google Scholar]
- Sasaki M, Takagi M & Okamura Y (2006). A voltage sensor‐domain protein is a voltage‐gated proton channel. Science 312, 589–592. [DOI] [PubMed] [Google Scholar]
- Schrenzel J, Daniel PL & Krause K‐H (1996). Proton currents in human eosinophils. Am J Physiol Cell Physiol 276, C1861–C1871. [DOI] [PubMed] [Google Scholar]
- Sigel E, Baur R & Rácz I (2011). The major central endocannabinoid directly acts at GABAA receptors. Proc Natl Acad Sci USA 108, 18150–18155. [DOI] [PMC free article] [PubMed] [Google Scholar]
- Sun GY, Xu J, Jensen MD & Simonyi A (2004). Phospholipase A2 in the central nervous system: implications for neurodegenerative diseases. J Lipid Res 45, 205–213. [DOI] [PubMed] [Google Scholar]
- Susztak K, Mocsai A, Ligeti E & Kapus A (1997). Electrogenic H+ pathway contributes to stimulus‐induced changes of internal pH and membrane potential in intact neutrophils: role of cytoplasmic phospholipase A2. Biochem J 510, 501–510. [DOI] [PMC free article] [PubMed] [Google Scholar]
- Takeshita K, Sakata S, Yamashita E, Fujiwara Y, Kawanabe A, Kurokawa T, Okochi Y, Matsuda M, Narita H, Okamura Y & Nakagawa A (2014). X‐ray crystal structure of voltage‐gated proton channel. Nat Struct Mol Biol 21, 352–357. [DOI] [PubMed] [Google Scholar]
- Talavera K, Staes M, Janssens A, Droogmans G & Nilius B (2004). Mechanism of arachidonic acid modulation of the T‐type Ca2+ channel alpha1G. J Gen Physiol 124, 225–238. [DOI] [PMC free article] [PubMed] [Google Scholar]
- Tombola F, Ulbrich M & Isacoff E (2008). The voltage‐gated proton channel Hv1 has two pores, each controlled by one voltage sensor. Neuron 58, 546–556. [DOI] [PMC free article] [PubMed] [Google Scholar]
- Tucker DE, Ghosh M, Ghomashchi F, Loper R, Suram S, John BS, Girotti M, Bollinger JG, Gelb MH & Leslie CC (2009). Role of phosphorylation and basic residues in the catalytic domain of cytosolic phospholipase A2alpha in regulating interfacial kinetics and binding and cellular function. J Biol Chem 284, 9596–9611. [DOI] [PMC free article] [PubMed] [Google Scholar]
- Wu L‐J, Wu G, Akhavan Sharif MR, Baker A, Jia Y, Fahey FH, Luo HR, Feener EP & Clapham DE (2012). The voltage‐gated proton channel Hv1 enhances brain damage from ischemic stroke. Nat Neurosci 15, 565–573. [DOI] [PMC free article] [PubMed] [Google Scholar]
- Xiao Y‐F, Ke Q, Wang S‐Y, Auktor K, Yang Y, Wang GK, Morgan JP & Leaf A (2001). Single point mutations affect fatty acid block of human myocardial sodium channel alpha subunit Na+ channels. Proc Natl Acad Sci USA 98, 3606–3611. [DOI] [PMC free article] [PubMed] [Google Scholar]