

Activation of the Sonic hedgehog signaling pathway affects multiple aspects of mitochondria in hippocampal neurons. It increases mitochondrial mass significantly, reduces fission, and promotes elongation. It also protects neurons against stress.
Abstract
Mitochondria are essential organelles whose biogenesis, structure, and function are regulated by many signaling pathways. We present evidence that, in hippocampal neurons, activation of the Sonic hedgehog (Shh) signaling pathway affects multiple aspects of mitochondria. Mitochondrial mass was increased significantly in neurons treated with Shh. Using biochemical and fluorescence imaging analyses, we show that Shh signaling activity reduces mitochondrial fission and promotes mitochondrial elongation, at least in part, via suppression of the mitochondrial fission protein dynamin-like GTPase Drp1. Mitochondria from Shh-treated neurons were more electron-dense, as revealed by electron microscopy, and had higher membrane potential and respiratory activity. We further show that Shh protects neurons against a variety of stresses, including the mitochondrial poison rotenone, amyloid β-peptide, hydrogen peroxide, and high levels of glutamate. Collectively our data suggest a link between Shh pathway activity and the physiological properties of mitochondria in hippocampal neurons.
INTRODUCTION
Mitochondria are a lifeline of all eukaryotic cells. In addition to their role in producing cellular energy in the form of ATP, mitochondria are highly involved in essential cellular processes such as buffering calcium and controlling apoptosis. In neurons, these mitochondrial functions have proven critical in regulating the development of young neurons (Mattson and Partin 1999; Ruthel and Hollenbeck, 2003) and the synaptic plasticity of mature neurons (Li et al., 2004). Perturbation of mitochondrial functions in neurons has been linked to the pathogenesis of several neurological disorders including stroke, Alzheimer’s disease, and Huntington’s disease (for a review, see Mattson et al., 2008).
In keeping with their importance, mitochondrial form and function are controlled and fine-tuned by a range of growth factors and signaling pathways. For instance, nerve growth factor signaling regulates mitochondrial movement in the axon of neurons (Chada and Hollenbeck, 2004). Similarly, brain-derived neurotrophic factor controls the transport and thus the distribution of mitochondria in neurons (Su et al., 2014). Moreover, the insulin-like growth factor-1 receptor has been reported to regulate mitochondrial function, which has a direct effect on synaptic transmission of hippocampal neurons (Gazit et al., 2016). Glial cell line–derived neurotrophic factor (GDNF) receptor signaling also regulates mitochondria, as down-regulation of the GDNF pathway impairs mitochondrial function in dopaminergic neurons (Meka et al., 2015).
The Sonic hedgehog (Shh) signaling pathway exists in hippocampal neurons (Yao et al., 2016), and its activity can be dynamically up-regulated in response to stimulation by Shh or Shh agonist (Petralia et al., 2011a,b; Mitchell et al., 2012; Yao et al., 2015). In earlier studies, we found that Shh signaling accelerates the outgrowth of axons and stimulates the development of presynaptic terminals in hippocampal neurons (Mitchell et al., 2012; Yao et al., 2015). In this study, we show that Shh signaling pathway activity influences multiple properties of mitochondria in hippocampal neurons.
RESULTS AND DISCUSSION
Shh pathway activity increases mitochondrial mass
We previously found that exposure to a bioactive form of Shh (ShhN; Chen et al., 2002a) or the Shh agonist SAG (Chen et al., 2002b) for 24–48 h activates the Shh signaling pathway in cultured hippocampal neurons (Yao et al., 2015). One of the assessments for cellular Shh activity is the expression level of Gli1 protein measured by immunoblot (Ingham and McMahon, 2001; Varjosalo and Taipale, 2008; Yao et al., 2015). To determine how quickly neurons would respond to ShhN, we incubated neurons with ShhN for various durations from 1 to 24 h, harvested the neurons, and analyzed Gli1 protein expression level. We found that Gli1 protein level in the hippocampal neurons increased after as little as 1 h of exposure to ShhN, and the increase continued with time in a linear manner (Figure 1A). Because 24 h of ShhN incubation strongly activated the pathway, we used this protocol for most experiments described in this study unless noted otherwise.
FIGURE 1:

Shh increases mitochondrial mass in hippocampal neurons. (A) Cultured hippocampal neurons were incubated with ShhN (10%) for various durations from 1 to 24 h. The abundance of the Shh transcriptional target, Gli1, was measured in the neuronal lysates by immunoblot using a Gli1-specific antibody. The same Gli1 blot (film) was exposed for 5 or 60 s as indicated. (B) Representative immunoblot showing COXIV protein levels in untreated control or ShhN- or SAG-treated neurons. SAG was used at 400 nM. (C) Quantification of B. Band intensity for COXIV and β-actin was measured using ImageJ. β-Actin levels were used as a normalization control. Values represent mean ± SEM; four experiments; *p < 0.05. (D) Control or ShhN-treated neurons were fixed, permeabilized, and coimmunolabeled with an antibody to the mitochondrial enzyme ATP synthase (green) and an antibody to a neuronal marker, class III β-tubulin (Tuj; red). Neurons were visualized using confocal microscopy. Representative ATP synthase images show elongated mitochondria in ShhN-treated neurons. Scale bars, 25 μm (top), 10 μm (bottom). (E) Mitochondria abundance and morphology were visualized in control or ShhN-treated neurons coincubated with a mitochondrial dye, MitoTracker Green, and a membrane marker dye, BODIPY (red). Representative live-cell images show longer mitochondria in ShhN-treated neurons. Scale bars, 100 μm (top), 10 μm (bottom). (F) Quantification of mitochondrial morphology and abundance (described in Materials and Methods). More than 80,000 MitoTracker Green–labeled mitochondria from four experiments were measured. Data represent mean ± SEM. ***p < 0.001.
In an initial survey of ShhN-treated neurons, we noticed elevated levels of mRNAs for many mitochondria-related molecules (Supplemental Table S1); among them is cytochrome C oxidase complex IV (COXIV), an inner mitochondrial membrane protein (Vogel et al., 2006; approximately twofold increase from three biological replicates by microarray). Therefore we measured the COXIV protein level in ShhN-stimulated neurons by immunoblot, using β-actin levels as a normalization control. In ShhN-treated neurons, the COXIV protein level was noticeably higher than control neurons (Figure 1, B and C). Similarly, the Shh agonist SAG also significantly increased the COXIV level (Figure 1, B and C).
We next examined the mitochondrial enzyme ATP synthase by coimmunolabeling the neurons with an antibody to ATP synthase and an antibody to a neuronal marker, class III β-tubulin (Tuj1). Although ATP synthase–labeled mitochondria were observed in both control and ShhN-treated neurons, the mitochondria were noticeably longer in ShhN-treated neurons (Figure 1D). Monitoring mitochondria with MitoTracker Green, which labels mitochondrial inner membranes (Mitra and Lippincott-Schwartz, 2010), we again observed an increase in the population of long tubular mitochondria in the ShhN-treated neurons (Figure 1E). We used a custom analysis strategy to quantify the observed changes in mitochondrial morphology and abundance (described in Materials and Methods). Measurements of >80,000 MitoTracker Green–labeled mitochondria revealed that mitochondria in ShhN-treated neurons were ∼2.5 times longer than mitochondria in the untreated control neurons (Figure 1F). In addition, we observed a greater density of mitochondria in the ShhN-treated neurons (Figure 1F). Collectively these findings suggest that Shh pathway activation in hippocampal neurons increases overall mitochondrial mass by promoting mitochondrial elongation and increasing mitochondrial number.
Shh pathway activity reduces mitochondrial fission
We observe that Shh treatment results in both an increase in the length of the individual mitochondria and more total mitochondria. Although these two effects together could contribute to increased mitochondria function (investigated later), the mechanism for generating these effects can be considered separately. Mitochondria length is regulated by the balance between mitochondria fission and fusion. The observed increase in mitochondria length could be caused by increased levels of the fusion-promoting proteins mitofusin1 (Mfn1), mitofusin2 (Mfn2), and Optic atrophy 1 (Opa1; Scott and Youle, 2010; Westermann, 2010). To investigate whether Shh signaling alters the levels of the fusion-promoting proteins, we performed Western blot analysis of neuronal lysates. We observed no changes in the levels of either Mfn1 or Mfn2 in ShhN- or SAG-treated cultures (Figure 2, A and B). We also observed no significant increase in Opa1 levels in ShhN- or SAG-treated cultures (Figure 2, C, top, and D, left).
FIGURE 2:
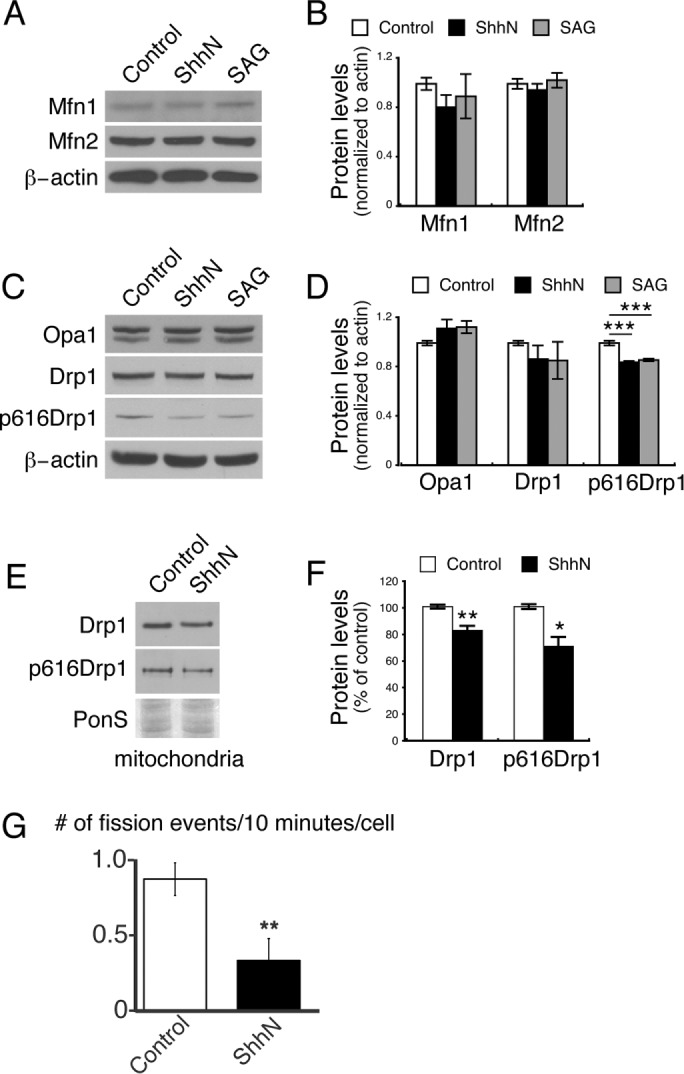
Shh reduces mitochondrial fission protein Drp1. (A) Cultured neurons were incubated with ShhN (10%) or SAG (400 nM) for 24 h, and neuronal lysates were collected. Each sample was divided into three equal sets (∼20 μg per set) and analyzed in three immunoblots using an antibody to mitofusin1 (Mfn1) or mitofusin2 (Mfn2) or β-actin. (B) Quantification of A. Band intensity was measured using ImageJ. For each sample, the intensity of the Mfn band was normalized to β-actin. The data presented are normalized to the control samples. Data represent mean ± SEM; three experiments. (C) As in A, cell lysates from control or ShhN- or SAG-treated neurons were analyzed by immunoblots. Samples run in parallel were probed for Opa1, Drp1, Drp1 serine 616–phosphorylated form (p616Drp1), or β-actin. (D) Quantification of C. The ratio of each band relative to β-actin was normalized relative to the value of the control samples. Data are mean ± SEM; ***p < 0.001, six experiments. The increased levels of Opa1 are not statistically significant (0.99 ± 0.02 in control vs. 1.11± 0.07 in ShhN-treated neurons, p = 0.16; or vs. 1.12 ± 0.02 in SAG-treated neurons, p = 0.06). (E) To assess the abundance of proteins associated with mitochondria, mitochondria were isolated (described in Materials and Methods). Immunoblot of purified mitochondria shows reduced levels of Drp1 and p616Drp1 associated with mitochondria in ShhN-treated neurons. PonS, Ponceau S–stained blot corresponding to the Drp1 area. (F) Quantification of E. The intensity of the bands in the ShhN samples is displayed as a percentage of the intensity of the bands in control cells. Data are mean ± SEM. **p < 0.01, *p < 0.05; four experiments for Drp1 and five for p616Drp1. (G) Quantification of the rate of mitochondrial fission events in ShhN vs. control cells (mean ± SEM). Mitochondria in control or ShhN-treated neurons were labeled with MitoTracker Green and imaged at 10-s intervals for 10 min using a spinning-disk confocal microscope. Fission events were visually identified during postacquisition review of the data sets. The graph displays the mean number of mitochondrial fission events every 10 min per cell. **p < 0.01.
We next examined the mitochondrial fission protein dynamin-like GTPase Drp1. Phosphorylation of Drp at serine 616 increases the fission activity of the protein (Taguchi et al., 2007; Chang and Blackstone, 2010). Decreased Drp1 activity could contribute to the observed increase in mitochondrial length, so we quantified the levels of total Drp1 and its serine 616–phosphorylated form (phos616 Drp1 or p616Drp1). Although we did not see a consistent change in total Drp1 (Figure 2, C and D, middle), the level of phos616Drp1was reduced significantly in ShhN- or SAG-treated neurons (Figure 2, C and D, right). Because Drp1 is recruited to fission sites on the mitochondrial surface (Scott and Youle, 2010; Westermann, 2010), we purified mitochondria from the ShhN-treated neurons and the untreated control neurons and examined Drp1 associated with mitochondria. Immunoblot analysis revealed a significant reduction of mitochondria-associated Drp1 and phos616 Drp1 in the ShhN-treated neurons (Figure 2, E and F). These results suggested that Shh signaling alters mitochondrial length by reducing fission events through decreased Drp1 activity.
We tested this hypothesis using live confocal fluorescence imaging of mitochondria in control versus ShhN-treated neurons and observed that ShhN treatment caused a significant reduction in the number of mitochondrial fission events in ShhN neurons (0.33 fission event every 10 min per cell, n = 10 cells) compared with the control (0.86 fission event every 10 min per cell, n = 10 cells; p < 0.005; Figure 2G). Taken together, our results support the hypothesis that Shh induces mitochondrial elongation in hippocampal neurons in part by reducing phos616 Drp1 levels and activity, thereby reducing the overall rate of mitochondrial fission.
In addition to longer mitochondria, Shh stimulation causes more than twice as many mitochondria to accumulate in neurons. Taken alone, one would expect the observed decrease in fission events to cause a decrease in the mitochondria population. It is known, however, that mitochondria elongation decreases degradation of mitochondria by mitophagy (Rambold et al., 2011). Although Shh stimulates some forms of autophagy in hippocampal neurons (Petralia et al., 2013), the increased mitochondria length due to decreased fission upon Shh treatment likely protects mitochondria from degradation (Gomes et al., 2011).
Emerging evidence suggests a functional link between Drp1, actin filament dynamics, and actin regulatory proteins (Korobova et al., 2013, 2014; Hatch et al., 2014; Ji et al., 2015; Manor et al., 2015), including cofilin (Li et al., 2014; Prudent and McBride, 2016). Down-regulation of cofilin affects Drp1-mediated mitochondrial fission, leading to the elongation of mitochondria (Li et al., 2014). Because Shh pathway activity in the hippocampal neurons effectively down-regulates cofilin (Yao et al., 2015), it is plausible that the activity of the Shh signaling pathway could influence mitochondria by regulating both Drp1 and cofilin.
Shh pathway activity changes mitochondrial ultrastructural appearance
We next examined the ultrastructure of Shh-stimulated mitochondria using transmission electron microscopy. Considering great experimental variables and insufficient resolution of internal structures in mitochondria of these cultured neurons, we focused on comparing mitochondrial overall appearance in the ShhN-treated neurons to the untreated control neurons. The noticeable difference between the two groups was the generally darker mitochondria in the ShhN-treated neurons (Figure 3, A and B, and Supplemental Figures S1 and S2). To make objective comparisons, we quantified the intensity of mitochondria relative to the intensity of the cytoplasm of the same neuron. Measurements of 984 mitochondria confirmed that the average intensity of mitochondria in ShhN-treated neurons was significantly higher than that of mitochondria in untreated control neurons (ratio of mitochondrial intensity to cytoplasmic intensity for 2-d ShhN treatment: ShhN 32.0 ± 0.85 vs. control 23.8 ± 1.14, p < 0.001; n ≥ 519 mitochondria, cultures from three rats; 3-d ShhN treatment: ShhN 39.6 ± 1.34 vs. control 26.6 ± 0.91, p < 0.001; n ≥ 465 mitochondria; cultures from three rats; Figure 3C).
FIGURE 3:

Shh alters mitochondrial ultrastructure. (A, B) Hippocampal neurons were treated with ShhN for 2 or 3 d and processed for electron microscopy. Representative electron micrographs (five examples for each group) show the range of mitochondrial structures and density in control and ShhN-treated neurons. Many noticeably darker mitochondria are seen in the ShhN-treated neurons. Most micrographs show synaptic regions where axons with presynaptic terminals (pre) and dendrites can be distinguished readily. Scale bar, 500 nm (bottom left and top three), 1 μm (otherwise). (C) Mitochondrial intensity was measured using ImageJ. In each electron micrograph, a random area over the cytoplasm (mitochondria-free) was selected, and intensity (mean gray value) was measured. The same selected area was then moved over a mitochondrion, and intensity was measured. For each micrograph, three randomly selected mitochondria were measured and the ratio of each mitochondrial intensity to the cytoplasmic intensity was calculated (mean ± SEM; ***p < 0.001, ≥519 mitochondria for 2-d treatment and ≥ 465 for 3-d treatment). (D) Mitochondria were purified from control and ShhN-treated neurons, and the solubilized proteins were separated by SDS–PAGE. Immunoblot analysis shows that the inner membrane protein COXIV increases upon ShhN treatment, but the level of the outer membrane protein VDAC is relatively unchanged. (E) Quantification of D. The intensities of the bands were quantified using ImageJ. The intensity of the bands in the ShhN samples is normalized to the value in the control samples. *p < 0.05, four experiments.
Significant advances have been made in understanding the morphology and structure of mitochondria. The biological relevance of mitochondrial electron density seen under electron microscopy, however, is not understood. In an early electron microscopic study of rat liver cells, mitochondria became lighter or less electron-dense after starvation and then refeeding (Rouiller and Bernhard, 1956). In a more recent study of mouse embryonic fibroblasts, mitochondria were darker after starvation under some experimental conditions (Gomes et al., 2011). These observations imply, at least in nonneuronal cells, a correlation between mitochondrial electron density and their activity. In the case of neuronal cells, the differences in mitochondrial electron density seem to be only incidentally observed. In an electron microscopic characterization of cultured hippocampal neurons—the neuronal type studied in this work, mitochondria appeared darker in axons than in dendrites (Bartlett and Banker, 1984), although the difference was not explicitly investigated. A similar difference was also seen in auditory nerves, for which presynaptic mitochondria appeared noticeably darker (Redd et al., 2000).
One might speculate that darker mitochondria are indicative of greater amounts of mitochondrial proteins, particularly those residing on the inner membranes of mitochondria (Gomes et al., 2011). Because the COXIV protein resides in the mitochondrial inner membranes (Vogel et al., 2006) and its level is markedly increased in the total cell lysates of ShhN-treated neurons (Figure 1, B and C), we compared the COXIV protein level in mitochondria purified from ShhN-treated neurons to those from control neurons. Immunoblot analysis revealed that mitochondrial COXIV was approximately fourfold higher in ShhN-treated than in control neurons (4.27 ± 0.98 in ShhN-treated vs. 0.99 ± 0.03 in control, p = 0.045, n = 4; Figure 3, D and E).
Shh pathway activity increases mitochondrial oxidative phosphorylation activity
Next we examined mitochondrial function using two approaches. First, we coincubated the neurons with two dyes: CMXRos, a red fluorescent dye that accumulates in mitochondrial membranes based on their membrane potential, and MitoTracker Green, which labels mitochondria irrespective of their membrane potential (Mitra and Lippincott-Schwartz, 2010). We used the ratio of CMXRos to MitoTracker Green to measure the mitochondrial membrane potential in the ShhN-treated and the untreated control neurons. We found that ShhN-treated neurons have substantially higher (∼10-fold higher) CMXRos:MitoTracker Green ratios than control neurons (p < 0.001; Figure 4, A and B). Second, we measured the cellular oxygen consumption rate (OCR) using the Seahorse system (Ferrick et al., 2008) and compared mitochondrial respiration and ATP-linked respiration between ShhN-treated and control neurons. The ShhN-treated neurons have significantly higher basal and maximal respiratory activities (Figure 4, C and D), as well as increased levels of ATP-linked respiration (Figure 4E). These findings suggest that Shh signaling activity shifts hippocampal neurons from a lower energy–producing, anaerobic metabolic state mainly dependent on glycolysis to a higher energy–producing, aerobic state that also employs oxidative phosphorylation for ATP production (Wu et al., 2007).
FIGURE 4:
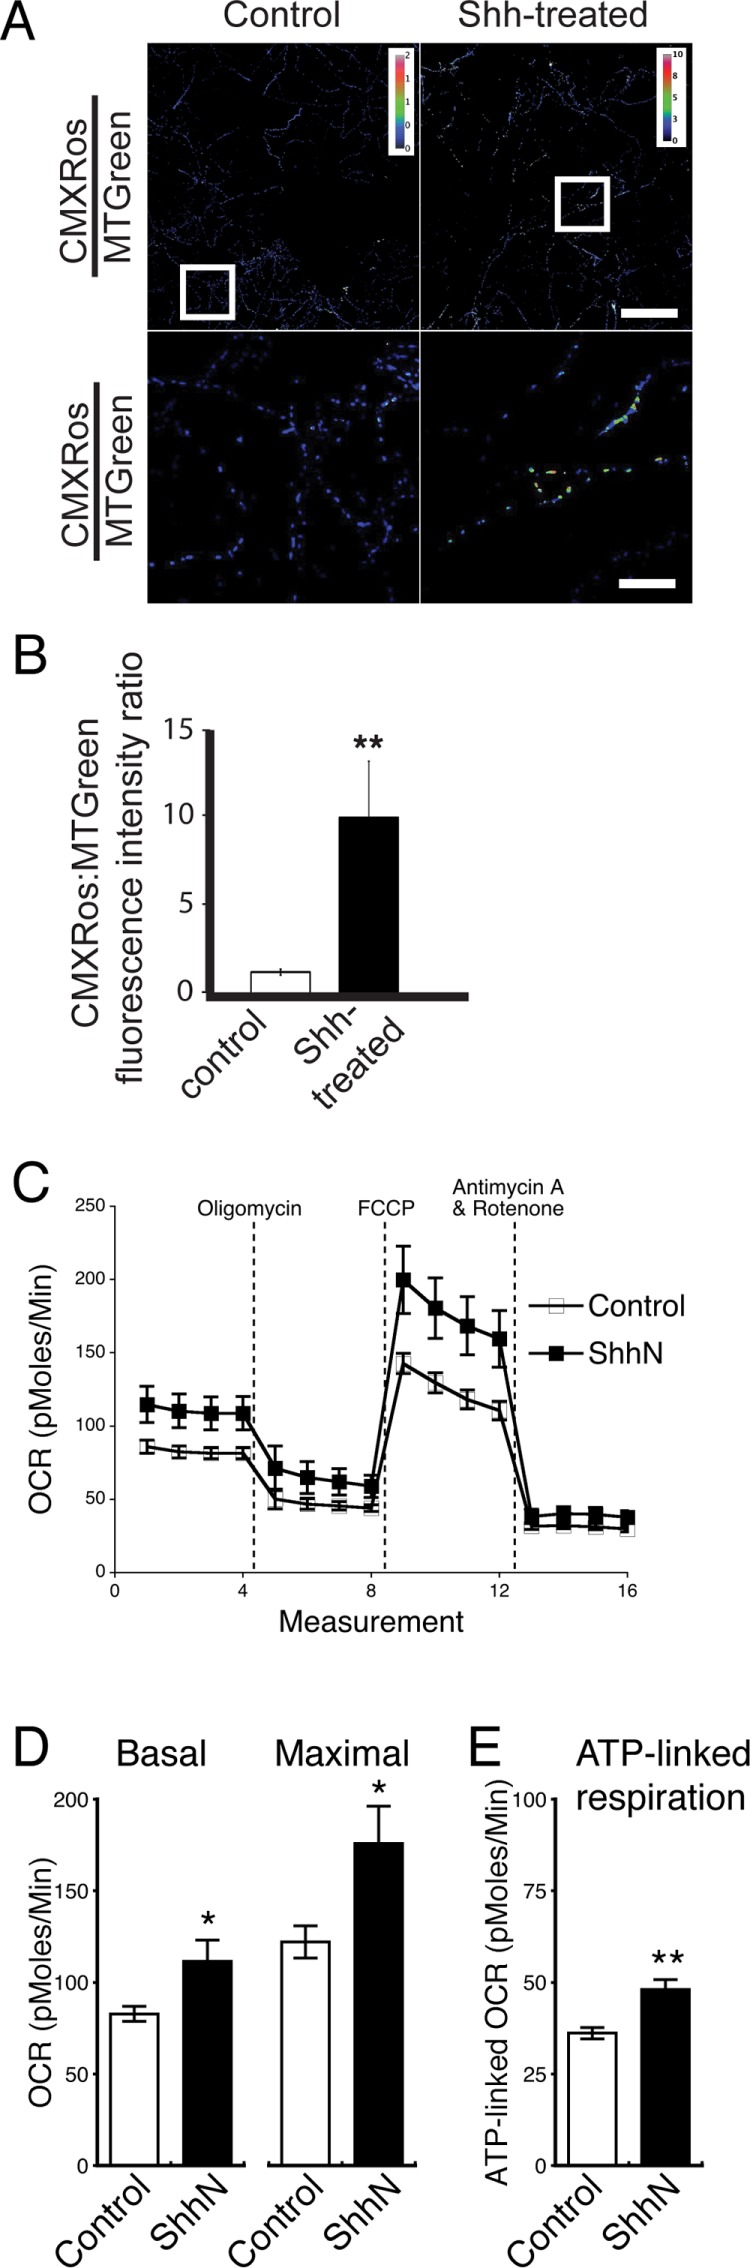
Shh increases mitochondrial oxidative phosphorylation activity. (A) Control or ShhN-treated neurons were coincubated with CMXRos and MitoTracker Green. Representative images show a heat map of the ratio of CMXRos to MitoTracker Green in live, control, and ShhN-treated neurons. Bottom, magnifications of the regions indicated at the top. Scale bars, 100 μm (top), 20 μm (bottom). (B) Quantification of the ratio of CMXRos to MitoTracker Green in control vs. ShhN-treated neurons (six experiments, with ∼10 cells in each experiment; mean ± SEM; **p < 0.01). (C) OCR of control and ShhN-treated neurons (described in Materials and Methods). (D) Average values of basal and maximal respiration capacity in control and ShhN-treated neurons. (E) Higher ATP-linked respiration in ShhN-treated neurons. For C–E, six experiments. Mean ± SEM. **p < 0.01, *p < 0.05.
Shh pathway activity protects neurons against stress
Finally, we investigated the functional consequence of the observed Shh-enhanced mitochondrial activity in the hippocampal neurons by examining the effect of several toxins. The neurons were first treated with the Shh-agonist SAG for 24 h and then exposed to a neurotoxic stressor for an additional 24 h. Cell viability was measured using a colorimetric cell viability assay. The neurons were exposed to the neurotoxins for 24 h rather than a shorter period of time to mimic chronic neurological stress or disease rather than an acute insult.
The neurotoxic agents used were amyloid β-peptide (Aβ; amino acids 1–42), hydrogen peroxide, glutamate, and rotenone. Aβ was used to mimic the conditions neurons experience as Aβ aggregates and accumulates in the brain in Alzheimer’s disease. Aggregating Aβ generates reactive oxygen species that cause membrane lipid peroxidation, impaired calcium handling, and mitochondrial dysfunction in neurons (Mattson et al., 1992; Keller et al., 1997; Mark et al., 1997; Prasansuklab and Tencomnao, 2013). Hydrogen peroxide treatment was used to mimic cellular oxidative stress, whereas glutamate induces excitotoxicity, and rotenone reduces mitochondrial function by inhibiting complex I of the mitochondrial electron transport chain. We found that in the neurons without SAG treatment, each toxin significantly compromised neuronal viability: 39.3% reduction with 7.5 µM Aβ, 30.0% reduction with 15 µM hydrogen peroxide, 29% reduction with 50 µM glutamate treatment, and 19.8% reduction with 75 nM rotenone (Figure 5, A and B). Preexposure to and cotreatment with SAG significantly attenuated the compromised cell viability caused by all toxins tested: 23.2, 17.4, 14, and 12.9% for neurons treated with Aβ, hydrogen peroxide, glutamate, and rotenone, respectively (Figure 5, A and B). These results indicate that Shh signaling can protect neurons, at least to some extent, against death caused by oxidative, excitotoxic, and metabolic stress.
FIGURE 5:
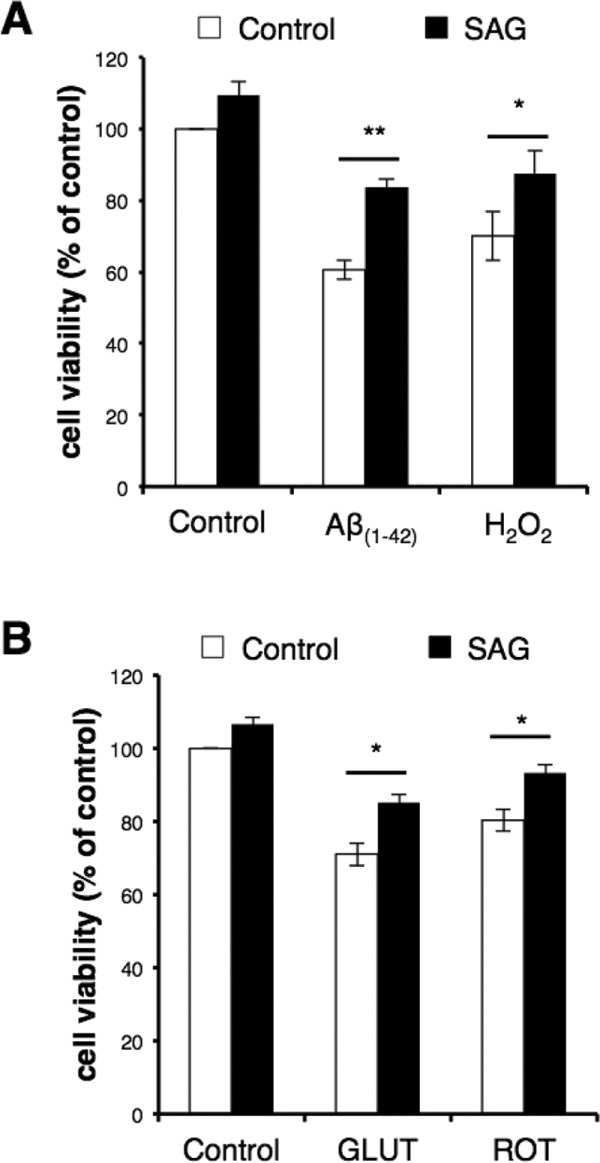
Shh protects neurons against neurotoxins. Hippocampal neurons were treated with SAG (200 nM) on culture day 6 (A; Aβ and H2O2 experiments) or 7 (B; glutamate and rotenone experiments) for 24 h, followed by coincubation with the indicated neurotoxin for an additional 24 h. Cell viability was then assessed using a colorimetric assay (described in Materials and Methods). Data are plotted as percentage viability compared with the untreated control cells. All toxins reduced cell viability of the neurons. Treatment with SAG significantly improved cell viability reduced by each toxin (**p < 0.01, *p < 0.05; at least three experiments).
In this study, we provide evidence that Shh, well known as a developmental morphogen, can influence mitochondrial abundance, morphology, function, and stress resistance in hippocampal neurons. A previous report of cultured cerebral cortical neurons provided evidence that Shh can protect neurons against metabolic stress induced by the succinate dehydrogenase inhibitor 3-nitropropionic acid (Wu et al., 2009). However, the underlying mechanism was not investigated. We found that Shh signaling increases the size and number of mitochondria and enhances mitochondrial respiration and ATP production in hippocampal neurons. Because of their ongoing electrical activity (action potentials) and excitatory synaptic transmission (mediated by glutamate), neurons have a very high ATP demand. Accordingly, decrements in ATP levels render neurons vulnerable to excitotoxicity, a type of neuronal death known to occur in ischemic stroke and which also likely occurs in Alzheimer’s, Parkinson’s, and Huntington’s diseases (Mattson, 2003). We found that Shh protected hippocampal neurons against glutamate-induced excitotoxicity and against death induced by the mitochondrial toxin rotenone and Aβ, both of which have been shown to increase the vulnerability of neurons to excitotoxicity (Mattson et al., 1992; Kanki et al., 2004). Our findings suggest that, by increasing mitochondrial mass and function, Shh can protect neurons against pathological stressors that cause or promote neuronal dysfunction and degeneration.
Shh-enhanced mitochondrial function possibly plays a role in other cellular processes in neurons as well. For example, we previously found that Shh pathway activity selectively stimulates axon outgrowth of hippocampal neurons (Yao et al., 2015), although we did not determine whether mitochondria were involved. However, other studies demonstrated the importance of mitochondria in axonal growth (Mattson and Partin, 1999; Vaarmann et al., 2016). Therefore it is reasonable to consider that up-regulation of mitochondrial function by the Shh signaling pathway is important for Shh-stimulated axon outgrowth in hippocampal neurons (Yao et al., 2015) and other types of neurons (Charron et al., 2003; Parra and Zou, 2010; Wilson and Stoeckli, 2013).
What is the mechanism underlying the Shh-induced mitochondrial upregulation? AMP-activated protein kinase (AMPK) plays a role in mitochondrial biogenesis (Hardie, 2011). Although it was recently reported that activation of AMPK suppresses Shh signaling pathway activity in tumor cells (Li et al., 2015), it is unknown whether the opposite holds, that is, whether Shh signaling affects AMPK. Our preliminary observations indicate that Shh’s effect on AMPK is, at least in the hippocampal neurons, either nonexistent or negligibly small (unpublished data).
Finally, it is of interest to note that Shh signaling has been proposed to have an opposite effect on mitochondria in cerebellar granule neuron precursors (CGNPs; Malhotra et al., 2016). One distinction between CGNPs and hippocampal neurons is that the former are proliferating but the latter are differentiated and postmitotic. Whether the differences in response to Shh signaling arise from intrinsic differences in cell types, developmental stages, or associated neural circuits are important questions. The discrepancy between our findings and those by Malhotra et al. (2016) could also result from differences in experimental conditions and design. For example, they used recombinant Shh, whose bioactivity appeared to be negligible comparing to that of ShhN (Supplemental Figure S3).
MATERIALS AND METHODS
Animals
All animal procedures were approved by the National Institute on Aging Animal Care and Use Committee and complied with the National Institutes of Health Guide for Care and Use of Laboratory Animals. Timed pregnant female Sprague Dawley rats were used as the source of embryonic brains to establish cultures of hippocampal neurons.
Reagents
HEK293 cells that overexpress ShhN were provided by James K. Chen (Stanford University, Stanford, CA). ShhN-conditioned medium from ShhN-overexpressing 293 cells was prepared exactly as described (Chen et al., 2002a,b). The efficacy of ShhN was validated using the Shh-light2 assay (Taipale et al, 2000; Mitchell et al., 2012). HEK293 cell-conditioned medium was used as the control. ShhN, and control media were used at 10% for all experiments. SAG was purchased from Alexis Biochemicals. MitoTracker Green, BODIPY, and CMXRos were from Invitrogen. Anti-COXIV (11967), anti-Drp1 (14647), anti–phospho-Drp1 (ser616; 4494), anti-VDAC (4661), and anti-Gli1 (2534) antibodies were from Cell Signaling Technology. Anti-ATP synthase antibody was from Millipore (MAB3494). Anti-mitofusin1 (ab128575) and anti-mitofusin2 (ab1010550 were from Abcam. Anti-Opa1 antibody was from BD Biosciences (612606). Anti-Tuj1 antibody was from Covance (MMS-435P). Anti–β-actin antibody was from Sigma-Aldrich (5441 and A2066). Aβ1-42 peptide was from Bachem.
Hippocampal neuron culture
Cultures of hippocampal neurons were prepared from embryonic day 18 rat brains as described (Mattson et al., 1989; Kaech and Banker, 2006; Yao et al., 2015). Dissociated neurons were plated at a density of ∼100–150 cells/mm2.
The neurons were grown in Neurobasal medium supplemented with B27 (Invitrogen). For immunofluorescence and live-cell imaging, the neurons were grown on polylysine (1 mg/ml)-coated glass coverslips (no. 1.5). For immunoblotting, the neurons were grown in polylysine (0.1 mg/ml)-coated plastic dishes. For most experiments, the age of the cultures used was 7–10 days in vitro (DIV); for electron microcopy, the age of the cultures used was ∼19–20 DIV.
Immunoblot analysis
Cells were lysed in RIPA buffer (20 mM Tris-HCl, 150 mM NaCl, 1 mM EDTA, 1 mM ethylene glycol tetraacetic acid, 1% NP-40, 2.5 mM sodium pyrophosphate, 1 mM sodium orthovanadate, and 1% sodium deoxycholate) containing protease inhibitors (Halt Protease Inhibitor Cocktail; Thermo Scientific). The lysed cells were centrifuged at 10,000 × g for 10 min at 4°C. The supernatant was collected, and the amount of total proteins was estimated with a BCA Protein Assay Kit (Pierce Biotechnology). Protein samples were separated by 4–20% Bis-Tris SDS–PAGE and transferred to nitrocellulose membranes. After incubation with blocking buffer (5% dry milk and 0.05% Tween 20 in phosphate-buffered saline [PBS]), the membranes were incubated overnight at 4°C in the blocking buffer containing one of the antibodies Gli1, COXIV, mitofusin1, mitofusin2, Opa1, Drp1, phos616Drp1, or VDAC (all at 1:1000 dilution) or β-actin (1:5000). The membranes were then washed (0.1% Tween 20 in PBS) and incubated with appropriate peroxidase-conjugated secondary antibodies. The proteins were visualized using a chemiluminescence kit from Pierce. The intensity of protein bands on films was scanned and analyzed using ImageJ software.
Mitochondria were isolated using a mitochondria isolation kit for cultured cells (89874; Thermo Scientific) following the manufacturer’s instruction. Approximately 108 cultured neurons were used for each sample. Soluble mitochondrial proteins were extracted from isolated mitochondria using the same RIPA buffer as described for the neuronal lysates.
Immunocytochemistry, fluorescence microscopy, and live-cell imaging
Immunofluorescence labeling was performed using a previously described protocol (Yao et al., 2015). Briefly, neurons were fixed in 4% paraformaldehyde (PFA) and 4% sucrose for 15 min. After permeabilization in 0.2% Triton X-100 and blocking in 10% bovine serum albumin, the neurons were incubated with ATP synthase antibody (1:100) and Tuj1 antibody (1:1000) overnight at 4°C. After being washed, the neurons were incubated with fluorescence-tagged secondary antibodies. The glass coverslips containing the labeled neurons were mounted in Prolong Gold antifade reagent (Thermo Scientific).
Confocal images were acquired with an Apochromat 63×/1.4 numerical aperture (NA) objective lens (Carl Zeiss) on a Marinas spinning-disk confocal imaging system (Intelligent Imaging Innovations) using an electron-multiplying charge-coupled device (EMCCD) camera (Evolve; Photometrics) or a 63×/1.4 NA objective (Nikon Instruments) on a Yokogawa CSU-X1 spinning-disk system using an EMCCD camera (Evolve). Large–field-of-view images were acquired using the tiling function in NES software (Nikon Instruments). Individual 16-bit tiff image files were exported and were processed using ImageJ. For live imaging of mitochondrial fission events, cells were treated with 50 nM MitoTracker for 2 min and then washed immediately before imaging. Imaging was performed in a CO2- and temperature-controlled chamber in phenol-free culture medium. We imaged control and Shh-treated neurons labeled with MitoTracker every 10 s for 10 min using a Nikon spinning-disk confocal microscope with a 60×/1.4 NA objective and Evolve EMCCD camera. Mitochondrial fission events from 10 cells from three different cultures were scored by visually tracking events in which single mitochondria (visualized using MitoTracker) divided into two (not necessarily of equal size). For mitochondrial membrane potential ratio measurements, cells were simultaneously treated with 20 nM MitoTracker Green and MitoTracker CMXRos for 5 min and then washed immediately before imaging.
Image processing and analysis
For mitochondria and neurite length measurements, the images were first processed in MATLAB for thresholding. The first step of processing each image was to use a contrast-limited adaptive histogram equalization with the image divided into 11 rows and 11 columns. The clip limit used was calculated based on the entropy of the resulting image, as suggested by Min et al. (2013). Next the image was denoised using a Gaussian filter with a large radius and sigma value and subtracting the result from the original image. The image was then normalized, and background was subtracted again. The image was then thresholded and despeckled using a median filter. Finally, the image was skeletonized, and the length of each mitochondrion was calculated based on its skeletonized area. Similarly, the total lengths of the neurites were calculated based on the sum of the area of all the skeletonized neurites. The number of mitochondria per micrometer neurite was calculated as the ratio of the total number of mitochondria to the sum of all of the lengths of the neurites in each image. Similarly, the total length of mitochondria per micrometer neurite was calculated as the sum of the lengths of all the mitochondria divided by the sum of the lengths of all the neurites in each image. For mitochondrial membrane potential measurements, the ratio of MitoTracker CMXRos to MitoTracker Green fluorescence was determined using ImageJ’s masking and image calculator functions.
Electron microscopy
Electron microscopy was performed as described previously (Petralia and Wenthold, 1999, Petralia et al., 2010). On ∼DIV 20, neurons were treated with ShhN. After 2–3 d, neurons were fixed in 2% PFA/2%glutaraldehyde in phosphate buffer at room temperature for 30 min. After washes, they were postfixed in 1% osmium tetroxide in cacodylate buffer for 30 min and dehydrated in an ethanol series (including 10 min in 1% uranyl acetate in 50% ethanol) and then in propylene oxide and embedded in Epon. The glass coverslip was removed with hydrofluoric acid, and thin sections were stained with lead citrate and examined in JEOL JEM-1010 and JEM-2100 electron microscopes.
Four culture experiments were performed. From two of these, an observer (R.S.P.) who was unaware of the identity of the groups photographed randomly selected fields from the control and ShhN-treated neurons. A second observer (P.J.Y.), who also was unaware of the identity of the groups, performed a qualitative analysis of the micrographs. Mitochondrial intensity was then measured using ImageJ. In each electron micrograph, a random mitochondria-free area over the cytoplasm was selected and drawn, and the intensity (mean gray value) within this area was measured and recorded. The same drawn area was subsequently moved over a mitochondrion, and intensity was measured. In each micrograph, three mitochondria were measured, and the ratio of each mitochondrial intensity to the cytoplasmic intensity was calculated. The total number of mitochondria measured is indicated in the legend to Figure 3.
Mitochondrial activity measurement
Mitochondrial activity was assessed using the Seahorse XF96 Analyzer (Seahorse Bioscience; Ferrick et al., 2008) according to the manufacturer’s instructions. Briefly, neurons were grown in Seahorse 96-well plates. After a 24-h incubation with ShhN, OCR was measured after sequential addition of 2 μM oligomycin, 1 μM FCCP (carbonilcyanide p-triflouromethoxyphenylhydrazone), and 5 μM rotenone/antimycin A. These various inhibitors allowed measurement of different components of mitochondrial respiration. Oligomycin inhibited mitochondrial ATP synthase activity and facilitated measurement of ATP-linked respiration. FCCP uncoupled the mitochondrial proton gradient and disrupted the mitochondrial membrane potential, allowing measurement of maximal respiration. Rotenone inhibited mitochondrial complex I, and antimycin inhibited mitochondrial complex III. The use of rotenone and antimycin together turned off mitochondrial respiration and allowed measurement of non–mitochondrial linked respiration.
Neurotoxicity assay
On DIV 6 or 7, neurons were treated with SAG (200 nM). After 24 h, H2O2 (15 µM), glutamate (50 µM), rotenone (75 nM), or oligomerized Aβ1-42 peptide (7.5 µM) was added for another 24 h. These toxins were previously titrated to reduce cell viability ∼20–40% after 24 h. Cell viability was assessed using an MTS cell viability assay per manufacturer’s instructions (CellTiter Aqueous One Solution Cell Proliferation Assay; Promega, Madison, WI). Briefly, 20 µl of CellTiter Aqueous One Solution was added to cells in 100 µl of culture medium. Cells were incubated at 37o C in 5% CO2 and A490 measured with a Synergy H1 Microplate Reader (Biotek, Winooski, VT). The MTS tetrazolium compound was reduced to a colored formazan product by metabolically active cells. The amount of formazan measured at A490 was proportional to the number of metabolically active cells. Percentage viability was calculated compared with that of the untreated control cells (100% viability).
Data analysis and statistics
Statistical comparisons were performed by using Student’s t test (KaleidaGraph). All results are expressed as mean ± SEM.
Supplementary Material
Acknowledgments
This study was supported by the Intramural Research Programs of the National Institutes of Health/National Institute on Aging, National Institute on Deafness and Other Communication Disorders, and National Institute of Child Health and Human Development. The Advanced Imaging Core code is ZIC DC000081.
Abbreviations used:
- Abeta
amyloid beta-peptide
- COXIV
cytochrome C oxidase complex IV
- Shh
Sonic hedgehog
- Tuj1
class III beta-tubulin
Footnotes
This article was published online ahead of print in MBoC in Press (http://www.molbiolcell.org/cgi/doi/10.1091/mbc.E16-07-0553) on December 8, 2016.
REFERENCES
- Bartlett WP, Banker GA. An electron microscopic study of the development of axons and dendrites by hippocampal neurons in culture. I. Cells which develop without intercellular contacts. J Neurosci. 1984;4:1944–1953. doi: 10.1523/JNEUROSCI.04-08-01944.1984. [DOI] [PMC free article] [PubMed] [Google Scholar]
- Chada SR, Hollenbeck PJ. Nerve growth factor signaling regulates motility and docking of axonal mitochondria. Curr Biol. 2004;14:1272–1276. doi: 10.1016/j.cub.2004.07.027. [DOI] [PubMed] [Google Scholar]
- Chang CR, Blackstone C. Dynamic regulation of mitochondrial fission through modification of the dynamin-related protein Drp1. Ann NY Acad Sci. 2010;1201:34–39. doi: 10.1111/j.1749-6632.2010.05629.x. [DOI] [PMC free article] [PubMed] [Google Scholar]
- Charron F, Stein E, Jeong J, McMahon AP, Tessier-Lavigne M. The morphogen sonic hedgehog is an axonal chemoattractant that collaborates with netrin-1 in midline axon guidance. Cell. 2003;113:11–23. doi: 10.1016/s0092-8674(03)00199-5. [DOI] [PubMed] [Google Scholar]
- Chen JK, Taipale J, Cooper MK, Beachy PA. Inhibition of Hedgehog signaling by direct binding of cyclopamine to Smoothened. Genes Dev. 2002a;16:2743–2748. doi: 10.1101/gad.1025302. [DOI] [PMC free article] [PubMed] [Google Scholar]
- Chen JK, Taipale J, Young KE, Maiti T, Beachy PA. Small molecule modulation of Smoothened activity. Proc Natl Acad Sci USA. 2002b;99:14071–14076. doi: 10.1073/pnas.182542899. [DOI] [PMC free article] [PubMed] [Google Scholar]
- Ferrick DA, Neilson A, Beeson C. Advances in measuring cellular bioenergetics using extracellular flux. Drug Discov Today. 2008;13:268–274. doi: 10.1016/j.drudis.2007.12.008. [DOI] [PubMed] [Google Scholar]
- Gazit N, Vertkin I, Shapira I, Helm M, Slomowitz E, Sheiba M, Mor Y, Rizzoli S, Slutsky I. IGF-1 receptor differentially regulates spontaneous and evoked transmission via mitochondria at hippocampal synapses. Neuron. 2016;89:583–597. doi: 10.1016/j.neuron.2015.12.034. [DOI] [PMC free article] [PubMed] [Google Scholar]
- Gomes LC, Di Benedetto G, Scorrano L. During autophagy mitochondria elongate, are spared from degradation and sustain cell viability. Nat Cell Biol. 2011;13:589–598. doi: 10.1038/ncb2220. [DOI] [PMC free article] [PubMed] [Google Scholar]
- Hardie DG. AMP-activated protein kinase: an energy sensor that regulates all aspects of cell function. Genes Dev. 2011;25:1895–1908. doi: 10.1101/gad.17420111. [DOI] [PMC free article] [PubMed] [Google Scholar]
- Hatch AL, Gurel PS, Higgs HN. Novel roles for actin in mitochondrial fission. J Cell Sci. 2014;127:4549–4560. doi: 10.1242/jcs.153791. [DOI] [PMC free article] [PubMed] [Google Scholar]
- Ingham PW, McMahon AP. Hedgehog signaling in animal development: paradigms and principles. Genes Dev. 2001;15:3059–3087. doi: 10.1101/gad.938601. [DOI] [PubMed] [Google Scholar]
- Ji WK, Hatch AL, Merrill RA, Strack S, Higgs HN. Actin filaments target the oligomeric maturation of the dynamin GTPase Drp1 to mitochondrial fission sites. Elife. 2015;4:e11553. doi: 10.7554/eLife.11553. [DOI] [PMC free article] [PubMed] [Google Scholar]
- Kaech S, Banker G. Culturing hippocampal neurons. Nat Protoc. 2006;1:2406–2415. doi: 10.1038/nprot.2006.356. [DOI] [PubMed] [Google Scholar]
- Kanki R, Nakamizo T, Yamashita H, Kihara T, Sawada H, Uemura K, Kawamata J, Shibasaki H, Akaike A, Shimohama S. Effects of mitochondrial dysfunction on glutamate receptor-mediated neurotoxicity in cultured rat spinal motor neurons. Brain Res. 2004;1015:73–81. doi: 10.1016/j.brainres.2004.04.044. [DOI] [PubMed] [Google Scholar]
- Keller Pang JN Z, Geddes JW, Begley JG, Germeyer A, Waeg G, Mattson MP. Impairment of glucose and glutamate transport and induction of mitochondrial oxidative stress and dysfunction in synaptosomes by amyloid beta-peptide: role of the lipid peroxidation product 4-hydroxynonenal. J Neurochem. 1997;69:273–284. doi: 10.1046/j.1471-4159.1997.69010273.x. [DOI] [PubMed] [Google Scholar]
- Korobova F, Gauvin TJ, Higgs HN. A role for myosin II in mammalian mitochondrial fission. Curr Biol. 2014;24:409–414. doi: 10.1016/j.cub.2013.12.032. [DOI] [PMC free article] [PubMed] [Google Scholar]
- Korobova F, Ramabhadran V, Higgs HN. An actin-dependent step in mitochondrial fission mediated by the ER-associated formin INF2. Science. 2013;339:464–467. doi: 10.1126/science.1228360. [DOI] [PMC free article] [PubMed] [Google Scholar]
- Li S, Xu S, Roelofs BA, Boyman L, Lederer WJ, Sesaki H, Karbowski M. Transient assembly of F-actin on the outer mitochondrial membrane contributes to mitochondrial fission. J Cell Biol. 2014;208:109–123. doi: 10.1083/jcb.201404050. [DOI] [PMC free article] [PubMed] [Google Scholar]
- Li YH, Luo J, Mosley YY, Hedrick VE, Paul LN, Chang J, Zhang G, Wang YK, Banko MR, Brunet A, et al. AMP-activated protein kinase directly phosphorylates and destabilizes hedgehog pathway transcription factor GLI1 in medulloblastoma. Cell Rep. 2015;12:599–609. doi: 10.1016/j.celrep.2015.06.054. [DOI] [PMC free article] [PubMed] [Google Scholar]
- Li Z, Okamoto K, Hayashi Y, Sheng M. The importance of dendritic mitochondria in the morphogenesis and plasticity of spines and synapses. Cell. 2004;119:873–887. doi: 10.1016/j.cell.2004.11.003. [DOI] [PubMed] [Google Scholar]
- Malhotra A, Dey A, Prasad N, Kenney AM. Sonic hedgehog signaling drives mitochondrial fragmentation by suppressing mitofusins in cerebellar granule neuron precursors and medulloblastoma. Mol Cancer Res. 2016;14:114–124. doi: 10.1158/1541-7786.MCR-15-0278. [DOI] [PMC free article] [PubMed] [Google Scholar]
- Manor U, Bartholomew S, Golani G, Christenson E, Kozlov M, Higgs H, Spudich J, Lippincott-Schwartz J. A mitochondria-anchored isoform of the actin-nucleating spire protein regulates mitochondrial division. Elife. 2015;4:e08828. doi: 10.7554/eLife.08828. [DOI] [PMC free article] [PubMed] [Google Scholar]
- Mark RJ, Lovell MA, Markesbery WR, Uchida K, Mattson MP. A role for 4-hydroxynonenal, an aldehydic product of lipid peroxidation, in disruption of ion homeostasis and neuronal death induced by amyloid beta-peptide. J Neurochem. 1997;68:255–264. doi: 10.1046/j.1471-4159.1997.68010255.x. [DOI] [PubMed] [Google Scholar]
- Mattson MP. Excitotoxic and excitoprotective mechanisms: abundant targets for the prevention and treatment of neurodegenerative disorders. Neuromolecular Med. 2003;3:65–94. doi: 10.1385/NMM:3:2:65. [DOI] [PubMed] [Google Scholar]
- Mattson MP, Cheng B, Davis D, Bryant K, Lieberburg I, Rydel RE. beta-Amyloid peptides destabilize calcium homeostasis and render human cortical neurons vulnerable to excitotoxicity. J Neurosci. 1992;12:376–389. doi: 10.1523/JNEUROSCI.12-02-00376.1992. [DOI] [PMC free article] [PubMed] [Google Scholar]
- Mattson MP, Gleichmann M, Cheng A. Mitochondria in neuroplasticity and neurological disorders. Neuron. 2008;60:748–766. doi: 10.1016/j.neuron.2008.10.010. [DOI] [PMC free article] [PubMed] [Google Scholar]
- Mattson MP, Murrain M, Guthrie PB, Kater SB. Fibroblast growth factor and glutamate: opposing roles in the generation and degeneration of hippocampal neuroarchitecture. J Neurosci. 1989;9:3728–3740. doi: 10.1523/JNEUROSCI.09-11-03728.1989. [DOI] [PMC free article] [PubMed] [Google Scholar]
- Mattson MP, Partin J. Evidence for mitochondrial control of neuronal polarity. J Neurosci Res. 1999;56:8–20. doi: 10.1002/(SICI)1097-4547(19990401)56:1<8::AID-JNR2>3.0.CO;2-G. [DOI] [PubMed] [Google Scholar]
- Meka DP, Müller-Rischart AK, Nidadavolu P, Mohammadi B, Motori E, Ponna SK, Aboutalebi H, Bassal M, Annamneedi A, Finckh B, et al. Parkin cooperates with GDNF/RET signaling to prevent dopaminergic neuron degeneration. J Clin Invest. 2015;125:1873–1885. doi: 10.1172/JCI79300. [DOI] [PMC free article] [PubMed] [Google Scholar]
- Min BS, Lim DK, Kim SJ, LEE JH. A novel method of determining parameters of CLAHE based on image entropy. Int J Softw Eng Appl. 2013;7:113–120. [Google Scholar]
- Mitchell N, Petralia RS, Currier DG, Wang YX, Kim A, Mattson MP, Yao PJ. Sonic hedgehog regulates presynaptic terminal size, ultrastructure and function in hippocampal neurons. J Cell Sci. 2012;125:4207–4213. doi: 10.1242/jcs.105080. [DOI] [PMC free article] [PubMed] [Google Scholar]
- Mitra K, Lippincott-Schwartz J. Analysis of mitochondrial dynamics and functions using imaging approaches. Curr Protoc Cell Biol. 2010 doi: 10.1002/0471143030.cb0425s46. Chapter 4, Unit 4.25. [DOI] [PMC free article] [PubMed] [Google Scholar]
- Parra LM, Zou Y. Sonic hedgehog induces response of commissural axons to Semaphorin repulsion during midline crossing. Nat Neurosci. 2010;13:29–35. doi: 10.1038/nn.2457. [DOI] [PubMed] [Google Scholar]
- Petralia RS, Schwartz CM, Wang YX, Kawamoto EM, Mattson MP, Yao PJ. Sonic hedgehog promotes autophagy in hippocampal neurons. Biol Open. 2013;2:499–504. doi: 10.1242/bio.20134275. [DOI] [PMC free article] [PubMed] [Google Scholar]
- Petralia RS, Schwartz CM, Wang YX, Mattson MP, Yao PJ. Subcellular localization of Patched and Smoothened, the receptors for Sonic hedgehog signaling, in the hippocampal neuron. J Comp Neurol. 2011a;519:3684–3699. doi: 10.1002/cne.22681. [DOI] [PMC free article] [PubMed] [Google Scholar]
- Petralia RS, Wang YX, Hua F, Yi Z, Zhou A, Ge L, Stephenson FA, Wenthold RJ. Organization of NMDA receptors at extrasynaptic locations. Neuroscience. 2010;167:68–87. doi: 10.1016/j.neuroscience.2010.01.022. [DOI] [PMC free article] [PubMed] [Google Scholar]
- Petralia RS, Wang YX, Mattson MP, Yao P. Sonic hedgehog distribution within mature hippocampal neurons. Commun Integr Biol. 2011b;4:775–777. doi: 10.4161/cib.17832. [DOI] [PMC free article] [PubMed] [Google Scholar]
- Petralia RS, Wenthold RJ. Immunocytochemistry of NMDA receptors. Methods Mol Biol. 1999;128:73–92. doi: 10.1385/1-59259-683-5:73. [DOI] [PubMed] [Google Scholar]
- Prasansuklab A, Tencomnao T. Amyloidosis in Alzheimer’s disease: the toxicity of amyloid beta (Aβ), mechanisms of its accumulation and implications of medicinal plants for therapy. Evid Based Complement Alternat Med. 2013;2013:413808. doi: 10.1155/2013/413808. [DOI] [PMC free article] [PubMed] [Google Scholar]
- Prudent J, McBride HM. Mitochondrial dynamics: ER actin tightens the Drp1 noose. Curr Biol. 2016;26:R207–R209. doi: 10.1016/j.cub.2016.01.009. [DOI] [PubMed] [Google Scholar]
- Rambold AS, Kostelecky B, Elia N, Lippincott-Schwartz J. Tubular network formation protects mitochondria from autophagosomal degradation during nutrient starvation. Proc Natl Acad Sci USA. 2011;108:10190–10195. doi: 10.1073/pnas.1107402108. [DOI] [PMC free article] [PubMed] [Google Scholar]
- Redd EE, Pongstaporn T, Ryugo DK. The effects of congenital deafness on auditory nerve synapses and globular bushy cells in cats. Hear Res. 2000;147:160–174. doi: 10.1016/s0378-5955(00)00129-5. [DOI] [PubMed] [Google Scholar]
- Rouiller C, Bernhard W. Microbodies and the problem of mitochondrial regeneration in liver cells. J Biophys Biochem Cytol. 1956;2:355–360. doi: 10.1083/jcb.2.4.355. [DOI] [PMC free article] [PubMed] [Google Scholar]
- Ruthel G, Hollenbeck PJ. Response of mitochondrial traffic to axon determination and differential branch growth. J Neurosci. 2003;23:8618–8624. doi: 10.1523/JNEUROSCI.23-24-08618.2003. [DOI] [PMC free article] [PubMed] [Google Scholar]
- Scott I, Youle RJ. Mitochondrial fission and fusion. Essays Biochem. 2010;47:85–98. doi: 10.1042/bse0470085. [DOI] [PMC free article] [PubMed] [Google Scholar]
- Su B, Ji YS, Sun XL, Liu XH, Chen ZY. Brain-derived neurotrophic factor (BDNF)-induced mitochondrial motility arrest and presynaptic docking contribute to BDNF-enhanced synaptic transmission. J Biol Chem. 2014;289:1213–1226. doi: 10.1074/jbc.M113.526129. [DOI] [PMC free article] [PubMed] [Google Scholar]
- Taguchi N, Ishihara N, Jofuku A, Oka T, Mihara K. Mitotic phosphorylation of dynamin-related GTPase Drp1 participates in mitochondrial fission. J Biol Chem. 2007;282:11521–11529. doi: 10.1074/jbc.M607279200. [DOI] [PubMed] [Google Scholar]
- Taipale J, Chen JK, Cooper MK, Wang B, Mann RK, Milenkovic L, Scott MP, Beachy PA. Effects of oncogenic mutations in Smoothened and Patched can be reversed by cyclopamine. Nature. 2000;406:1005–1009. doi: 10.1038/35023008. [DOI] [PubMed] [Google Scholar]
- Vaarmann A, Mandel M, Zeb A, Wareski P, Liiv J, Kuum M, Antsov E, Liiv M, Cagalinec M, Choubey V, Kaasik A. Mitochondrial biogenesis is required for axonal growth. Development. 2016;143:1981–1992. doi: 10.1242/dev.128926. [DOI] [PubMed] [Google Scholar]
- Varjosalo M, Taipale J. Hedgehog: functions and mechanisms. Genes Dev. 2008;22:2454–2472. doi: 10.1101/gad.1693608. [DOI] [PubMed] [Google Scholar]
- Vogel F, Bornhövd C, Neupert W, Reichert AS. Dynamic subcompartmentalization of the mitochondrial inner membrane. J Cell Biol. 2006;175:237–247. doi: 10.1083/jcb.200605138. [DOI] [PMC free article] [PubMed] [Google Scholar]
- Westermann B. Mitochondrial fusion and fission in cell life and death. Nat Rev Mol Cell Biol. 2010;11:872–884. doi: 10.1038/nrm3013. [DOI] [PubMed] [Google Scholar]
- Wilson NH, Stoeckli ET. Sonic hedgehog regulates its own receptor on postcrossing commissural axons in a glypican1-dependent manner. Neuron. 2013;79:478–491. doi: 10.1016/j.neuron.2013.05.025. [DOI] [PubMed] [Google Scholar]
- Wu CL, Chen SD, Hwang CS, Yang DI. Sonic hedgehog mediates BDNF-induced neuroprotection against mitochondrial inhibitor 3-nitropropionic acid. Biochem Biophys Res Commun. 2009;385:112–117. doi: 10.1016/j.bbrc.2009.04.145. [DOI] [PubMed] [Google Scholar]
- Wu M, Neilson A, Swift AL, Moran R, Tamagnine J, Parslow D, Armistead S, Lemire K, Orrell J, Teich J, et al. Multiparameter metabolic analysis reveals a close link between attenuated mitochondrial bioenergetic function and enhanced glycolysis dependency in human tumor cells. Am J Physiol Cell Physiol. 2007;292:C125–C136. doi: 10.1152/ajpcell.00247.2006. [DOI] [PubMed] [Google Scholar]
- Yao PJ, Petralia RS, Mattson MP. Sonic hedgehog signaling and hippocampal neuroplasticity. Trends Neurosci. 2016;39:840–850. doi: 10.1016/j.tins.2016.10.001. [DOI] [PMC free article] [PubMed] [Google Scholar]
- Yao PJ, Petralia RS, Ott C, Wang YX, Lippincott-Schwartz J, Mattson MP. Dendrosomatic sonic hedgehog signaling in hippocampal neurons regulates axon elongation. J Neurosci. 2015;35:16126–16141. doi: 10.1523/JNEUROSCI.1360-15.2015. [DOI] [PMC free article] [PubMed] [Google Scholar]
Associated Data
This section collects any data citations, data availability statements, or supplementary materials included in this article.