

In addition to their direct roles in mitochondrial fission, Mff and Drp1 act as regulatory factors and control mitochondrial fission and fusion through a Ub-dependent mechanism. The E3 Ub ligase MARCH5 is negatively controlled by Mff and Drp1.
Abstract
MARCH5, an OMM-associated E3 ubiquitin ligase, controls mitochondrial function. Despite its importance, the mechanism and factors controlling MARCH5 activity are largely unknown. Here we report that the MARCH5 C-terminal domain plays a critical role in degradation of MARCH5 substrates, likely by facilitating release of ubiquitinated proteins from the OMM. We also found that the mitochondrial fission proteins Drp1 and Mff negatively regulate MARCH5’s activity toward MiD49 and Mcl1. Knockouts of either Drp1 or Mff led to reduced expression, shorter half-lives, and increased ubiquitination of MiD49 and Mcl1. Effects of Mff and Drp1 depletion on degradation rates and ubiquitination of Mcl1 and MiD49 were eliminated in Drp1−/−/MARCH5−/− and Mff−/−/MARCH5−/− cells. Our data show that it is not mitochondrial morphology per se but rather Mff and Drp1 that directly control MARCH5. Consistently, we find that Mff is an integral component of the MARCH5/p97/Npl4 complex, which is also controlled by MARCH5’s C-terminal domain. Furthermore, not only mitochondrial fission but also fusion is regulated through Mff and Drp1 protein activities. Thus, in addition to their canonical roles in mitochondrial fission, Mff and Drp1 also act as regulatory factors that control mitochondrial fission and fusion.
INTRODUCTION
Mitochondria are not only central for providing energy to a cell through oxidative phosphorylation, but they also control apoptosis, ion buffering, autophagy, innate immunity, and other processes required for development and maintenance of organ systems (Youle and van der Bliek, 2012; Friedman and Nunnari, 2014; Mishra and Chan, 2016; Wai and Langer, 2016). Accumulating evidence indicates that numerous diseases, including neurodegenerative disorders and cardiovascular disease, as well as effects of aging, are either caused by or associated with dysfunctional mitochondria (Youle and van der Bliek, 2012; Friedman and Nunnari, 2014; Guedes-Dias et al., 2016; Mishra and Chan, 2016; Wai and Langer, 2016). To prevent mitochondrial decline, cells use multiple quality control mechanisms, ranging from scavenging of toxic reactive oxygen species to proteolytic removal of damaged mitochondrial proteins and control of mitochondrial fusion and fission (mitochondrial membrane dynamics; Bezawork-Geleta et al., 2015; Bonomini et al., 2015; Chen et al., 2015; Cobb and Cole, 2015; Wai and Langer, 2016).
It is well established that in most cell types, mitochondrial fission is counterbalanced by fusion, leading to formation of highly dynamic mitochondrial networks (Nunnari et al., 1997; Youle and van der Bliek, 2012; Wai and Langer, 2016). Stringent regulation and coordination of fusion and/or fission rates is essential for various aspects of mitochondrial and cellular function, such as removal of damaged organelles (Narendra et al., 2008; Tanaka et al., 2010), execution of the mitochondrial steps in apoptosis (Karbowski et al., 2002; Lee et al., 2004), functional complementation within mitochondrial networks (Chen et al., 2010; Vidoni et al., 2013), mitochondrial DNA distribution (Lewis et al., 2016), and innate immunity (Youle and van der Bliek, 2012; Friedman and Nunnari, 2014; Labbe et al., 2014; Zemirli et al., 2014). Numerous proteins and pathways are implicated in mitochondrial membrane dynamics, including Bcl2 family proteins (Bax, Bak, BclxL and Mcl1; Karbowski et al., 2006; Brooks et al., 2007; Berman et al., 2009; Cleland et al., 2011; Perciavalle et al., 2012), mitochondrial phospholipase D (mito-PLD; Choi et al., 2006), SUMO signaling–related MAPL and sentrin-specific proteases (Braschi et al., 2009; Zunino et al., 2009), ubiquitin (Ub) signaling (Escobar-Henriques et al., 2006; Escobar-Henriques and Langer, 2014; Nakamura and Hirose, 2008; Karbowski and Youle, 2011; Wai and Langer, 2016; Xu et al., 2016), and actin polymerization and actin regulatory proteins (Korobova et al., 2013; Li et al., 2015). However, four large GTPases, members of the dynamin superfamily—dynamin-related protein 1 (Drp1), optic atrophy 1 (Opa1), and mitofusins 1 and 2 (Mfn1 and Mfn2; Youle and van der Bliek, 2012; Friedman and Nunnari, 2014)—are central for fission and fusion processes. Whereas Opa1, Mfn1, and Mfn2 mediate mitochondrial fusion (Chen et al., 2003; Olichon et al., 2006), Drp1 is essential for fission (Otsuga et al., 1998; Smirnova et al., 2001). Drp1 localizes primarily to the cytosol, but upon activation of mitochondrial fission, Drp1 is recruited to the outer mitochondrial membrane (OMM), where it forms high–molecular weight protein complexes marking active or prospective fission sites (Otsuga et al., 1998; Bleazard et al., 1999; Labrousse et al., 1999; Smirnova et al., 2001). In mammalian cells, mitochondrial recruitment of Drp1 is mediated by OMM-localized receptors, mitochondrial fission factor (Mff; Gandre-Babbe and van der Bliek, 2008; Otera et al., 2010; Loson et al., 2013), mitochondrial division 49/51 (MiD49/51; Palmer et al., 2011; Loson et al., 2013), and, less apparently, Fis1 (Lee et al., 2004; Otera et al., 2010; Loson et al., 2013). The mechanisms by which distinct Drp1 receptors are controlled, their physiological roles, and functional specializations are not well understood. Furthermore, it is not clear how mitochondrial fission and fusion rates are coordinated.
Reports have suggested various targets and pathways regulated by the OMM-associated E3 Ub ligase MARCH5, including mitochondria–endoplasmic reticulum interaction (Sugiura et al., 2013), removal of disease-causing misfolded proteins from the mitochondria (Yonashiro et al., 2009), and control of innate immunity (Yoo et al., 2015). However, the role of MARCH5 in mitochondrial fission and fusion appears to be the best established (Nakamura et al., 2006; Yonashiro et al., 2006; Karbowski et al., 2007; Park and Cho, 2012; Park et al., 2014; Kim et al., 2015). Our recent work identified MARCH5 as a negative regulator of Drp1-dependent mitochondrial fission through Ub- and proteasome-dependent degradation of MiD49 (Xu et al., 2016). Although several potential OMM-associated MARCH5 substrates have been reported, including mitochondrial dynamics proteins Drp1, Mfn1, Mfn2, and MiD49 (Nakamura et al., 2006; Yonashiro et al., 2006; Karbowski et al., 2007; Park et al., 2014; Kim et al., 2015; Xu et al., 2016), the mechanism of MARCH5 action, its physiological role, and how it is regulated are still not clear.
Here we show that depletion of Drp1 and Mff in Drp1−/− and Mff−/− HCT116 cells leads to down-regulation in the expression of OMM-localized proteins MiD49, Mcl1, Mfn1, and Mfn2, which are central for, or associated with, the control of mitochondrial fission and/or fusion. Drp1/Mff-dependent regulation of MiD49 and Mcl1, but not of Mfn1 and Mfn2, requires MARCH5 activity. Knockouts of another mitochondrial fission factor, MiD49, or the inner mitochondrial membrane–localized mitochondrial fusion factor Opa1 (Opa1−/−) did not affect levels of analyzed proteins. Thus our data indicate that Drp1 and Mff control levels and stabilities of MiD49, Mcl1, Mfn1, and Mfn2 through an unforeseen regulatory mechanism.
RESULTS
MARCH5 mutagenesis and rescue of mitochondrial fragmentation in MARCH5−/− cells
To further understand the Ub/proteasome system (UPS)–dependent control of mitochondria, we focused on the regulation of the OMM-associated E3 Ub ligase MARCH5. MARCH5 is a 278–amino acid protein with a cytosol-facing N-terminal RING finger domain (residues 6–75) followed by four transmembrane domains (TMs; residues 99–119, 139–159, 209–229, and 238–258) and a C-terminal extension (residues 259–278; Figure 1, A and B). To identify MARCH5 domains and factors critical for its function in mitochondrial dynamics, we generated an array of MYC-tagged MARCH5 mutants (Figure 1B; for the complete list of analyzed mutants see Materials and Methods). We then analyzed their ability to rescue mitochondrial fragmentation in MARCH5-depleted (MARCH5−/−) human colorectal carcinoma HCT116 cells (Figure 1, C and E). MARCH5 mutants (Figure 1B; unpublished data) were expressed in MARCH5−/− cells, followed by immunostaining to detect Tom20, a mitochondrial marker, and dynamin-related protein 1 (Drp1), a mitochondrial fission factor (Figure 1, D–H). As has been reported (Yonashiro et al., 2006; Xu et al., 2016), MARCH5 knockout resulted in mitochondrial fragmentation (Figure 1E). Most of the analyzed MYC-MARCH5 mutants restored mitochondrial networks in MARCH5−/− cells (unpublished data) to a similar degree as in wild-type MARCH5. Consistent with published data (Karbowski et al., 2007; Park et al., 2010), abnormal elongation of mitochondria was also detected in MARCH5−/− cells expressing a RING domain–inactivating mutant (H43W; MYC-MARCH5H43W; Figure 1, G and I). However, truncation of the cytosol-exposed C-terminal domain (amino acid residues 259–278; MYC-MARCH5Δtail) also led to abnormal elongation of mitochondria (Figure 1, F and I). Thus it is likely that in addition to the RING domain, the C-terminus of MARCH5 is also critical for the regulation of mitochondrial fission. No obvious effect on mitochondrial morphology was detected in MARCH5−/− cells expressing only the C-terminal–truncated MARCH5H43W (MYC-MARCH5H43W/ Δtail; Figure 1, H and I), suggesting that the RING and C-terminal domains work together to control mitochondrial fission. Because cells expressing MYC-MARCH5 Δtail (Figure 1, F and J) and, to a lesser degree MYC-MARCH5H43W/ Δtail (Figure 1, H and J) showed a reduction in mitochondria-associated Drp1, it is likely that MARCH5’s C-terminus, together with the RING domain, control Drp1-dependent mitochondrial fission. As we previously reported (Xu et al., 2016), MARCH5 knockout or overexpression did not affect levels of mitochondria-associated Drp1 (Figure 1, D, E, and J), supporting the possibility that the C-terminal domain of MARCH5 does not function as a receptor of Drp1.
FIGURE 1:

RING and C-terminal cytosolic MARCH5 domains control mitochondrial network organization. (A, B) Schematic representation of MARCH5 domains and membrane topology. MARCH5 is a 278–amino acid protein with cytosol exposed: N-terminal RING finger domain (residues 6–75; orange), the loop between TM2 and TM3 (residues 160–208; gray), the C-terminal extension (residues 259–278; green), and four transmembrane domains (TMs; residues: 99–119, 139–159, 209–229, and 238–258; blue). (B) MARCH5 mutants used in the studies. (C) Western blot analyses of total cell lysates obtained from wild-type and MARCH5−/− HCT116 cells as indicated. Asterisk indicates a cross-reactive band detectable with anti-MARCH5 antibody. (D–H) Typical examples of mitochondrial morphology (Tom20, green on overlay images; Drp1, red on overlay images) in wild-type (D) and MARCH5−/− HCT116 (E–H) cells. MARCH5−/− cells were transfected with MYC-MARCH5Δtail (F), MYC-MARCH5H43W (G), and MYC-MARCH5H43W/Δtail (H), together with nucleus-targeted cyan fluorescent protein (Nuc-CFP; not shown) to identify transfected cells. Cells were processed for immunofluorescence, followed by superresolution AiryScan imaging. Nontransfected cells are overlaid with blue lines. Scale bars, 20 μm (main images), 5 μm (details). (I) Mitochondrial morphologies in cells listed in D–H were scored using blinded cell counting. Cells were divided into three categories based on mitochondrial morphology. Fragmented indicates mitochondrial morphologies typical for MARCH5−/− cells (as in E); Normal indicates mitochondrial morphologies typical for wild-type HCT116 cells (as in D); Elongated/interconnected indicates mitochondrial morphologies exemplified in F and G. Data represent mean ± SD of three independent counts of 150 cells/condition. (J) Colocalization of Drp1 with the OMM marker Tom20. The values represent Pearson’s r. Data represent mean ± SD of 30–50 cells/condition.
We also determined the role of the cytosolic MARCH5 C-terminal domain in mitochondrial morphology and stress-induced mitochondrial fission. Given that Drp1-mediated mitochondrial fission can be induced by mitochondrial toxins, including the uncoupling agent carbonyl cyanide 4-(trifluoromethoxy) phenylhydrazone (FCCP; (Gandre-Babbe and van der Bliek, 2008; Li et al., 2015), we tested the degree to which MYC-MARCH5C-tail affects FCCP-induced mitochondrial fission. MYC-tagged C-terminal amino acid residues (261–278) of MARCH5 (MYC-MARCH5C-tail) were expressed in wild-type (Supplemental Text and Supplemental Figure S1, A–C) and MARCH5−/− (Supplemental Figure S1C) cells. Cells treated with dimethyl sulfoxide (vehicle; Supplemental Figure S1, A and C) or FCCP (Supplemental Figure S1, B and C), were taken for immunofluorescence analysis and structured illumination imaging. Anti–cytochrome c antibody was used to detect mitochondria and anti-MYC antibody to detect MYC-MARCH5C-tail. The data showed no apparent effect of MYC-MARCH5C-tail expression on mitochondrial morphology in untreated wild-type (Supplemental Figure S1, A and C) and MARCH5−/− (Supplemental Figure S1C) cells. However, whereas FCCP induced mitochondrial fragmentation in nontransfected HCT116 cells, cells expressing MYC-MARCH5C-tail displayed highly enlarged, swollen mitochondria (Supplemental Figure S1, B and C), suggesting that MYC-MARCH5C-tail disrupted mitochondrial fission.
BioID proximity screen identified Mff as a MARCH5-interacting protein
The foregoing data (Figure 1) suggest that MARCH5’s C-terminal domain could be important for MARCH5 activity. To identify factors that control MARCH5 in a C-terminal domain–dependent manner, we applied BioID technology to screen for proximate (neighboring and interacting) proteins (Roux et al., 2012, 2013). In this method, the protein of interest is fused with humanized BirA bacterial biotin protein ligase (BirA*), which is predicted to tag interacting and neighboring proteins with biotin. We generated wild-type MARCH5- and MARCH5H43W-BirA* fusion mammalian expression vectors. Because BirA* was fused to the C-terminus of MARCH5, it is likely that proteins interacting with or in proximity to this domain would be biotinylated preferentially. Biotinylation was determined by immunofluorescence (Figure 2A) and Western blot (Figure 2B). The data showed that MARCH5-BirA* (Figure 2A) and MARCH5H43W-BirA* (unpublished data) localized to the mitochondria. Furthermore, Alexa 488-streptavidin–detected biotinylation also showed a predominantly mitochondrial pattern (Figure 2A; unpublished data). Biotinylated proteins were purified from control and MARCH5(HA)BirA*- and MARCH5H43W(HA)BirA*-expressing cells using streptavidin-agarose beads (Figure 2B), followed by mass spectrometry. To reduce the frequency of false positives, only proteins identified in both MARCH5(HA)BirA*- and MARCH5H43W(HA)BirA*-expressing cells but absent in (HA)BirA*-expressing cells (control) were considered relevant. These criteria were met by 32 proteins (Figure 2C). Supporting the notion that MARCH5 might be required for coordination of the mitochondrial and cytosolic components of the UPS and consistent with the possibility that MARCH5 could regulate various aspects of mitochondrial biology, 14 UPS-related proteins were identified (Figure 2C). Of importance, mitochondrial fission factors Drp1 and Mff were also detected (Figure 2C), supporting a role for MARCH5 in the control of mitochondrial fission. Of note, other OMM-associated proteins shown to interact with MARCH5, including Mfn1 and Mfn2 (Yonashiro et al., 2006; Park et al., 2014), were not detected in this screen. However, the possibility that these reported interactions may occur through the N-terminal RING domain and thus be difficult to detect using our experimental design could not be excluded. Immunoprecipitation was used to test MARCH5 interactions with Mff and Drp1 in HCT116 cells. Wild-type, Drp1−/−, and Mff−/− HCT116 cells were transfected with MYC-MARCH5 and MYC-MARCH5H43W, followed by MYC-tagged protein pull-down and Western blot analysis (Figure 2D; unpublished data ). Mff coimmunoprecipitated with MYC-MARCH5 and, to a higher degree, MYC-MARCH5H43W (Figure 2D). However, although others have reported molecular interactions between MARCH5 and Drp1 (Nakamura et al., 2006; Yonashiro et al., 2006), we did not detect Drp1 in the same samples.
FIGURE 2:

Identification of MARCH5-interacting proteins. (A) Cells were transfected with MARCH5(HA)BirA* along with biotin treatment (final concentration 50 mM). At ∼24 h after transfection, cells were fixed and stained for protein biotinylation (with Alexa 488–streptavidin; green on overlay image), MARCH5(HA)BirA* (with anti-HA mAb; blue on overlay image), and mitochondria (with anti-Tom20 polyclonal antibody; red on overlay image). MARCH5(HA)BirA*-expressing cells are overlaid in yellow. Asterisk indicates nontransfected cells. (B) Total cell lysates (INPUT) and streptavidin-purified biotinylated proteins (streptavidin pull down) obtained from cells transfected with the indicated constructs and treated with biotin as described in A. Approximately10% of inputs and streptavidin bead–purified biotinylated proteins (red rectangle in B) were used for SDS–PAGE. Biotinylated proteins were detected with HRP-streptavidin. (C) MARCH5-nteracting proteins (MARCH5 BioID assay summary; for details, see the text). (D) Cell lysates obtained from control-, MYC-MARCH5–, and MYC-MARCH5H43W–transfected wild-type and Mff−/− HCT116 cells were subjected to MYC immunoprecipitation. Immunoprecipitated samples (left) and inputs (right) were analyzed by Western blot as indicated.
To further examine MARCH5 interactions with Mff and Drp1, we applied the membrane-permeable chemical cross-linker dithiobis-(succinimidyl propionate) (DSP). The use of this chemical cross-linker allows the selective stabilization of labile interactions, thus bypassing biochemical limitations for purification and enabling enrichment of interacting proteins. This approach has been used to identify several transient/weak protein interactions, including between mitochondrial proteins (Davis et al., 2000; Shen et al., 2009). In these experiments, we also analyzed the role of the MARCH5 N-terminal RING and C-terminal domains in the interactions with their potential regulators. Given that MARCH5 forms oligomers (Karbowski et al., 2007; Kim et al., 2016) and assuming that MARCH5 mutants could interact with endogenous MARCH5 and therefore make data interpretation difficult (e.g., due to detection of proteins interacting with endogenous MARCH5 potentially being pulled down with the MARCH5 mutant), we used MARCH5−/− instead of wild-type cells. Cells transfected with MYC-MARCH5, MYC-MARCH5H43W, MYC-MARCH5Δtail, and MYC- MARCH5H43W/Δtail were subjected to DSP cross-linking and MYC-MARCH5 pull down (Figure 3, A and B). Consistent with the BioID screen and non-cross-linked immunoprecipitation (Figure 2), Mff coprecipitated with MYC-MARCH5 and MYC-MARCH5H43W (Figure 3, A and B). This interaction was also detected in samples obtained from MYC-MARCH5 Δtail– and MYC-MARCH5H43W/Δtail–expressing cells (Figure 3, A and B). Consistent with native immunoprecipitation experiments, Drp1 did not coprecipitate with any of the analyzed MARCH5 constructs (unpublished data). The lack of detectable Drp1:MARCH5 interaction could be the result of the specific experimental conditions applied in this study. Indeed, we also did not detect a direct interaction between Drp1 and its mitochondrial receptor, Mff (unpublished data). To provide confirmation for the specificity of the Mff:MARCH5 binding, we used highly sensitive antibodies targeting Tom20, an abundant OMM-associated protein, but did not find detectable Tom20 signal in any of the analyzed samples (unpublished data).
FIGURE 3:

Regulation of MARCH5 protein complex. (A) Western blot analyses of MYC-immunoprecipitated samples obtained from DSP-cross-linked MARCH5−/− cells transfected as indicated. (B) Inputs corresponding to samples in A. (C) Levels of indicated proteins coimmunoprecipitating with distinct MARCH5 variants were quantified. Data represent mean ± SD of four (Mff,) three (p97 and Ub), and two (Npl4) independent experiments. (D, E) Ubiquitination of mitochondria was analyzed in MARCH5−/− cells expressing MYC-MARCH5 (D) or MYC-MARCH5 Δtail (E). Cells were immunostained with anti-MYC polyclonal antibody to detect MARCH5 (green on overlay images) and anti–conjugated Ub FK2 antibody to detect Ub (red on overlay images). (F) Effect of MARCH5 and indicated MARCH5 mutants on protein levels of MiD49 and Mcl1. Total cell lysates of MARCH5−/− cells transfected as indicated were analyzed by Western blot for the levels of MiD49, Mcl1, and MARCH5 constructs. Tom20 was used as a loading control.
We previously showed that UPS-dependent degradation of MiD49 and Mcl1 require activity of AAA-ATPase p97 (Xu et al., 2011, 2016). Taking advantage of MARCH5 complex stabilization by DSP cross-linking, we tested whether p97 interacts with MARCH5 and the degree to which MARCH5 mutants could affect this interaction. The data showed that whereas p97 interacted with all tested MARCH5 constructs, it was markedly enriched in samples obtained from MYC-MARCH5 Δtail– and MYC- MARCH5H43W/Δtail–expressing cells (Figure 3, A–C). Confirming the specificity of this interaction Npl4, a p97 cofactor, was also found to interact with MARCH5 (Figure 3, A–C). The levels of Npl4 pulled down with each of the MARCH5 variants were similar to the levels of interacting p97 (Figure 3, A–C).
The subcellular localization of p97/Npl4 complex is controlled by the local amount of ubiquitinated proteins (Ye et al., 2001). Accordingly, we asked whether the enhanced p97/Npl4 complex:MARCH5 interaction is associated with increased ubiquitination levels of the MARCH5 protein complex. MYC pull-down samples obtained from MYC-MARCH5Δtail– and MYC-MARCH5H43W/Δtail–expressing cells showed an approximately ninefold and an approximately fivefold increase in ubiquitination, respectively, compared with MYC-MARCH5–expressing MARCH5−/− cells (Figure 3, A–C), suggesting that MARCH5 C-terminal truncation leads to accumulation of ubiquitinated proteins associated with MARCH5. Thus, whereas MYC-MARCH5H43W and MYC-MARCH5H43W/Δtail are likely to have reduced E3 Ub ligase activity, MYC-MARCH5Δtail could still be active. Mitochondrial ubiquitination was also detected in MYC-MARCH5Δtail– but not in MYC-MARCH5–expressing MARCH5−/− cells by immunofluorescence (Figure 3, D and E), further supporting the possibility that the C-terminal domain of MARCH5 may be required for the postubiquitination steps in MARCH5-mediated protein degradation. Truncation of this domain is likely to stall transition of ubiquitinated proteins to the p97/Npl4 complex on the OMM or to the proteasome in the cytosol, resulting in enhanced association of Ub and p97/Npl4 with MARCH5. However, the possibility that the E3 Ub ligase activity of MARCH5 or perhaps an unknown E3 Ub ligase or deubiquitinase is controlled by this domain cannot be excluded. Consistent with the role of the C-terminal domain in regulation of MiD49 and Mcl1 turnover, reexpression of MYC-MARCH5, but not MARCH5 mutants, reduced accumulation of MARCH5 substrates MiD49 and Mcl1 in MARCH5−/− cells (Figure 3F).
Mff and Drp1 control protein expression of mitochondrial fission and fusion factors
Data showing the interaction of MARCH5 with Mff (Figures 2 and 3) and published reports indicating MARCH5 binding to Drp1 (Nakamura et al., 2006; Yonashiro et al., 2006) suggested that MARCH5 may regulate these proteins. However, consistent with other reports (Nakamura et al., 2006; Xu et al., 2016), we found that protein levels and stabilities of Drp1 and Mff were not affected by MARCH5 depletion (Figure 4A; unpublished data). Thus one may conclude that MARCH5 does not control the proteasome-dependent degradation of Drp1 and Mff. On the other hand, although ubiquitination and turnover of MiD49 were reported to be regulated by MARCH5 (Xu et al., 2016), the screen for proteins altered in MARCH5−/− HCT116 cells also revealed a severalfold increase in the expression levels of Mcl1 (Xu et al., 2016; Figure 3F). Data shown in Supplemental Figure S2 A support a role for MARCH5 in control of Mcl1 turnover. Therefore, in subsequent studies, analyses of Mcl1 are also included.
FIGURE 4:

Role of Drp1 and Mff in control of the OMM proteostasis. (A) Total cell lysates obtained from wild type and HCT116-based Drp1−/−, Opa1−/−, DKO (Drp1−/−/Opa1−/−), Mff−/−, MiD49−/−, and MARCH5−/− were analyzed by Western blot as indicated. (B, C) Fold changes of protein levels in knockout cells listed in A were estimated. Protein levels were plotted after normalization, with respective protein levels in wild-type cells set at 1. (C) Relative levels of specified proteins in MARCH5−/− cells. Data represent mean ± SD of three or four independent experiments. (D) mRNA expression of indicated genes in wild-type, Drp1−/−, Mff−/−, and MiD49−/− HCT116 cells was determined using qRT-PCR. Fold induction was calculated by the absolute quantification method. A standard curve was made for reference gene by serial dilutions of genomic DNA from 100 to 3.125 ng. Data represent mean ± SD; n = 3. (E–J) Wild-type (E), Drp1−/− (F), Opa1−/− (G), DKO (Drp1−/−/Opa1−/−; H), Mff−/− (I), and MiD49−/− (J) HCT116 cells were immunostained with anti–cytochrome c antibody to reveal mitochondria and imaged using structured illumination microscopy. Cells were divided into three categories based on mitochondrial morphology, as described in Figure 2I. Typical images of respective cells. (K) Mitochondrial morphologies in cell types shown in E–J were scored using blinded cell counting. Data represent mean ± SD of three independent counts of 150 cells/condition.
To test the possibility that Mff and Drp1 may control MARCH5-dependent ubiquitination and turnover of other proteins, we analyzed the effect of Mff and Drp1 depletion on levels of reported MARCH5 substrates and other mitochondrial proteins (Figure 4). Total cell lysates obtained from Drp1−/−, Mff−/−, Opa1−/−, Drp1−/−/Opa1−/− (DKO), MiD49−/−, and wild-type HCT116 cells were analyzed by Western blot (Figure 4, A and B). Efficient knockout of the respective proteins was confirmed by Western blot (Figure 4A) and PCR (unpublished data). The data show that in both Drp1−/− and Mff−/− cells, protein levels of MiD49, Mcl1, and mitochondrial fusion factors Mfn1 and Mfn2 were markedly reduced, whereas other mitochondrial proteins, including OMM-associated Tom20, Tom22, BclxL, and mitochondrial matrix-localized Clpp, were not affected (Figure 4, A and B). Accumulation of the short form of mitochondrial fusion factor Opa1 (sOpa1) was also evident in Drp1−/− and to lesser degree Mff−/− cells (Figure 4A). Drp1 knockout did not affect levels of Mff and vice versa (Figure 4A). Confirming a specific role for Drp1 and Mff in the control of the aforementioned proteins, knockouts of MiD49 and Opa1 did not affect levels of the analyzed proteins (Figure 4, A and B). Relative levels of the analyzed proteins in MARCH5−/− cells are shown in Figure 4C. Using quantitative real-time PCR (qRT-PCR), we tested the degree to which depletion of Drp1 and Mff affected the transcription of respective mRNAs (Figure 4D). There were no significant reductions in the mRNA levels of Mcl1, MiD49, or Mfn1, suggesting that the decreases in expression of these proteins in Drp1−/− and Mff−/− cells can be attributed to a reduction in protein stability. Conversely, Mfn2 mRNA levels were found to be lower in Drp1−/− and Mff−/− cells, indicating that the altered expression of Mfn2 in these cells may be due to dysregulated transcription (Figure 4D). Thus depletion of Drp1 and Mff might affect the stability of Mcl1, MiD49, and Mfn1 proteins, but Mfn2 levels could also be regulated at the transcriptional level.
We also analyzed mitochondrial morphology in knockout cells (Figure 4, E–K). The data showed the expected mitochondrial elongation and interconnection in Drp1−/− cells (Figure 4, F and K), less remarkable but clear mitochondrial elongation in most of the Mff−/− (Figure 4, I and K) and MiD49−/− cells (Figure 4, J and K), and extensive mitochondrial fragmentation in Opa1−/− cells (Figure 4, G and K). The mitochondria in Drp1−/−/Opa1−/− cells resembled those detected in Drp1−/− cells (Figure 4, H and K). Because similar morphology was observed in Drp1−/−/Opa1−/− cells regardless of whether Drp1 was knocked out in Opa1−/− or vice versa (unpublished data), it appears that in HCT116 cells, inhibition of Drp1-dependent mitochondrial fission is epistatic to inhibition of Opa1-dependent mitochondrial fusion. These data verify the mitochondrial phenotypes of respective knockout cells. They also support the possibility that it is not mitochondrial morphology per se but rather the activities of Drp1 and Mff that control MiD49, Mcl1, and Mfn1 protein levels.
MARCH5-dependent and -independent control of mitochondrial dynamics factors
To determine the role of MARCH5 in Mff/Drp1-dependent control on expression levels of mitochondrial fission and fusion factors, we generated Mff−/−/MARCH5−/− and Drp1−/−/MARCH5−/− cells (Figure 5). Cells were analyzed for levels of MiD49, Mcl1, Mfn1, Mfn2, and sOpa1 (Figure 5, A–D). The Drp1- and Mff-dependent decreases in Mfn1 and Mfn2 expression and accumulation of sOpa1 were not altered in Mff−/−/MARCH5−/− or Drp1/MARCH5−/− cells and displayed comparable expression levels to Mff−/− and Drp1−/− cells (Figure 5, A–D). However, the levels of MiD49 and Mcl1 in Mff−/−/MARCH5−/− and Drp1−/−/MARCH5−/− cells were comparable to those in MARCH5−/− cells (Figure 5, A–D). Thus these results indicate that Drp1 and Mff control of MiD49 and Mcl1 expression is MARCH5 dependent. Conversely, MARCH5 does not appear to be required for Drp1- and Mff-dependent alterations in mitochondrial fusion factors (Figure 5 and Supplemental Figure S3). Similar data were obtained with two independent clones of Drp1−/−/MARCH5−/− and Mff−/−/MARCH5−/− (unpublished data), supporting the specificity of this mechanism. Combined, these results suggest that depletion of Drp1 and Mff could affect the stability of MARCH5 substrates MiD49 and Mcl1. To test this possibility, we applied cycloheximide (CHX) chase (Figure 6, A–G). Consistent with the role for Drp1 and Mff in control of Mcl1 and MiD49 turnover, the half-lives of these proteins were shortened in both Drp1−/− (Figure 6, A, E, and F) and Mff−/− (Figure 6, B, E, and F) cells, whereas stability of Tom20 was not affected (Figure 6, A, B, and G). Stability of MiD49 and Mcl1 was markedly increased in Drp1−/−/MARCH5−/− (Figure 6, C, E, and F) and Mff−/−/MARCH5−/− (Figure 6, D–F) cells and was comparable to that in MARCH5−/− cells.
FIGURE 5:
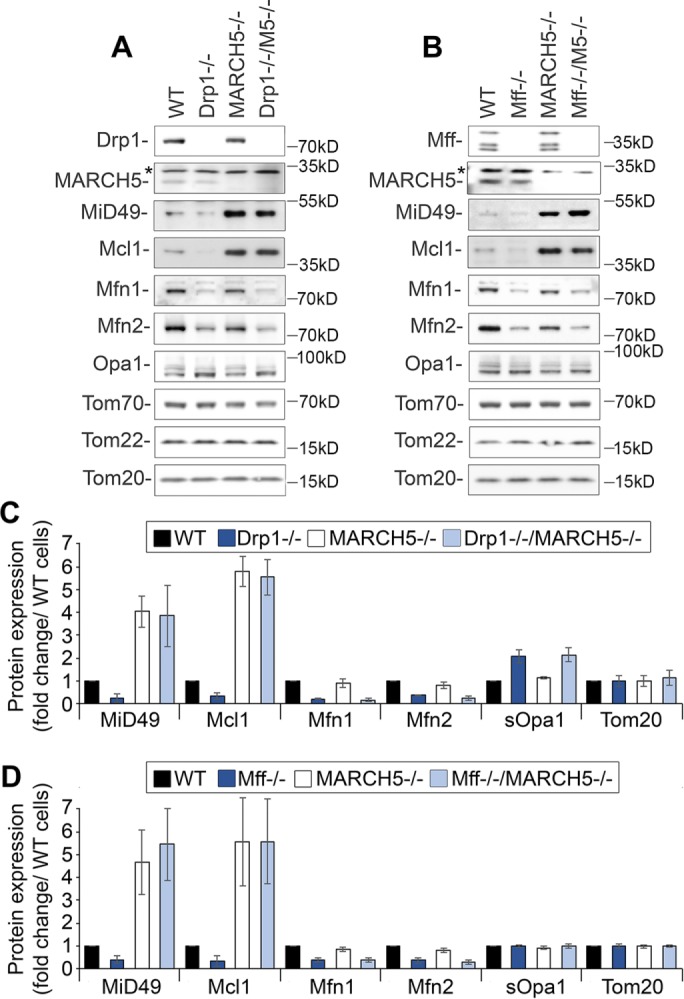
Role of MARCH5 in control of Mff/Drp1-dependent protein levels. (A) Total cell lysates obtained from wild-type and HCT116-based Drp1−/−, MARCH5−/−, and Drp1−/−/MARCH5−/− cells were analyzed by Western blot as indicated. (B) Total cell lysates obtained from wild-type and HCT116-based Mff−/−, MARCH5−/−, and Mff−/−/MARCH5−/− cells were analyzed by Western blot as indicated. (C, D) Fold changes of protein levels in knockout cells listed in A and B were estimated. Protein levels were plotted after normalization, with respective protein levels in wild-type cells set at 1. Data represent mean ± SD of three or four independent experiments.
FIGURE 6:

Role of MARCH5 in control of turnover and ubiquitination of Mcl1 and MiD49 in Drp1−/− and Mff−/− cells. Wild-type (A, B), Drp1−/− (A, B), Mff−/− (A, B), Opa1−/− (A, B), MARCH5−/− (C, D), Drp1−/−/MARCH5−/−, and Mff−/−/MARCH5−/− (C, D) HCT116 cells were treated with CHX as indicated, followed by Western blot to detect MiD49 (A, C) and Mcl1 (B, D); Tom20 served as a loading control. CHX-induced changes in MiD49 (E), Mcl1 (F), and Tom20 (G) protein levels in aforementioned cells were quantified and plotted as a function of time of CHX treatment. Protein levels detected in untreated samples (0 min) were set at 1. Data represent mean ± SD of three or four independent experiments. (H,I) Wild-type, Drp1−/−, Mff−/−, MARCH5−/−, Drp1−/−/MARCH5−/−, and Mff−/−/MARCH5−/− cells transfected with MYC-MID49 (H, I) were subjected to MYC immunoprecipitation under denaturing conditions. Samples were analyzed by Western blot for MYC tag to detect MYC-MiD49 (H) and Ub (H, I) as indicated. (J, K) Total cell lysate (TCL) and mitochondria-enriched heavy membrane fractions (HM) obtained from cell types indicated were analyzed for ubiquitination levels. Tom20 was used as a loading control.
Using immunoprecipitation under denaturing conditions, we tested the effects of Drp1 and Mff depletion on the ubiquitination status of MiD49 and Mcl1. The data showed substantial increases in ubiquitinated MYC-MiD49 (Figure 6, H and I) and MYC-Mcl1 (unpublished data) in both Drp1−/− and Mff−/− cells as compared with wild-type cells. The increased ubiquitination of both MiD49 and Mcl1 was reduced in Drp1−/−/MARCH5−/− and Mff−/−/MARCH5−/− cells (Figure 6, H and I; unpublished data), supporting the possibility that Mff and Drp1 regulate MARCH5 and Ub-mediated degradation of MiD49 and Mcl1.
We also examined the effect of Drp1 and Mff depletion by gene knockout on total mitochondrial ubiquitination. Cells were subjected to subcellular fractionation, followed by Western blot analyses for the levels of Ub in total cell lysates (TCLs; Figure 6J) and mitochondria-enriched heavy membrane (HM) fractions (Figure 6K). No apparent differences in the levels of ubiquitination were detected in TCL (Figure 6J) or HM (Figure 6K) from Drp1−/− or Mff−/− cells compared with wild-type cells, suggesting that Drp1 and Mff control the ubiquitination of a limited number of mitochondrial proteins. Confirming these results, immunofluorescence for anti–conjugated Ub (FK2) antibody followed by structured illumination microscopy, an approach that permitted us to detect mitochondrial ubiquitination upon induction of Parkin-dependent mitophagy (Chen et al., 2013), and Ub accumulation in MYC-MARCH5Δtail–expressing MARCH5−/− cells (Figure 3E) also did not detect any changes in mitochondria-associated Ub (unpublished data).
Mitochondrial morphology in Drp1−/−/MARCH5−/− and Mff−/−/MARCH5−/− HCT116 cells
Combined, the results support functional and molecular cross-talk between MARCH5 and Mff/Drp1 in the control of mitochondrial fission. To test the relevance of Mff/Drp1 control of MARCH5, we analyzed mitochondrial morphology in Drp1−/−/MARCH5−/− and Mff−/−/MARCH5−/− HCT116 cells (Figure 7). Cells were immunostained for mitochondrial marker cytochrome c (green on overlay images in Figure 7, A–F) and peroxisomal protein Pex14 (red on overlay images in Figure 7, A–F) as a control, followed by structured illumination imaging (Figure 7, A–F) and mitochondrial morphology quantification (Figure 7G). Only elongated/interconnected mitochondria, identical to mitochondria observed in Drp1−/− HCT116 cells, were detected in Drp1−/−/MARCH5−/− cells (compare Figure 7, E and F). Considering the essential role for Drp1 in mitochondrial fission, these results were not surprising. In contrast to Mff−/− cells, which showed elongated/interconnected mitochondria, mitochondria in Mff−/−/MARCH5−/− cells were predominantly fragmented (compare Figure 7, C and D). Thus it is likely that through an increase in mitochondrial fission rates, stabilization/accumulation of MiD49 in Mff−/−/MARCH5−/− cells is sufficient to overcome Mff deficiency, leading to mitochondrial fragmentation.
FIGURE 7:

Mitochondria-specific functional cross-talk between Mff and MARCH5. (A–F) Typical examples of mitochondria (cytochrome c; green on overlay images) and peroxisomes (Pex14; red on overlay images) in wild-type (A), MARCH5−/− (B), Mff−/− (C), Mff−/−/MARCH5−/− (D), Drp1−/− (E), and Drp1−/−/MARCH5−/− (F) HCT116 cells. Cells were processed for immunofluorescence, followed by structured illumination imaging. (G) Mitochondrial and peroxisomal morphologies in cells listed in A–F were scored using blinded cell counting. Cells were divided into three categories based on mitochondrial morphology. Fragmented indicates mitochondrial morphologies typical for MARCH5−/− cells (as in B); Normal indicates mitochondrial morphologies typical for wild-type HCT116 cells (as in A); Elongated/interconnected indicates mitochondrial morphologies exemplified in C, E, and F. Data represent mean ± SD of three independent counts of 150 cells/condition. (H) Colocalization of Drp1 with the OMM marker Tom20 was analyzed in cells indicated. The values represent Pearson’s r. Data represent mean ± SD of ∼50 cells/condition.
Because Mff and MiD49 mediate mitochondrial recruitment of Drp1 (Otera et al., 2010; Palmer et al., 2011; Loson et al., 2013), we investigated the subcellular distribution of Drp1 in Mff−/− and Mff−/−/MARCH5−/− cells. The reported (Otera et al., 2010; Li et al., 2015) reduced mitochondrial association of Drp1 in Mff−/− cells was rescued in Mff−/−/MARCH5−/− cells (Figure 7H), suggesting that the fragmented mitochondrial morphology in Mff−/−/MARCH5−/− cells (Figure 7, D and G) is a result of MiD49 accumulation–mediated increase in mitochondria-associated Drp1.
Furthermore, given the well-established role of Drp1 and Mff in control of peroxisome fission (Koch et al., 2003), we also asked whether, as in the case of mitochondria, MARCH5, Mff, and Drp1 cooperate in control of peroxisome morphology. Consistent with earlier reports, only elongated peroxisomes were detected in Mff−/− (Figure 7, C and G) and Drp1−/− (Figure 7, E and G) cells, whereas MARCH5−/− (Figure 7, B and G) and wild-type (Figure 7, A and G) cells showed punctate peroxisome morphology. Only elongated peroxisomes were detected in Mff−/−/MARCH5−/− (Figure 7, D and G) and Drp1−/−/MARCH5−/− (Figure 7, F and G) cells. Thus, in contrast to mitochondria, MARCH5 depletion–induced stabilization of MiD49 does not appear to affect peroxisome division. Consistent with the fact that Mff is the only known Drp1 receptor on peroxisomes (Palmer et al., 2013), these results further support the mitochondrial specificity of the MARCH5/Mff/Drp1 signaling axis.
DISCUSSION
The mechanisms by which mitochondrial fission rates are adjusted to cellular demands, as well as the potential functional specialization of integral OMM-associated components of the mitochondrial fission machinery, are not well understood. We recently reported that mitochondrial fragmentation detectable in MARCH5-depleted cells was not associated with changes in mitochondrial fusion rates or alterations in bioenergetic performance of these organelles but instead was caused by increased fission rates (Xu et al., 2016). We concluded that MARCH5 is a negative regulator of Drp1-dependent mitochondrial fission via regulation of the stability of MiD49, the OMM-associated Drp1 receptor (Xu et al., 2016). However, the exact mechanisms or conditions that regulate MARCH5 activity and its specific role in the overall process governing mitochondrial fission were not established.
As a continuation of these earlier studies, we focused on the functional and molecular cross-talk between MARCH5 and mitochondrial dynamics proteins. Data reported here show that Drp1 and Mff, likely in concert, regulate MARCH5 activity toward MiD49 and Mcl1, another identified MARCH5 substrate. Specifically, turnover rates and ubiquitination levels of MiD49 and Mcl1 were enhanced in both Drp1−/− and Mff−/− cells. These changes corresponded to reduced MiD49 and Mcl1 protein levels in Drp1−/− and Mff−/− cells, which were reversed upon depletion of MARCH5 in Drp1−/− and Mff−/− backgrounds. Considering other reports (Nakamura et al., 2006; Yonashiro et al., 2006), along with the molecular interactions between MARCH5 and Mff shown here and the fact that MARCH5 does not regulate stability of either Drp1 or Mff (Nakamura et al., 2006; Xu et al., 2016), we propose that in addition to their canonical mitochondrial membrane-remodeling roles in mitochondrial fission, Drp1 and Mff also regulate other components of the mitochondrial fission machinery indirectly through a Ub/proteasome-dependent mechanism.
Supporting this possibility and suggesting that Drp1 and Mff could work as a molecular complex, not only in a well-established mechanoenzymatic manner, but also in the regulation of Ub-dependent MiD49 and Mcl1 protein stabilities, a BioID screen for proteins interacting with/or proximal to the cytosol-exposed C-terminal domain of MARCH5 identified Mff and Drp1 but not other mitochondrial dynamics proteins. Immunoprecipitation under native and “in-cell” DSP cross-linking revealed strong interactions between Mff and MARCH5. In addition, in cross-linked samples, we also detected accumulation of p97 and Npl4, proteins previously linked to retrotranslocation of ubiquitinated substrates from the OMM to the cytosol before their proteasomal degradation through a process known as OMM-associated degradation (Karbowski and Youle, 2011; Xu et al., 2011). Suggesting a role for the C-terminal domain of MARCH5 in the regulation of MARCH5 cross-talk with p97/Npl4 complex, these proteins were found to accumulate in C-terminal tail–truncated MARCH5 mutants to a much higher degree than with wild type and a RING domain mutant of MARCH5. Furthermore, ubiquitination levels detected in DSP–cross-linked immunoprecipitated samples were increased in samples obtained from MYC-MARCH5Δtail-expressing cells and, to a lesser degree, MYC-MARCH5H43W/Δtail–expressing cells, supporting the possibility that the E3 Ub activity of MARCH5 is not inhibited by C-terminal truncation. Thus our data suggest that the more likely function of this cytosol-exposed C-terminal domain is a role in the postubiquitination steps of MARCH5-dependent protein degradation, including p97/Npl4 recruitment and/or ubiquitinated protein retrotranslocation.
The physiological effects on mitochondrial morphology stemming from the interactions between MARCH5 and Mff and p97/Npl4 can be seen in Figure 1. Of interest, reexpression of MYC-MARCH5H43W and MYC-MARCH5Δtail into MARCH5−/− cells results in elongation of mitochondria, whereas expression of MYC- MARCH5H43W/Δtail has no effect on morphology, indicating that both the RING and C-tail domains are necessary for MARCH5 to maintain mitochondrial morphology. Because MYC-MARCH5H43W–expressing cells display enhanced Mff:MARCH5 binding and Drp1 recruitment to mitochondria, it is possible that the RING domain is necessary for Mff activation. In cells expressing this mutant, Mff may be in an inactive state or conformation, and its activation may require the ubiquitination activity of MARCH5, perhaps through ubiquitination of other mitochondrial substrates. In regard to the C-tail domain, the enhanced levels of ubiquitination and interactions between MARCH5Δtail and p97/Npl4 suggest that protein turnover at the OMM may be stalled or inactive. If this is the case, then it is possible that in cells expressing MYC-MARCH5Δtail, turnover of other fission factors may be affected, resulting in altered mitochondria morphology. On the other hand, accumulation of p97/Npl4 could be induced by enhanced protein ubiquitination, either MARCH5 dependent or mediated by unknown E3 Ub ligase and/or deubiquitinase that interact with the MARCH5 complex. Indeed, our data show several UPS factors being biotinylated by MARCH5-BirA* and therefore proximal to the MARCH5 complex. These possibilities are being investigated in our laboratory.
Results presented here support the possibility that MARCH5 is required for converting Drp1- and Mff-initiated signals into the regulation of ubiquitination and stability of MiD49 and Mcl1, providing a mechanism to fine-tune mitochondrial fission rates. Indeed, illustrating the functional hierarchy by which Mff and MiD49 contribute to Drp1-mediated mitochondrial fission and also supporting our current model, abnormal accumulation of MiD49 in Mff−/−/MARCH5−/− cells compensated for and overcame the loss of Mff, leading to fragmented mitochondrial morphology.
We also identified Mcl1 as a novel MARCH5 substrate. Because apoptosis-induced Mcl1 degradation was only slightly affected by MARCH5 depletion, it is possible that, in contrast to other E3 Ub ligases, including Mule/ARF-BP1 and SCF/FBW7 (Zhong et al., 2005; Inuzuka et al., 2011), MARCH5-dependent regulation of Mcl1 is restricted primarily to nonapoptotic conditions. This is further supported by the fact that despite Mcl1 accumulation, MARCH5−/− cells display increased sensitivity to stress-induced apoptosis (Xu et al., 2016). Considering that Mcl1 has already been implicated in the control of mitochondrial fusion and fission, including mitochondrial recruitment of Drp1 (Perciavalle et al., 2012; Varadarajan et al., 2013; Morciano et al., 2016), it is possible that MARCH5- and Mff/Drp1-mediated control of Mcl1 is also specifically linked to Mcl1’s role in mitochondrial membrane dynamics. It has been reported that pharmacological inhibition of Mcl1 led to mitochondrial fragmentation either upstream of or independent of apoptosis (Varadarajan et al., 2013). Thus, although there is an abnormal accumulation of Mcl1 in MARCH5−/−, Mff−/−/MARCH5−/−, and Drp1−/−/MARCH5−/− cells, the depletion of MARCH5 in these cells could make Mcl1 inactive. It also has been shown that Mcl1 can be found in the protein complex with Drp1 (Morciano et al., 2016), suggesting that it could directly control Drp1 activity. However, despite intense effort, we could not determine the mechanism by which Mcl1 contributes to mitochondrial fission or how this antiapoptotic protein contributes to MARCH5-mediated, Mff/Drp1-dependent control of this process.
The findings reported here also suggest that, in addition to their roles in mitochondrial fission, Mff and Drp1 could also be responsible for fine-tuning mitochondrial fusion rates, perhaps in a similar Ub/proteasome-dependent mechanism. Previously the molecular machineries of mitochondrial fission and fusion were studied separately, and the mechanisms by which these processes are coordinated/balanced remain to be elucidated. The only exceptions known to us are recent reports from the Langer and Ishihara laboratories suggesting that mitochondrial fusion protein Opa1 can regulate mitochondrial fission (Anand et al., 2014) and a role for Drp1-dependent changes in mitochondria morphology in control of Mfns and Opa1 (Saita et al., 2016). Consistent with that work, we found a reduction in the high–molecular weight long Opa1 isoform and accumulation of short Opa1 isoform in Drp1−/− and to a lesser degree Mff−/− cells. Supporting the possibility that Ub-dependent control of the OMM-localized mitochondrial fusion factors Mfn1 and Mfn2 could be under regulatory control of Drp1 and Mff, we showed that expression and turnover rates of these proteins were altered in both Mff−/− and Drp1−/− cells. The functional importance of these changes is also suggested by the fact that mitochondrial fusion rates were reduced in Mff−/− cells. However, consistent with work by Saita et al. (2016), because similar changes in Opa1, Mfn1, and Mfn2 were detected in wild-type and MARCH5−/− backgrounds, an E3 Ub ligase other than MARCH5 is likely to regulate these proteins. Our present studies focus on the identification and characterization of the molecular machinery controlling Mff/Drp1-dependent Mfn1 and Mfn2 turnover. Nevertheless, these data further indicate a highly specific role for MARCH5 in the control of Drp1- and Mff-dependent stability of MiD49 and Mff. A recent report revealed that the OMM-associated phospholipase mito-PLD inhibited Drp1-dependent mitochondrial fission (Adachi et al., 2016). Of interest, mito-PLD has been also shown to stimulate Mfn-dependent mitochondrial fusion (Choi et al., 2006; Huang et al., 2011a). Little is known about control of mito-PLD stability or whether this protein participates in the mechanism described by Saita et al. (2016) and confirmed here. However, one can speculate that mito-PLD could generate a membrane microenvironment preventing simultaneous activation of fusion and fission in a restricted mitochondrial area. This mechanism could coordinate these processes temporally and/or spatially and be a part of a larger signaling network controlling mitochondrial fusion and fission rates/fidelity.
MATERIALS AND METHODS
Cell culture and transfection
HCT116 cells were cultured in McCoy’s 5a (modified) medium supplemented with 10% heat-inactivated fetal bovine serum (FBS), 1 mM sodium pyruvate, MEM nonessential amino acids (Gibco), 100 U/ml penicillin, and 100 mg/ml streptomycin in 5% CO2 at 37°C. Cells were transfected with Lipofectamine2000 (Life Technologies) according to the manufacturer’s instructions. The fine-tuned transfection conditions resulted in >50% of cells being transfected. Cells were used for analyses at 12–20 h after transfection.
Knockout cells
MARCH5−/− HCT116 and MiD49−/− HCT116 cells were obtained using homologous recombination and clustered regularly interspaced short palindromic repeats (CRISPR)/Cas9 gene-editing methods, respectively, and were described previously (Xu et al., 2016). To generate Mff−/−, Drp1−/−, and Opa1−/− HCT116 cells, transcription activator-like effector nuclease (TALEN) technology was applied. The left and right Tale sequences were assembled as reported (Huang et al., 2011b) and cloned into pcDNA3.1/Zeo-Talen(+63) vector to make corresponding TALEN constructs, as previously described (Hasson et al., 2013). The TALEN constructs were then transfected into HCT116 cells with Lipofectamine LTX (Life Technologies), sorted by fluorescence-activated cell sorting, serially diluted into 96-well plates, and then screened with PCR and restriction enzyme digests. Knockouts of respective genes were confirmed by Western blot. For the detailed method, see Hasson et al. (2013). Tale sequence, primer, and restriction digestion details are shown in Table 1 (Drp1−/−/MARCH5−/− and Mff−/−/MARCH5−/− double-knockout cells were generated using the CRISPR/Cas9 system with MARCH5−/− HCT 116 cells as the starting material. The specific targeted sites of CRISP/Cas9 were selected based on the ChopChop web tool (https://chopchop.rc.fas.harvard.edu; Montague et al., 2014), and two pairs of guide RNA (gRNA) target sites with the highest scores were picked out. The first pair of gRNAs for Drp1 was 5′-GCTGCCTCAAATCGTCGTAGTGG-3′ and 5′-GGGAGGGACCTGCTTCCCAGAGG-3′ and for Mff was 5′-GGTGGTGTTTTCAGTGCCAGGGG-3′ and 5′-GTCATCTGACGTTCCTTCAATGG-3′. The second pair of gRNAs for Drp1 was 5′-GGGGTGGAAGCAGAAGAATGGGG-3′ and 5′-CGTTGTCAATTTGACACTTGTGG-3′ and for Mff was 5′-GCAGTGACACATCACTAGGAAGG-3′, and 5′-TGCAGCTTCACTAAGACGACAGG-3′. gRNA sequences were cloned by PCR with the primers Drp1 F1 5′-TTTCTTGGCTTTATATATCTTGTGGAAAGGACGAAACACCGCTGCCTCAAATCGTCGTAG-3′, Drp1 R1 5′-GACTAGCCTTATTTTAACTTGCTATTTCTAGCTCTAAAACCTACGACGATTTGAGGCAGC-3′, Drp1 F2 5′-TTTCTTGGCTTTATATATCTTGTGGAAAGGACGAAACACCGGGAGGGACCTGCTTCCCAG-3′, Drp1 R2 5′-GACTAGCCTTATTTTAACTTGCTATTTCTAGCTCTAAAACCTGGGAAGCAGGTCCCTCCC-3′, Drp1 F3 5′-TTTCTTGGCTTTATATATCTTGTGGAAAGGACGAAACACCGGGGTGGAAGCAGAAGAATG-3′, Drp1 R3 5′-GACTAGCCTTATTTTAACTTGCTATTTCTAGCTCTAAAACCATTCTTCTGCTTCCACCCC-3′, Drp1 F4 5′-TTTCTTGGCTTTATATATCTTGTGGAAAGGACGAAACACCGGTTGTCAATTTGACACTTG-3′, Drp1 R4 5′-GACTAGCCTTATTTTAACTTGCTATTTCTAGCTCTAAAACCAAGTGTCAAATTGACAACC-3′. Mff F1 5′-TTTCTTGGCTTTATATATCTTGTGGAAAGGACGAAACACCGGTGGTGTTTTCAGTGCCAG-3′, Mff R1 5′-GACTAGCCTTATTTTAACTTGCTATTTCTAGCTCTAAAACCTGGCACTGAAAACACCACC-3′, Mff F2 5′-TTTCTTGGCTTTATATATCTTGTGGAAAGGACGAAACACCGTCATCTGACGTTCCTTCAA-3′, Mff R2 5′-GACTAGCCTTATTTTAACTTGCTATTTCTAGCTCTAAAACTTGAAGGAACGTCAGATGAC-3′, Mff F3 5′-TTTCTTGGCTTTATATATCTTGTGGAAAGGACGAAACACCGCAGTGACACATCACTAGGA-3′, Mff R3 5′-GACTAGCCTTATTTTAACTTGCTATTTCTAGCTCTAAAACTCCTAGTGATGTGTCACTGC-3′, Mff F4; 5′-TTTCTTGGCTTTATATATCTTGTGGAAAGGACGAAACACCGGCAGCTTCACTAAGACGAC-3′, and Mff R4; 5′-GACTAGCCTTATTTTAACTTGCTATTTCTAGCTCTAAAACGTCGTCTTAGTGAAGCTGCC-3′. The PCR products were incorporated into AflII-linearized gRNA cloning vector (www.addgene.org/41824/) using Gibson assembly as described (Mali et al., 2013). The resulting plasmids were verified by sequence analysis. Each pair of gRNA plasmids was cotransfected with Cas9 into MARCH5−/− HCT116 cells. Knockout clones were identified with PCR and Western blot.
TABLE 1:
Design of TALEN.
| Gene | Exon | Talen-L (5′ to 3′) | Talen-R (5′ to 3′) | Primers | Digestion |
|---|---|---|---|---|---|
| Mff | 4 | CTATGAGTGAAAATGC | CATTTCTGACCAGCTG | Forward: CAACCGTAGAAGCCAGGAAG | PvuII cuts into 488, 280 base pairs |
| Reverse: AGCTGGAAAGGACCAGTTCA | |||||
| Opa1 | 3 | GGGAAATTGATGAGTA | ATTTTAATGTTCATGA | Forward: AGGGCAAAATTATGAAACCTG | ClaI cuts into 220, 336 base pairs |
| Reverse: AAAATGCTCCAAACAGTTAGTGG | |||||
| Drp1 | 2 | CAGTGCTAGAAAGCCTGG | GACAATTCCAGTACCTC | Forward: TGAAACCTGGTTGGTGGAGT | EcoO109I cuts into 244, 596 base pairs |
| Reverse: AAAGATGCATACTACTTCTCACAGG |
Expression constructs and mutagenesis
MYC-MARCH5 and MYC-MARCH5H43W were described previously (Xu et al., 2016). Two PCR amplifications were performed using 5′-CTGCAGGAATTCGATATGCCGGACCAAGCCCTACAG-3′ as the forward primer and 5′-ATCGATAAGCTTGATTTACTGTTTGAAGTAAACTTTAAATG-3′ as the backward primer with MYC-MARCH5 and MYC-MARCH5H43W as templates, respectively. The resultant products were cloned into EcoRV-linearized pCMV-3Tag-7 mammalian expression vector (Agilent Technologies), using Gibson assembly to generate MYC-tagged MARCH5 mutants, MARCH5ΔCtail, MARCH5H43W/Δctail, MARCH5A96L, MARCH5A100L, MARCH5G103L, MARCH5G107L, MARCH5A113L, MARCH5G117L, MARCH5A220L, MARCH5G224L, MARCH5A247L, MARCH5A251L, MARCH5Y261F, MARCH5Y272F, MARCH5Y261F/Y272F, MARCH5∆272-275, MARCH5∆269-275, MARCH5∆263-275, MARCH5∆1-5, MARCH5∆1-8, MARCH5∆259-266, MARCH5H43W/∆259-266, MARCH5∆1-208, and MARCH5∆1-98.
Immunofluorescence
Immunofluorescence labeling was performed as previously described (Li et al., 2015; Xu et al., 2016). Briefly, cells grown in two-well chamber slides (model 1, German borosilicate; Labtec) were fixed with prewarmed 37°C 4% paraformaldehyde in phosphate-buffered saline (PBS) solution for 20 min at room temperature and then permeabilized with 0.15% Triton X-100 in PBS for 20 min at room temperature. After blocking with 7.5% bovine serum albumin (BSA) in PBS for 45 min, samples were incubated with primary antibodies in 7.5% BSA in PBS for 90 min at room temperature, followed by three washes with 7.5% BSA in PBS and incubation with secondary antibodies diluted in blocking buffer for 45 min at room temperature. Samples were washed with PBS at room temperature and imaged directly in PBS within 2 d after immunofluorescence processing. The primary antibodies were anti-Tom20 polyclonal antibody (pAb; Santa Cruz Biotechnology), anti-Mcl1 monoclonal antibody (mAb; Santa Cruz Biotechnology), anti-Drp1 mAb (BD Biosciences), anti–cytochrome c mAb (BD Biosciences), anti-Pex14 pAb (ProteinTech), anti–conjugated Ub (FK2) mAb (Millipore), and anti-MYC tag pAb (provided by Mervyn Monteiro, University of Maryland School of Medicine, Baltimore, MD; Xu et al., 2016). Secondary antibodies were anti-mouse or anti-rabbit Alexa Fluor 488, anti-mouse or anti-rabbit Alexa Fluor 546, and anti-rabbit Alexa Fluor 637 (all from Life Technologies).
Image acquisition and analysis
Images were acquired with either a Zeiss LSM 880 confocal microscope equipped with an Airyscan superresolution imaging module, using 63/1.40 Plan-Apochromat Oil DIC M27 objective lens (Zeiss MicroImaging) as described (Xu et al., 2016), or a Zeiss AxioObserver Z1 fluorescence microscope equipped with a 100/1.45 a-Plan-FLUAR objective lens (Zeiss MicroImaging, Thornwood, NJ), and an ApoTome unit (enabling high-resolution structured illumination image acquisition; Xu et al., 2011; Li et al., 2015). Z-stacks covering the entire depth of cells with intervals of 0.025 μm were acquired followed by Airyscan image processing (set at 7) and analyses using ZEN image acquisition and processing software (Zeiss MicroImaging). Maximum intensity projections shown here were also obtained using ZEN software. Image cropping and global adjustments to brightness and contrast were performed using Adobe Photoshop CS6 software (Adobe Systems).
Western blot and immunoprecipitation
Cells were harvested, and total cell protein lysates and subcellular fractions were prepared as described (Li et al., 2015; Xu et al., 2016). For total cell lysates, cells were collected by scrapping into ice-cold PBS, washed with ice-cold PBS, suspended in SDS–PAGE sample buffer, and incubated at 100°C for 10 min, followed by centrifugation at 20,000 × g for 5 min. Supernatants were used for further analysis. Proteins were separated on 4–20% gradient Tris-glycine polyacrylamide gels (Invitrogen), transferred onto polyvinylidene fluoride membranes (Immobilon-P; Millipore), and incubated with primary antibodies, followed by horseradish peroxidase (HRP)–conjugated anti-mouse (Roche) or anti-rabbit (Roche) secondary antibodies. Blots were detected with Super Signal West Pico ECL reagent (Thermo Scientific Biosciences). Antibodies used for Western blot were anti-MARCH5 pAb (Millipore), anti-MiD49 pAb (Sigma-Aldrich), anti-Mff pAb (ProteinTech), anti-Drp1 mAb (Dlp1; BD Biosciences), anti-p97 pAb (Cell Signaling), anti-Npl4 pAb (ProteinTech), anti-Mcl1 mAb (Santa Cruz Biotechnology), anti-Tom20 pAb (Santa Cruz Biotechnology), anti-Tom22 pAb (ProteinTech), anti–MYC tag pAb (provided by Mervyn Monteiro; Xu et al., 2016), anti-Opa1 mAb (BD Biosciences), anti-Mfn1 pAb (provided R. J. Youle, National Institutes of Health, Bethesda, MD; verified and described earlier [ Tanaka et al., 2010; Xu et al., 2016]), anti-Mfn2 mAb (Abcam), anti-ubiquitin mAb (Santa Cruz Biotechnology), and anti-Clpp pAb (ProteinTech).
Immunoprecipitation under denaturing conditions was performed as described (Xu et al., 2016). Briefly, cells were collected and suspended in denaturing buffer (1% SDS, 5 mM EDTA, 10 mM β-mercaptoethanol). Samples were incubated at 100°C for 10 min, centrifuged to remove unsolubilized material, and diluted 10 times with ice-cold IP buffer (20 mM Tris-HCl, pH 7.5, 150 mM NaCl, 1 mM EDTA, 0.5% NP-40, 5 mM N-ethylmaleimide, and protease inhibitors). Proteins were immunoprecipitated using anti-MYC mAb-conjugated agarose beads (Clontech Takara). Nondenaturing immunoprecipitation was performed as described, except that cells were lysed directly in ice-cold IP buffer and incubation in denaturing buffer was not included. For cross-linked immunoprecipitation, cells were washed with ice-cold PBS (containing Ca2+ and Mg2+), followed by addition of membrane-permeable cross-linker DSP (2 mM) to the cell culture dishes. After incubation for 2 h at 4°C, cells were washed with ice-cold PBS and processed as described for nondenaturing immunoprecipitation. Intensities of specific proteins were analyzed and quantified using ImageJ software (National Institutes of Health, Bethesda, MD).
BioID proximity assay
MARCH5 wild-type and MARCH5H43W coding sequences were cloned into MCS-BirA(R118G)-HA vector (Roux et al., 2012, 2013; a gift from Kyle Roux; Addgene plasmid 36047) by using NheI and BamHI restriction sites. The constructs MARCH5-BirA(R118G)-HA, MARCH5H43W-BirA(R118G)-HA, and the BirA(R118G)-HA (as a control) were transfected into cells using Lipofectamine 2000 transfection reagent (Life Technologies). At the time of transfections, cells were treated with 50 mM biotin for 24 h and then lysed in IP buffer for 30 min at 4°C. Nonsolubilized material was removed by centrifugation. Samples were incubated with streptavidin magnetic beads (New England Biolabs) on a rotator at 4°C overnight. After incubation, samples were washed five times with IP buffer and then processed for and analyzed by mass spectrometry to identify eluted proteins.
Quantitative reverse transcriptase PCR
Total RNAs were isolated from cell samples by TRIzol (Invitrogen) in triplicate, and 1 µg of total RNA of each sample was reverse transcribed by Superscript III (Invitrogen) following the manufacturer’s protocol. For qRT-PCR, 10 ng of cDNA was used per well in triplicates using LightCycler 480 Sybr Green I Master (Roche), following the manufacturer’s protocol. Reactions were run on the LightCycler 480 system (Roche). Fold induction was calculated by the absolute quantification method. A standard curve was made for reference gene RPLP0 by serial dilutions of genomic DNA from 100 ng to 3.125 g. The following primers were used: DRP1, forward, 5′-AGGTTGCCCGTGACAAATGA-3′, and reverse, 5′-ATCAGCAAAGTCGGGGTG TT-3′. MCL1, forward, 5′-AAGCCAATGGGCAGGTCT-3′, and reverse: 5′-TGTCCAGTTTCCGAAGCAT-3′. MFF, forward, 5′-CACCACCTCGTGTACTTACGC-3′, and reverse, 5′-CCGCTCTCTTTTTAGTCTGCC-3′. MFN1 forward, 5′-ATGACCTGGTGTTAGTAGACAGT-3′, and reverse: 5′-AGACATCAGCATCTAGGCAAAAC-3′. MFN2 forward, 5′-CACATGGAGCGTTGTACCAG-3′, and reverse, 5′-TTGAGCACCTCCTTAGCAGAC-3′. MID49, forward, 5′-GCAACCAATCCACCAACAGAAT-3′, and reverse, 5′-CCGGAAAAGGCGTTAAGTCAC-3′. TOM20 forward, 5′-AGGTCTTACAGCAAACTCTTCC-3′, and reverse, 5′-ATTCCACATCATCTTCAGCCAA-3′. RPLP0, forward, 5′-CAGCAAGTGGGAAGGTGTAATCC-3′, and reverse, 5′-CCCATTCTATCATCAACGGGTACAA-3′.
Mitochondrial fusion assay
Cells were grown in two-well chamber slides (model 1, German borosilicate; Labtec) and imaged in Phenol Red–free DMEM supplemented with 10% heat-inactivated FBS, 2 mM GlutaMAX, 1 mM sodium pyruvate, MEM nonessential amino acids, 100 U/ml penicillin, 100 mg/ml streptomycin, and 25 mM 4-(2-hydroxyethyl)-1-piperazineethanesulfonic acid, pH 7.4, at room temperature. A Mito-PAGFP–based mitochondrial fusion assay was performed using a Zeiss LSM 510 META confocal microscope (Zeiss MicroImaging) equipped with Plan-Apochromat 100×/1.4D oil DIC M27 objective lens (Zeiss MicroImaging) as described (Xu et al., 2016). Briefly, after acquisition of a preactivation image, an ∼5-μm-diameter circular region of interest (ROI) was photoactivated by brief irradiation with 351/364-nm light (Coherent Enterprise ion laser, 80.0 mW), followed by time-lapse imaging using 488-nm excitation light (488-nm argon ion laser, 25.0 mW, set at 0.3%). Nine postactivation images were collected, with the interval between images set to ∼2 min. To avoid z-section shift, focus was maintained using the Multi-time Macro and the autofocusing system (uses line scans to detect the reflection off the coverglass). Images were acquired using ZEN 2009 image acquisition software (Zeiss MicroImaging). To quantify the dynamics of mitochondrial fusion, the time-lapse images of each cell were analyzed using ImageJ. The 17 time-lapse images of each single-cell time-lapse experiment were thresholded and converted into binary images using the brightest pixels from the first image (preactivated) as an intensity threshold. Pixels in the consecutive 16 images (postactivation images) that exceeded this fluorescence intensity threshold were taken as containing activated mito-PAGFP signal and were assigned a value of 1; other pixels were taken as background and assigned a value of 0. The number of pixels with mito-PAGFP signal were summed as a measure of the cellular area with activated mito-PAGFP. The time-dependent mito-PAGFP–containing area obtained for each cell was normalized with respect to its maximal and minimal values. The results from multiple cells were aligned with respect to the time at which each cell reached the maximally activated area. The time-dependent results were averaged together.
Supplementary Material
Acknowledgments
We thank Pamela Wright for insightful comments on the manuscript, Alma Arnold for help with Airyscan imaging, Carl Zeiss Microscopy for access to an LSM 880/Airyscan imaging system, David Goodlett and staff of University of Maryland School of Pharmacy Mass Spectrometry Center for help with mass spectrometry protein analysis, and Liron Boyman and W. Jonathan Lederer for access to the LSM510 imaging system and help with mitochondrial fusion assays. We also gratefully acknowledge financial support from the National Institute of General Medical Science (Grant RO1 GM083131 to M.K.). C.W. is supported in part by the Intramural Research Program of the National Institutes of Neurological Disorders and Stroke, National Institutes of Health.
Abbreviations used:
- OMM
outer mitochondrial membrane
- Ub
ubiquitin.
Footnotes
This article was published online ahead of print in MBoC in Press (http://www.molbiolcell.org/cgi/doi/10.1091/mbc.E16-04-0208) on December 8, 2016.
REFERENCES
- Adachi Y, Itoh K, Yamada T, Cerveny KL, Suzuki TL, Macdonald P, Frohman MA, Ramachandran R, Iijima M, Sesaki H. Coincident phosphatidic acid interaction restrains Drp1 in mitochondrial division. Mol Cell. 2016;63:1034–1043. doi: 10.1016/j.molcel.2016.08.013. [DOI] [PMC free article] [PubMed] [Google Scholar]
- Anand R, Wai T, Baker MJ, Kladt N, Schauss AC, Rugarli E, Langer T. The i-AAA protease YME1L and OMA1 cleave OPA1 to balance mitochondrial fusion and fission. J Cell Biol. 2014;204:919–929. doi: 10.1083/jcb.201308006. [DOI] [PMC free article] [PubMed] [Google Scholar]
- Berman SB, Chen YB, Qi B, McCaffery JM, Rucker EB 3rd, Goebbels S, Nave KA, Arnold BA, Jonas EA, Pineda FJ, Hardwick JM. Bcl-x L increases mitochondrial fission, fusion, and biomass in neurons. J Cell Biol. 2009;184:707–719. doi: 10.1083/jcb.200809060. [DOI] [PMC free article] [PubMed] [Google Scholar]
- Bezawork-Geleta A, Brodie EJ, Dougan DA, Truscott KN. LON is the master protease that protects against protein aggregation in human mitochondria through direct degradation of misfolded proteins. Sci Rep. 2015;5:17397. doi: 10.1038/srep17397. [DOI] [PMC free article] [PubMed] [Google Scholar]
- Bleazard W, McCaffery JM, King EJ, Bale S, Mozdy A, Tieu Q, Nunnari J, Shaw JM. The dynamin-related GTPase Dnm1 regulates mitochondrial fission in yeast. Nat Cell Biol. 1999;1:298–304. doi: 10.1038/13014. [DOI] [PMC free article] [PubMed] [Google Scholar]
- Bonomini F, Rodella LF, Rezzani R. Metabolic syndrome, aging and involvement of oxidative stress. Aging Dis. 2015;6:109–120. doi: 10.14336/AD.2014.0305. [DOI] [PMC free article] [PubMed] [Google Scholar]
- Braschi E, Zunino R, McBride HM. MAPL is a new mitochondrial SUMO E3 ligase that regulates mitochondrial fission. EMBO Rep. 2009;10:748–754. doi: 10.1038/embor.2009.86. [DOI] [PMC free article] [PubMed] [Google Scholar]
- Brooks C, Wei Q, Feng L, Dong G, Tao Y, Mei L, Xie ZJ, Dong Z. Bak regulates mitochondrial morphology and pathology during apoptosis by interacting with mitofusins. Proc Natl Acad Sci USA. 2007;104:11649–11654. doi: 10.1073/pnas.0703976104. [DOI] [PMC free article] [PubMed] [Google Scholar]
- Chen H, Detmer SA, Ewald AJ, Griffin EE, Fraser SE, Chan DC. Mitofusins Mfn1 and Mfn2 coordinately regulate mitochondrial fusion and are essential for embryonic development. J Cell Biol. 2003;160:189–200. doi: 10.1083/jcb.200211046. [DOI] [PMC free article] [PubMed] [Google Scholar]
- Chen H, Ren S, Clish C, Jain M, Mootha V, McCaffery JM, Chan DC. Titration of mitochondrial fusion rescues Mff-deficient cardiomyopathy. J Cell Biol. 2015;211:795–805. doi: 10.1083/jcb.201507035. [DOI] [PMC free article] [PubMed] [Google Scholar]
- Chen H, Vermulst M, Wang YE, Chomyn A, Prolla TA, McCaffery JM, Chan DC. Mitochondrial fusion is required for mtDNA stability in skeletal muscle and tolerance of mtDNA mutations. Cell. 2010;141:280–289. doi: 10.1016/j.cell.2010.02.026. [DOI] [PMC free article] [PubMed] [Google Scholar]
- Chen Z, Zhong Y, Wang Y, Xu S, Liu Z, Baskakov IV, Monteiro MJ, Karbowski M, Shen Y, Fang S. Ubiquitination-induced fluorescence complementation (UiFC) for detection of K48 ubiquitin chains in vitro and in live cells. PLoS One. 2013;8:e73482. doi: 10.1371/journal.pone.0073482. [DOI] [PMC free article] [PubMed] [Google Scholar]
- Choi SY, Huang P, Jenkins GM, Chan DC, Schiller J, Frohman MA. A common lipid links Mfn-mediated mitochondrial fusion and SNARE-regulated exocytosis. Nat Cell Biol. 2006;8:1255–1262. doi: 10.1038/ncb1487. [DOI] [PubMed] [Google Scholar]
- Cleland MM, Norris KL, Karbowski M, Wang C, Suen DF, Jiao S, George NM, Luo X, Li Z, Youle RJ. Bcl-2 family interaction with the mitochondrial morphogenesis machinery. Cell Death Differ. 2011;18:235–247. doi: 10.1038/cdd.2010.89. [DOI] [PMC free article] [PubMed] [Google Scholar]
- Cobb CA, Cole MP. Oxidative and nitrative stress in neurodegeneration. Neurobiol Dis. 2015;84:4–21. doi: 10.1016/j.nbd.2015.04.020. [DOI] [PMC free article] [PubMed] [Google Scholar]
- Davis AJ, Sepuri NB, Holder J, Johnson AE, Jensen RE. Two intermembrane space TIM complexes interact with different domains of Tim23p during its import into mitochondria. J Cell Biol. 2000;150:1271–1282. doi: 10.1083/jcb.150.6.1271. [DOI] [PMC free article] [PubMed] [Google Scholar]
- Escobar-Henriques M, Langer T. Dynamic survey of mitochondria by ubiquitin. EMBO Rep. 2014;15:231–243. doi: 10.1002/embr.201338225. [DOI] [PMC free article] [PubMed] [Google Scholar]
- Escobar-Henriques M, Westermann B, Langer T. Regulation of mitochondrial fusion by the F-box protein Mdm30 involves proteasome-independent turnover of Fzo1. J Cell Biol. 2006;173:645–650. doi: 10.1083/jcb.200512079. [DOI] [PMC free article] [PubMed] [Google Scholar]
- Friedman JR, Nunnari J. Mitochondrial form and function. Nature. 2014;505:335–343. doi: 10.1038/nature12985. [DOI] [PMC free article] [PubMed] [Google Scholar]
- Gandre-Babbe S, van der Bliek AM. The novel tail-anchored membrane protein Mff controls mitochondrial and peroxisomal fission in mammalian cells. Mol Biol Cell. 2008;19:2402–2412. doi: 10.1091/mbc.E07-12-1287. [DOI] [PMC free article] [PubMed] [Google Scholar]
- Guedes-Dias P, Pinho BR, Soares TR, de Proenca J, Duchen MR, Oliveira JM. Mitochondrial dynamics and quality control in Huntington’s disease. Neurobiol Dis. 2016;90:51–77. doi: 10.1016/j.nbd.2015.09.008. [DOI] [PubMed] [Google Scholar]
- Hasson SA, Kane LA, Yamano K, Huang CH, Sliter DA, Buehler E, Wang C, Heman-Ackah SM, Hessa T, Guha R, et al. High-content genome-wide RNAi screens identify regulators of parkin upstream of mitophagy. Nature. 2013;504:291–295. doi: 10.1038/nature12748. [DOI] [PMC free article] [PubMed] [Google Scholar]
- Huang H, Gao Q, Peng X, Choi SY, Sarma K, Ren H, Morris AJ, Frohman MA. piRNA-associated germline nuage formation and spermatogenesis require MitoPLD profusogenic mitochondrial-surface lipid signaling. Dev Cell. 2011a;20:376–387. doi: 10.1016/j.devcel.2011.01.004. [DOI] [PMC free article] [PubMed] [Google Scholar]
- Huang P, Xiao A, Zhou M, Zhu Z, Lin S, Zhang B. Heritable gene targeting in zebrafish using customized TALENs. Nat Biotechnol. 2011b;29:699–700. doi: 10.1038/nbt.1939. [DOI] [PubMed] [Google Scholar]
- Inuzuka H, Shaik S, Onoyama I, Gao D, Tseng A, Maser RS, Zhai B, Wan L, Gutierrez A, Lau AW, et al. SCF(FBW7) regulates cellular apoptosis by targeting MCL1 for ubiquitylation and destruction. Nature. 2011;471:104–109. doi: 10.1038/nature09732. [DOI] [PMC free article] [PubMed] [Google Scholar]
- Karbowski M, Lee YJ, Gaume B, Jeong SY, Frank S, Nechushtan A, Santel A, Fuller M, Smith CL, Youle RJ. Spatial and temporal association of Bax with mitochondrial fission sites, Drp1, and Mfn2 during apoptosis. J Cell Biol. 2002;159:931–938. doi: 10.1083/jcb.200209124. [DOI] [PMC free article] [PubMed] [Google Scholar]
- Karbowski M, Neutzner A, Youle RJ. The mitochondrial E3 ubiquitin ligase MARCH5 is required for Drp1 dependent mitochondrial division. J Cell Biol. 2007;178:71–84. doi: 10.1083/jcb.200611064. [DOI] [PMC free article] [PubMed] [Google Scholar]
- Karbowski M, Norris KL, Cleland MM, Jeong SY, Youle RJ. Role of Bax and Bak in mitochondrial morphogenesis. Nature. 2006;443:658–662. doi: 10.1038/nature05111. [DOI] [PubMed] [Google Scholar]
- Karbowski M, Youle RJ. Regulating mitochondrial outer membrane proteins by ubiquitination and proteasomal degradation. Curr Opin Cell Biol. 2011;23:476–482. doi: 10.1016/j.ceb.2011.05.007. [DOI] [PMC free article] [PubMed] [Google Scholar]
- Kim HJ, Nagano Y, Choi SJ, Park SY, Kim H, Yao TP, Lee JY. HDAC6 maintains mitochondrial connectivity under hypoxic stress by suppressing MARCH5/MITOL dependent MFN2 degradation. Biochem Biophys Res Commun. 2015;464:1235–1240. doi: 10.1016/j.bbrc.2015.07.111. [DOI] [PubMed] [Google Scholar]
- Kim SH, Park YY, Yoo YS, Cho H. Self-clearance mechanism of mitochondrial E3 ligase MARCH5 contributes to mitochondria quality control. FEBS J. 2016;283:294–304. doi: 10.1111/febs.13568. [DOI] [PubMed] [Google Scholar]
- Koch A, Thiemann M, Grabenbauer M, Yoon Y, McNiven MA, Schrader M. Dynamin-like protein 1 is involved in peroxisomal fission. J Biol Chem. 2003;278:8597–8605. doi: 10.1074/jbc.M211761200. [DOI] [PubMed] [Google Scholar]
- Korobova F, Ramabhadran V, Higgs HN. An actin-dependent step in mitochondrial fission mediated by the ER-associated formin INF2. Science. 2013;339:464–467. doi: 10.1126/science.1228360. [DOI] [PMC free article] [PubMed] [Google Scholar]
- Labbe K, Murley A, Nunnari J. Determinants and functions of mitochondrial behavior. Annu Rev Cell Dev Biol. 2014;30:357–391. doi: 10.1146/annurev-cellbio-101011-155756. [DOI] [PubMed] [Google Scholar]
- Labrousse AM, Zappaterra MD, Rube DA, van der Bliek AM. C. elegans dynamin-related protein DRP-1 controls severing of the mitochondrial outer membrane. Mol Cell. 1999;4:815–826. doi: 10.1016/s1097-2765(00)80391-3. [DOI] [PubMed] [Google Scholar]
- Lee YJ, Jeong SY, Karbowski M, Smith CL, Youle RJ. Roles of the mammalian mitochondrial fission and fusion mediators Fis1, Drp1, and Opa1 in apoptosis. Mol Biol Cell. 2004;15:5001–5011. doi: 10.1091/mbc.E04-04-0294. [DOI] [PMC free article] [PubMed] [Google Scholar]
- Lewis SC, Uchiyama LF, Nunnari J. ER-mitochondria contacts couple mtDNA synthesis with mitochondrial division in human cells. Science. 2016;353:aaf5549. doi: 10.1126/science.aaf5549. [DOI] [PMC free article] [PubMed] [Google Scholar]
- Li S, Xu S, Roelofs BA, Boyman L, Lederer WJ, Sesaki H, Karbowski M. Transient assembly of F-actin on the outer mitochondrial membrane contributes to mitochondrial fission. J Cell Biol. 2015;208:109–123. doi: 10.1083/jcb.201404050. [DOI] [PMC free article] [PubMed] [Google Scholar]
- Loson OC, Song Z, Chen H, Chan DC. Fis1, Mff, MiD49, and MiD51 mediate Drp1 recruitment in mitochondrial fission. Mol Biol Cell. 2013;24:659–667. doi: 10.1091/mbc.E12-10-0721. [DOI] [PMC free article] [PubMed] [Google Scholar]
- Mali P, Aach J, Stranges PB, Esvelt KM, Moosburner M, Kosuri S, Yang L, Church GM. CAS9 transcriptional activators for target specificity screening and paired nickases for cooperative genome engineering. Nat Biotechnol. 2013;31:833–838. doi: 10.1038/nbt.2675. [DOI] [PMC free article] [PubMed] [Google Scholar]
- Mishra P, Chan DC. Metabolic regulation of mitochondrial dynamics. J Cell Biol. 2016;212:379–387. doi: 10.1083/jcb.201511036. [DOI] [PMC free article] [PubMed] [Google Scholar]
- Montague TG, Cruz JM, Gagnon JA, Church GM, Valen E. CHOPCHOP: a CRISPR/Cas9 and TALEN web tool for genome editing. Nucleic Acids Res. 2014;42:W401–W407. doi: 10.1093/nar/gku410. [DOI] [PMC free article] [PubMed] [Google Scholar]
- Morciano G, Giorgi C, Balestra D, Marchi S, Perrone D, Pinotti M, Pinton P. Mcl-1 involvement in mitochondrial dynamics is associated with apoptotic cell death. Mol Biol Cell. 2016;27:20–34. doi: 10.1091/mbc.E15-01-0028. [DOI] [PMC free article] [PubMed] [Google Scholar]
- Nakamura N, Hirose S. Regulation of mitochondrial morphology by USP30, a deubiquitinating enzyme present in the mitochondrial outer membrane. Mol Biol Cell. 2008;19:1903–1911. doi: 10.1091/mbc.E07-11-1103. [DOI] [PMC free article] [PubMed] [Google Scholar]
- Nakamura N, Kimura Y, Tokuda M, Honda S, Hirose S. MARCH-V is a novel mitofusin 2- and Drp1-binding protein able to change mitochondrial morphology. EMBO Rep. 2006;7:1019–1022. doi: 10.1038/sj.embor.7400790. [DOI] [PMC free article] [PubMed] [Google Scholar]
- Narendra D, Tanaka A, Suen DF, Youle RJ. Parkin is recruited selectively to impaired mitochondria and promotes their autophagy. J Cell Biol. 2008;183:795–803. doi: 10.1083/jcb.200809125. [DOI] [PMC free article] [PubMed] [Google Scholar]
- Nunnari J, Marshall WF, Straight A, Murray A, Sedat JW, Walter P. Mitochondrial transmission during mating in Saccharomyces cerevisiae is determined by mitochondrial fusion and fission and the intramitochondrial segregation of mitochondrial DNA. Mol Biol Cell. 1997;8:1233–1242. doi: 10.1091/mbc.8.7.1233. [DOI] [PMC free article] [PubMed] [Google Scholar]
- Olichon A, Elachouri G, Baricault L, Delettre C, Belenguer P, Lenaers G. OPA1 alternate splicing uncouples an evolutionary conserved function in mitochondrial fusion from a vertebrate restricted function in apoptosis. Cell Death Differ 14, 682–692. 2006 doi: 10.1038/sj.cdd.4402048. [DOI] [PubMed] [Google Scholar]
- Otera H, Wang C, Cleland MM, Setoguchi K, Yokota S, Youle RJ, Mihara K. Mff is an essential factor for mitochondrial recruitment of Drp1 during mitochondrial fission in mammalian cells. J Cell Biol. 2010;191:1141–1158. doi: 10.1083/jcb.201007152. [DOI] [PMC free article] [PubMed] [Google Scholar]
- Otsuga D, Keegan BR, Brisch E, Thatcher JW, Hermann GJ, Bleazard W, Shaw JM. The dynamin-related GTPase, Dnm1p, controls mitochondrial morphology in yeast. J Cell Biol. 1998;143:333–349. doi: 10.1083/jcb.143.2.333. [DOI] [PMC free article] [PubMed] [Google Scholar]
- Palmer CS, Elgass KD, Parton RG, Osellame LD, Stojanovski D, Ryan MT. Adaptor proteins MiD49 and MiD51 can act independently of Mff and Fis1 in Drp1 recruitment and are specific for mitochondrial fission. J Biol Chem. 2013;288:27584–27593. doi: 10.1074/jbc.M113.479873. [DOI] [PMC free article] [PubMed] [Google Scholar]
- Palmer CS, Osellame LD, Laine D, Koutsopoulos OS, Frazier AE, Ryan MT. MiD49 and MiD51, new components of the mitochondrial fission machinery. EMBO Rep. 2011;12:565–573. doi: 10.1038/embor.2011.54. [DOI] [PMC free article] [PubMed] [Google Scholar]
- Park YY, Cho H. Mitofusin 1 is degraded at G2/M phase through ubiquitylation by MARCH5. Cell Div. 2012;7:25. doi: 10.1186/1747-1028-7-25. [DOI] [PMC free article] [PubMed] [Google Scholar]
- Park YY, Lee S, Karbowski M, Neutzner A, Youle RJ, Cho H. Loss of MARCH5 mitochondrial E3 ubiquitin ligase induces cellular senescence through dynamin-related protein 1 and mitofusin 1. J Cell Sci. 2010;123:619–626. doi: 10.1242/jcs.061481. [DOI] [PMC free article] [PubMed] [Google Scholar]
- Park YY, Nguyen OT, Kang H, Cho H. MARCH5-mediated quality control on acetylated Mfn1 facilitates mitochondrial homeostasis and cell survival. Cell Death Dis. 2014;5:e1172. doi: 10.1038/cddis.2014.142. [DOI] [PMC free article] [PubMed] [Google Scholar]
- Perciavalle RM, Stewart DP, Koss B, Lynch J, Milasta S, Bathina M, Temirov J, Cleland MM, Pelletier S, Schuetz JD, et al. Anti-apoptotic MCL-1 localizes to the mitochondrial matrix and couples mitochondrial fusion to respiration. Nat Cell Biol. 2012;14:575–583. doi: 10.1038/ncb2488. [DOI] [PMC free article] [PubMed] [Google Scholar]
- Roux KJ, Kim DI, Burke B. BioID: a screen for protein-protein interactions. Curr Protoc Protein Sci. 2013;74:Unit 19.23. doi: 10.1002/0471140864.ps1923s74. [DOI] [PubMed] [Google Scholar]
- Roux KJ, Kim DI, Raida M, Burke B. A promiscuous biotin ligase fusion protein identifies proximal and interacting proteins in mammalian cells. J Cell Biol. 2012;196:801–810. doi: 10.1083/jcb.201112098. [DOI] [PMC free article] [PubMed] [Google Scholar]
- Saita S, Ishihara T, Maeda M, Iemura S, Natsume T, Mihara K, Ishihara N. Distinct types of protease systems are involved in homeostasis regulation of mitochondrial morphology via balanced fusion and fission. Genes Cells. 2016;21:408–424. doi: 10.1111/gtc.12351. [DOI] [PubMed] [Google Scholar]
- Shen L, Zhi L, Hu W, Wu MX. IEX-1 targets mitochondrial F1Fo-ATPase inhibitor for degradation. Cell Death Differ. 2009;16:603–612. doi: 10.1038/cdd.2008.184. [DOI] [PMC free article] [PubMed] [Google Scholar]
- Smirnova E, Griparic L, Shurland DL, van der Bliek AM. Dynamin-related protein Drp1 is required for mitochondrial division in mammalian cells. Mol Biol Cell. 2001;12:2245–2256. doi: 10.1091/mbc.12.8.2245. [DOI] [PMC free article] [PubMed] [Google Scholar]
- Sugiura A, Nagashima S, Tokuyama T, Amo T, Matsuki Y, Ishido S, Kudo Y, McBride HM, Fukuda T, Matsushita N, et al. MITOL regulates endoplasmic reticulum-mitochondria contacts via Mitofusin2. Mol Cell. 2013;51:20–34. doi: 10.1016/j.molcel.2013.04.023. [DOI] [PubMed] [Google Scholar]
- Tanaka A, Cleland MM, Xu S, Narendra DP, Suen DF, Karbowski M, Youle RJ. Proteasome and p97 mediate mitophagy and degradation of mitofusins induced by Parkin. J Cell Biol. 2010;191:1367–1380. doi: 10.1083/jcb.201007013. [DOI] [PMC free article] [PubMed] [Google Scholar]
- Varadarajan S, Butterworth M, Wei J, Pellecchia M, Dinsdale D, Cohen GM. Sabutoclax (BI97C1) and BI112D1, putative inhibitors of MCL-1, induce mitochondrial fragmentation either upstream of or independent of apoptosis. Neoplasia. 2013;15:568–578. doi: 10.1593/neo.13230. [DOI] [PMC free article] [PubMed] [Google Scholar]
- Vidoni S, Zanna C, Rugolo M, Sarzi E, Lenaers G. Why mitochondria must fuse to maintain their genome integrity. Antioxid Redox Signal. 2013;19:379–388. doi: 10.1089/ars.2012.4800. [DOI] [PMC free article] [PubMed] [Google Scholar]
- Wai T, Langer T. Mitochondrial dynamics and metabolic regulation. Trends Endocrinol Metab. 2016;27:105–117. doi: 10.1016/j.tem.2015.12.001. [DOI] [PubMed] [Google Scholar]
- Xu S, Cherok E, Das S, Li S, Roelofs BA, Ge SX, Polster BM, Boyman L, Lederer WJ, Wang C, Karbowski M. Mitochondrial E3 ubiquitin ligase MARCH5 controls mitochondrial fission and cell sensitivity to stress-induced apoptosis through regulation of MiD49 protein. Mol Biol Cell. 2016;27:349–359. doi: 10.1091/mbc.E15-09-0678. [DOI] [PMC free article] [PubMed] [Google Scholar]
- Xu S, Peng G, Wang Y, Fang S, Karbowski M. The AAA-ATPase p97 is essential for outer mitochondrial membrane protein turnover. Mol Biol Cell. 2011;22:291–300. doi: 10.1091/mbc.E10-09-0748. [DOI] [PMC free article] [PubMed] [Google Scholar]
- Ye Y, Meyer HH, Rapoport TA. The AAA ATPase Cdc48/p97 and its partners transport proteins from the ER into the cytosol. Nature. 2001;414:652–656. doi: 10.1038/414652a. [DOI] [PubMed] [Google Scholar]
- Yonashiro R, Ishido S, Kyo S, Fukuda T, Goto E, Matsuki Y, Ohmura-Hoshino M, Sada K, Hotta H, Yamamura H, et al. A novel mitochondrial ubiquitin ligase plays a critical role in mitochondrial dynamics. Embo J. 2006;25:3618–3626. doi: 10.1038/sj.emboj.7601249. [DOI] [PMC free article] [PubMed] [Google Scholar]
- Yonashiro R, Sugiura A, Miyachi M, Fukuda T, Matsushita N, Inatome R, Ogata Y, Suzuki T, Dohmae N, Yanagi S. Mitochondrial ubiquitin ligase MITOL ubiquitinates mutant SOD1 and attenuates mutant SOD1-induced reactive oxygen species generation. Mol Biol Cell. 2009;20:4524–4530. doi: 10.1091/mbc.E09-02-0112. [DOI] [PMC free article] [PubMed] [Google Scholar]
- Yoo YS, Park YY, Kim JH, Cho H, Kim SH, Lee HS, Kim TH, Sun Kim Y, Lee Y, Kim CJ, et al. The mitochondrial ubiquitin ligase MARCH5 resolves MAVS aggregates during antiviral signalling. Nat Commun. 2015;6:7910. doi: 10.1038/ncomms8910. [DOI] [PMC free article] [PubMed] [Google Scholar]
- Youle RJ, van der Bliek AM. Mitochondrial fission, fusion, and stress. Science. 2012;337:1062–1065. doi: 10.1126/science.1219855. [DOI] [PMC free article] [PubMed] [Google Scholar]
- Zemirli N, Pourcelot M, Ambroise G, Hatchi E, Vazquez A, Arnoult D. Mitochondrial hyperfusion promotes NF-kappaB activation via the mitochondrial E3 ligase MULAN. FEBS J. 2014;281:3095–3112. doi: 10.1111/febs.12846. [DOI] [PubMed] [Google Scholar]
- Zhong Q, Gao W, Du F, Wang X. Mule/ARF-BP1, a BH3-only E3 ubiquitin ligase, catalyzes the polyubiquitination of Mcl-1 and regulates apoptosis. Cell. 2005;121:1085–1095. doi: 10.1016/j.cell.2005.06.009. [DOI] [PubMed] [Google Scholar]
- Zunino R, Braschi E, Xu L, McBride HM. Translocation of SenP5 from the nucleoli to the mitochondria modulates DRP1-dependent fission during mitosis. J Biol Chem. 2009;284:17783–17795. doi: 10.1074/jbc.M901902200. [DOI] [PMC free article] [PubMed] [Google Scholar]
Associated Data
This section collects any data citations, data availability statements, or supplementary materials included in this article.