

The regulation of subcellular mRNA localization is a crucial but poorly understood aspect of viral and cellular gene expression. This study demonstrates diverse, striking mRNA subcellular trafficking behaviors and unique gene expression profiles intrinsic to discrete cis-acting RNA structural elements isolated from retroviruses and hepadnaviruses.
Abstract
Cis-acting RNA structural elements govern crucial aspects of viral gene expression. How these structures and other posttranscriptional signals affect RNA trafficking and translation in the context of single cells is poorly understood. Herein we describe a multicolor, long-term (>24 h) imaging strategy for measuring integrated aspects of viral RNA regulatory control in individual cells. We apply this strategy to demonstrate differential mRNA trafficking behaviors governed by RNA elements derived from three retroviruses (HIV-1, murine leukemia virus, and Mason-Pfizer monkey virus), two hepadnaviruses (hepatitis B virus and woodchuck hepatitis virus), and an intron-retaining transcript encoded by the cellular NXF1 gene. Striking behaviors include “burst” RNA nuclear export dynamics regulated by HIV-1’s Rev response element and the viral Rev protein; transient aggregations of RNAs into discrete foci at or near the nuclear membrane triggered by multiple elements; and a novel, pulsiform RNA export activity regulated by the hepadnaviral posttranscriptional regulatory element. We incorporate single-cell tracking and a data-mining algorithm into our approach to obtain RNA element–specific, high-resolution gene expression signatures. Together these imaging assays constitute a tractable, systems-based platform for studying otherwise difficult to access spatiotemporal features of viral and cellular gene regulation.
INTRODUCTION
Reverse-transcribing viruses include retroviruses and hepadnaviruses such as the human immunodeficiency virus type 1 (HIV-1) and hepatitis B virus (HBV), respectively. Combined, these viruses cause millions of deaths annually due to the acquired immunodeficiency syndrome (HIV/AIDS) and HBV-associated cirrhosis and/or liver cancer and other diseases (UNAIDS, 2016; WHO, 2016). Both of these families of viruses express essential genes using unspliced or partially spliced mRNAs and are thus under selective pressure to circumvent potent cellular blocks to the nuclear export and translation of mRNAs that bear introns (Le Hir et al., 2003; Nott et al., 2004; Köhler and Hurt, 2007; Siddiqui and Borden, 2012). These viruses overcome these blocks using cis-acting RNA structural elements, encoded within intron-retaining viral RNAs, that recruit select viral or cellular transport proteins capable of ensuring efficient RNA nuclear export and cytoplasmic utilization (Harris and Hope, 2000; Cullen, 2003; Sommer and Heise, 2008; Chen et al., 2014). A thorough understanding of these essential virus–host interfaces and the cellular factors involved is needed to better understand viral posttranscriptional RNA regulation and to inform the development of antiviral strategies capable of selectively abrogating viral gene expression (McKnight and Heinz, 2003; Caly et al., 2012; Vercruysse and Daelemans, 2013; Chen et al., 2014; Grice, 2015).
HIV-1’s Rev response element (RRE) is the most extensively studied RNA posttranscriptional regulatory element. The RRE is a dynamic, ∼350-nucleotide (nt) multiple stem-loop structure that activates viral late gene expression by binding to the viral Rev protein (Pollard and Malim, 1998; Fernandes et al., 2012; Rausch and Grice, 2015; Sherpa et al., 2015). Rev is translated from fully spliced viral mRNAs, trafficked to the nucleus, and allowed to multimerize on the RRE, where it can then recruit the cellular CRM1 nuclear export receptor (also known as exportin-1 or XPO1) through the activity of Rev’s leucine-rich nuclear export signal (NES; Olsen et al., 1990; Malim and Cullen, 1991; Fornerod et al., 1997; Fukuda et al., 1997; Neville et al., 1997). Mutating Rev to no longer bind either the RRE or CRM1 abolishes nuclear export of full-length, unspliced viral genomic RNAs (gRNAs) that serve as mRNAs encoding the Gag and Gag-Pol capsid proteins and a subset of partially spliced viral mRNAs that encode the Vif, Vpu, and Env proteins (Daly et al., 1989; Heaphy et al., 1990; Malim et al., 1990; Pollard and Malim, 1998; Hope, 1999). The RRE is thus traditionally referred to as an “export element.” However, Rev and the RRE may also contribute to other stages of the viral life cycle, including Gag/Gag-Pol translation and genome encapsidation during virion assembly (Brandt et al., 2007; Bolinger and Boris-Lawrie, 2009; Groom et al., 2009a, b; Cockrell et al., 2011). Rev-related proteins and functionally equivalent RRE-like RNA structures are conserved among retroviruses considered genetically complex, that is, they encode one or more regulatory or immunomodulatory genes in addition to the three core structural and replicase genes gag, pol, and env (Vogt, 1997). These viruses include all members of the lentiviridae (e.g., HIV-1 and HIV-2) and deltaretroviridae (e.g., human T-lymphotropic viruses type 1 and type 2) subfamilies and a subset of betaretroviruses, including mouse mammary tumor virus (Indik et al., 2005; Mertz et al., 2005, 2009; Müllner et al., 2008), Jaagsiekte sheep retrovirus (Hofacre et al., 2009; Nitta et al., 2009), and human endogenous retrovirus K (Yang et al., 1999, 2000).
Genetically simpler retroviruses that lack Rev-like proteins are CRM1 independent and instead employ RNA structures known as constitutive transport elements (CTEs) that directly bind components of the cellular NXF1/NXT1 (also known as Tap/p15) nuclear export machinery (Harris and Hope, 2000; Hammarskjöld, 2001; Cullen, 2003; Bolinger and Boris-Lawrie, 2009). The best-characterized CTE is a transferable, ∼150-nt extended stem-loop structure derived from the betaretrovirus Mason-Pfizer monkey virus (M-PMV) that binds two NXF1/NXT1 heterodimers (Bray et al., 1994; Ernst et al., 1997; Pasquinelli et al., 1997; Grüter et al., 1998). Interestingly, a CTE with similar sequence, structure, and activity was recently identified in an intron-retaining variant of the cellular NXF1 mRNA itself, thus suggesting that M-PMV has coopted its CTE from a pre-existing cellular gene regulatory module (Li et al., 2006; Wang et al., 2015). Additional, more structurally complex CTE-like elements have been identified in other retroviruses and endogenous retroelements (Tabernero, 1996, 1997; Ogert and Beemon, 1998; Yang and Cullen, 1999; Paca et al., 2000; Nappi et al., 2001; Wodrich et al., 2001; Lindtner et al., 2002; Ribet et al., 2007), and most recently within the pol open-reading frames of the gammaretroviruses murine leukemia virus (MLV) and xenotropic MLV-related virus (Bartels and Luban, 2014; Pessel-Vivares et al., 2014; Sakuma et al., 2014).
Hepadnaviruses also express genes using intron-retaining mRNAs and thus require the activities of cis-acting RNA structures known as posttranscriptional regulatory elements (PREs; Huang and Liang, 1993; Huang and Yen, 1994, 1995; Donello et al., 1996). That the PRE can potently modulate mRNA transport and/or translation is well-illustrated by the woodchuck hepatitis virus PRE (WPRE), an ∼590-nt sequence frequently included in gene therapy vectors and other expression vectors that markedly boosts the expression of transgenes of diverse origins (Loeb et al., 1999; Zufferey et al., 1999; Paterna et al., 2000; Somia and Verma, 2000; Pfeifer et al., 2001; Hope, 2002; Sinn et al., 2005). HBV’s PRE (HPRE) is an ∼400-nt structure found in all viral mRNAs, including full-length pregenomic RNAs packaged into virions (Sommer and Heise, 2008). The notion that the HPRE functions at least in part as an export element reflects its capacity to replace the RRE functionally in the context of intron-bearing HIV-1 gag-pol mRNAs, other intron-retaining mRNAs (Huang and Yen, 1994, 1995; Donello et al., 1996; Jin et al., 2009), and some intronless transcripts (Huang and Liang, 1993). Depending on the transcript and the context, however, the HPRE may play roles not only in nuclear export (Huang and Liang, 1993; Huang and Yen, 1994, 1995; Donello et al., 1998; Heise et al., 2006; Li et al., 2010) but also in regulating pre-mRNA splicing (Heise et al., 2006; Sommer and Heise, 2008; Huang et al., 2011a) and mRNA stability (Zang et al., 2001; Ehlers et al., 2004). The relative contributions of CRM1, NXF1/NXT1, and/or other factors to HPRE- or WPRE-regulated RNA nuclear egress and cytoplasmic utilization are only partially elucidated (Otero and Hope, 1998; Otero et al., 1998; Zang and Yen, 1999; Zang et al., 2001; Horke et al., 2002; Popa et al., 2002; Li et al., 2009; Chen et al., 2014; Yang et al., 2014).
NXF1/NXT1 is thought to represent the canonical mRNA nuclear export pathway, while CRM1 represents a more specialized RNA export pathway responsible for the nuclear export of only a subset of cellular RNAs, including 5S rRNAs, U small nuclear RNAs, and some mRNAs; in all cases requiring NES-bearing adaptor proteins (Harris and Hope, 2000; Cullen, 2003; Köhler and Hurt, 2007; Siddiqui and Borden, 2012; Natalizio and Wente, 2013; Delaleau and Borden, 2015; Okamura et al., 2015). Why select viruses are adapted to exploit one pathway versus another is still unknown. We and others have hypothesized that trafficking aspects inherent to each nucleocytoplasmic transport program (e.g., NXF1/NXT1 or CRM1 regulated) govern specific events in the cytoplasm relevant to the efficiency of infectious virion production (Cullen, 2003; Swanson et al., 2004; Cochrane et al., 2006; Swanson and Malim, 2006; Pocock et al., 2016). In support of this hypothesis, we have shown that HIV-1 mRNAs in the Rev/RRE/CRM1 pathway exhibit a “burst-like” nuclear export behavior, with viral RNAs leaving the nucleus en masse to flood the cytoplasm in a nonlocalized manner (Pocock et al., 2016). By contrast, the M-PMV CTE and NXF1/NXT1 preferentially link RNAs to microtubules, directing their rapid transport to and from the microtubule-organizing center (MTOC). Molecular dissection of these and other viral RNA trafficking pathways and their functional consequences is an important and attainable goal.
To better address challenges inherent to studying diverse viral (or cellular) cis-acting RNA regulatory elements and other posttranscriptional regulatory signals using traditional biochemical approaches, in this study, we designed and implemented a broadly applicable, quantitative, systems-based, largely automated strategy to directly visualize and measure multiple activities of cis-acting RNA elements in many individual cells simultaneously. We accomplished this goal by integrating a combination of genetic, live-cell video microscopy, and enhanced computational image analysis approaches. The resulting system measures the ability of discrete, transferable RNA elements to reprogram the trafficking and translation of heterologous, two-color, intronless reporter mRNAs encoding the cyan fluorescent protein (CFP) and tagged using MS2-yellow fluorescent protein (YFP) fusion proteins for up to 30 h of reporter gene expression. We tested our system on previously validated HIV-1 RRE and M-PMV CTE sequences and, for the first time, compared these activities with CTE-like regulatory sequences derived from MLV and NXF1 and PREs from HBV and WHV. We applied single-cell tracking and a data-mining algorithm, K-means clustering, to classify CFP expression profiles for a subset of the RNA elements, thereby deriving unique, high-resolution single-cell translation/turnover signatures. Collectively these assays comprise a useful systems-based platform for elucidating novel spatiotemporal aspects of viral and cellular gene regulation.
RESULTS
Three-color system for studying viral RNA regulatory elements
Figure 1A depicts our three-color imaging-based strategy for measuring viral mRNA trafficking and translation effects linked to distinct cis-acting RNA regulatory elements. The system is based on intronless mRNAs encoding a CFP reporter and tracked in living cells using MS2-YFP tagging (Bertrand et al., 1998). Briefly, each cfp transcript is modified to encode 24 copies of the MS2 bacteriophage stem loop (24 x MSL) positioned just upstream of the poly(A) tail (no export element or ∆EE) or a distinct, transferable cis-acting RNA regulatory element in the 3′UTR prior to the poly(A) tail (Figure 1A, RRE shown as an example). Plasmids encoding each mRNA of interest are transfected into HeLa cells engineered to stably express low levels of nuclear-targeted MS2-YFP and also an mCherry-NLS nuclear marker (HeLa-MS2-YFP/mChe-NLS cells; see Materials and Methods for transfection details). Because the MS2-YFP protein dimerizes, up to 48 MS2-YFP proteins are bound to each 24xMSL cassette during transcription, thus forming discrete nuclear punctae that can subsequently be tracked moving from the nucleus to the cytoplasm (Figure 1A). The mCherry-NLS nuclear marker (shown in Figure 1B) was used to reliably track individual cells and also to segment cells computationally into defined nuclear and cytoplasmic regions for measuring changes to MS2-YFP subcellular distribution and CFP intensity.
FIGURE 1:
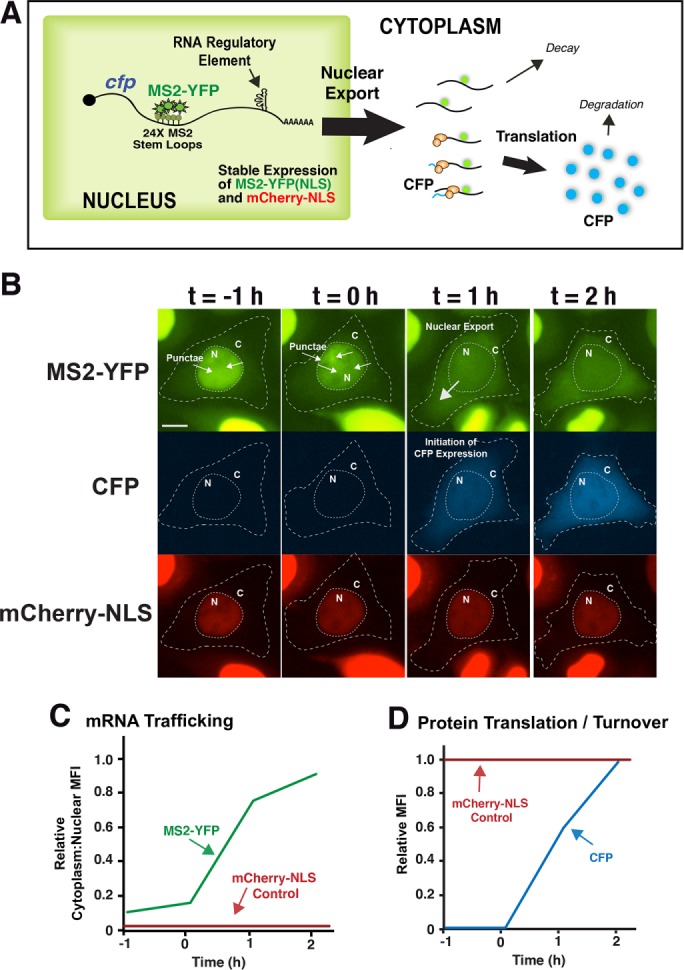
Overview of multicolor imaging strategy. (A) Cartoon depiction of HeLa cells engineered to stably express nuclear MS2-YFP and mCherry-NLS and transfected with plasmids encoding cfp mRNAs bearing 24 copies of the MS2 binding stem loop (24x MSL). These cells allow for direct measurements of mRNA transcription, nuclear export, cytoplasmic trafficking, and translation (Pocock et al., 2016). Upon transcription, cfp-MSL transcripts bind up to 48 MS2-YFP proteins (Femino et al., 1998), thereby forming nuclear punctae that are subsequently trafficked to the cytoplasm during the process of nuclear export. The tagged mRNA is then translated to generate CFP. (B) Images from time-lapse video microscopy showing an example of the processes described in A for cfp mRNAs bearing the 24xMSL cassette and modified to carry the HIV-1 RRE and expressed in the presence of Rev. The MS2-YFP signal transitions from the nucleus to the cytoplasm coincident with the onset of CFP expression (with first detection of CFP signal between t = 0 and t = 1 h). The constitutively expressed mCherry-NLS nuclear marker served as a control for segmenting the cell into nuclear and cytoplasmic compartments, thus allowing for automated measurements of MFI for each reporter. Scale bar: 5 µm. (C, D) Examples of measurements of single-cell mRNA nuclear export and CFP synthesis based on net changes to the cytoplasm-to-nuclear ratio of MS2-YFP MFI (C) and changes to CFP MFI (D) over time.
Figure 1B (and Supplemental Video 1) presents an example of single-cell tracking for transcripts encoding the HIV-1 RRE coexpressed with Rev and imaged over 3 h. The MS2-YFP signal (green) adopts a “mottled” distribution in the nucleus before “burst” export to the cytoplasm coincident with large increases to CFP synthesis (Figure 1B, compare green and blue panels, and Supplemental Video 1). Nuclear export was measured as increases in the ratio of cytoplasmic to nuclear MS2-YFP median fluorescence intensity (MFI) over time (Figure 1C, green trace), while CFP expression was quantified by measuring net increases to CFP MFI (Figure 1D, blue trace). Signals were background subtracted and normalized to single-cell mCherry-NLS levels to control for changes to cell physiology or rare illumination fluctuations due to the LED lamp source over time. Examples of mCherry-NLS signals are depicted in Figure 1, C and D (red traces), to illustrate the utility of this control.
Taken together, these data show that three fluorescent probes (MS2-YFP, CFP, and mCherry-NLS) provide dynamic, quantitative readouts for mRNA trafficking and CFP reporter gene expression in the context of single cells. As described below (Figure 2), an additional important aspect of the system is that it is capable of recording events for >24 h, thus allowing us to detect transient and/or recurring gene expression activities that would otherwise be missed using conventional short-term (i.e., on the order of minutes to hours) imaging strategies.
FIGURE 2:

Diverse mRNA trafficking activities attributable to distinct RNA regulatory elements. The indicated RNA elements were engineered into the 3′UTR of model cfp-24xMSL transcripts depicted on the left and expressed in HeLa-MS2-YFP/mChe-NLS cells as follows: (A) ∆EE (no RNA element control), (B) HIV-1 RRE, (C) HIV-1 RRE expressed in the presence of Rev (R), (D) M-PMV CTE, (E) MLV pol, (F) NXF1 CTE, and (G) WHV WPRE. For each condition, sequences of images are presented from time-lapse video microscopy showing dynamic transitions for MS2-YFP signals in single cells imaged for up to 24 h in this experiment. Scale bars: 10 µm. Graphs on the right present quantification of dynamic phenotypes/transitions observed for >30 CFP-positive cells per condition monitored over the course of the experiment. Error bars represent SD from the mean for three independent experiments.
Differing mRNA trafficking behaviors attributable to distinct cis-acting RNA elements
To directly compare the activities of several diverse viral or cellular cis-acting RNA elements in a single experiment, we monitored cfp-MSL transcripts lacking an export element (∆EE; Figure 2A); transcripts bearing the RRE expressed either without or with Rev (Figure 2, B and C); CTEs or CTE-like elements derived from M-PMV, MLV, and the cellular NXF1 gene (Figure 2, D–F); and the HBV or WHV PREs (Figure 2G, only the WPRE is shown but both elements exhibited similar activities; see Figure 3E). In these experiments, plasmids expressing each transcript were transfected into HeLa-MS2-YFP/mCherry-NLS cells plated in eight-well slides and the cells were imaged for 24 h at 20x magnification, recording YFP, CFP, and mCherry channels at 30 min intervals. An example of three-color raw data acquisition for the WPRE condition is presented in Supplemental Video 2. A control experiment confirming the consistency of the mCherry–nuclear localization signal (mCherry-NLS) signal across more than 24 h for all conditions is shown in Supplemental Video 3. The central panels of Figure 2 show video capture of marked changes to MS2-YFP subcellular localization over time in CFP-expressing cells, with the MS2-YFP signals shown in black on white for visual clarity. Quantification of dynamic single-cell mRNA trafficking behaviors for CFP-expressing cells for each condition is shown in the graphs to the right.
FIGURE 3:

Single-cell analysis reveals a novel pulsiform mRNA export activity attributable to the WHV and HBV PREs. (A) Example of HIV-1 RRE plus Rev “burst” export. Punctae are visible in the nucleus and accumulate over time before the bulk of the MS2-YFP signal, transitioning into the cytoplasm between 13.5 and 30 h. Scale bar: 10 µM. (B) Plot of MS2-YFP cytoplasm:nucleus MFI ratios over time for the cell imaged in A. (C) Example of WPRE-triggered pulsiform mRNA export behavior. As in A, the MS2-YFP signal is evacuated en masse from the nucleus (yellow arrows). However, unlike in A, these burst export events occur repeatedly within the single cell over the course of imaging. Scale bar: 10 µM. (D) Plot of MS2-YFP cytoplasm:nucleus MFI ratios over time for the cell imaged in C. (E) Number of MS2-YFP “burst” mRNA export events observed a per cell basis for ≥20 cells per condition over a set 15 h time course. (F) Nuclear export measured based on aggregated changes to average MS2-YFP cytoplasm:nucleus MFI ratios over time for the indicated conditions. Error bars represent SE for three independent experiments. (G) Reporter levels measured based on aggregated changes to CFP MFI levels over time for the indicated conditions. Error bars represent SE for three independent experiments.
Expression of the parental cfp-MSL control transcript bearing no export element (cfp-∆EE) caused the formation of MS2-YFP nuclear punctae consistent with transcription events followed by induction of a mottled MS2-YFP distribution in the nucleoplasm (Figure 2A and Supplemental Video 4). Although these transcripts were competent for CFP translation (see Figure 3F), we observed only low levels of MS2-YFP signal accumulating in the cytoplasm over time (Figure 2A and Supplemental Video 4). In the absence of Rev, MS2-YFP signals for HIV-1 RRE-bearing transcripts (cfp-RRE) also formed nuclear punctae that similarly transitioned to a mottled distribution in the nucleoplasm (compare Figure 2A with Figure 2B). By contrast, coexpression of Rev activated “burst” nuclear export of the cfp-RRE transcripts, with the bulk of the MS2-YFP signal relocalized from the nucleus to the cytoplasm in >30% of cells (Figure 2C, purple bar in graph, and Supplemental Video 5). These observations were similar to previous observations by our group for full-length, intron-retaining HIV-1 genomic RNAs and other Rev/RRE-dependent viral mRNAs (Pocock et al., 2016). Thus burst export is a potent and intrinsic transferable feature of the Rev/RRE/CRM1 export module. By contrast, the activities of the ∆EE condition established a baseline for expected trafficking and reporter gene expression phenotypes (Figure 2A and Supplemental Video 4).
For transcripts bearing the M-PMV and MLV CTEs (Figure 2, D and E), we frequently observed nuclear punctae coalescing in a single bright focus at or near the nuclear membrane, consistent with our prior description of CTE-linked mRNAs undergoing directed trafficking to the MTOC via microtubules (Pocock et al., 2016). Similar observations were made for the CTE derived from the cellular NXF1 intron-retaining transcript variant (Figure 2F), which is closely related in both structure and function to the M-PMV CTE (Li et al., 2006). For both the M-PMV and NXF1 CTEs, formation of bright MS2-YFP foci was typically followed within 30-60 min by signal accumulating within the nucleoplasm in a mottled distribution (Figure 2, D and F). Interestingly, the MLV pol sequence frequently caused a different behavior, wherein the MS2-YFP focus disappeared and the signal subsequently coalesced into large nucleus-confined speckles (Figure 2E, green bar in graph). Unlike the RRE plus Rev condition, only low levels of signal were detected in the cytoplasm at any time point for the CTE or CTE-like elements (e.g., compare Figure 2C with Figure 2D). Thus these comparative imaging experiments revealed differing RNA trafficking behaviors specific to RRE- or CTE-mediated regulation of our model cfp transcripts. As expected, the structurally similar M-PMV and NXF1 CTEs conferred similar behavioral profiles (compare Figure 2D with Figure 2F). By contrast, the MLV pol sequence, which is much larger and more complex (∼3.5 kb relative to <0.5 kb for M-PMV and NXF1 CTEs), exhibited an additional unique activity, formation of pronounced nuclear speckles.
Identification of a novel pulsiform RNA export activity regulated by the hepadnavirus PRE
Considering the PRE’s established role in markedly enhancing gene expression (Loeb et al., 1999; Zufferey et al., 1999; Paterna et al., 2000; Somia and Verma, 2000; Pfeifer et al., 2001; Hope, 2002; Sinn et al., 2005), we were particularly interested in comparing the RNA trafficking activities of the HBV and WHV PREs to those of the retroviral RRE and CTE structures (Figure 2G [WPRE is shown] and Figure 3, C–G). PRE-linked mRNA trafficking has never before been directly visualized. Interestingly, we observed a “hybrid” mRNA trafficking signature for PRE transcripts, wherein, in some instances, the MS2-YFP signal both coalesced in a single perinuclear focus and also underwent “burst-like” RNA export dynamics similar to the RRE plus Rev condition (Figure 2G). However, we also noted a remarkable difference in the burst events observed for PRE or RRE plus Rev conditions. We typically observed only a single burst event for the RRE-bearing transcripts expressed with Rev, even over many hours of imaging (Figure 2C, see 1 h time point). By contrast, we often observed two or more burst export events per cell for PRE-bearing transcripts (Figure 2G, see 6 and 8 h time points),
Imaging at higher magnification (a 40× instead of a 20× objective, as for the analysis presented in Figure 2) over 20 h confirmed that cfp-RRE plus Rev burst export was characterized by a buildup of MS2-YFP punctae in the nuclear compartment before gradual increases to cytoplasmic signal and concomitant loss of nuclear signal over the course of the imaging experiment (Figure 3, A and B, and Supplemental Video 5). By contrast, for the HPRE or WPRE, burst-like MS2-YFP evacuation from the nucleus was followed by a rapid loss of cytoplasmic signal over time, followed by repeated cycles of MS2-YFP nuclear buildup, burst export, and loss of cytoplasmic signal (compare Figure 3, C and D, with Figure 3, A and B, and Supplemental Video 6 with Supplemental Video 5). Repeated nucleocytoplasmic cycling for the WPRE and HPRE conditions occurred as many as five times per cell over a set time course of 15 h (Figure 3E). In some cells (e.g., the cell featured in Figure 3C and Supplemental Video 6) the periodicity of nucleocytoplasmic flux was less than 2 h (Figure 3D). Thus inclusion of a PRE in a heterologous mRNA context is capable of dramatically reprogramming nucleocytoplasmic transport behaviors. Such pulsiform RNA nuclear export activity has never previously been described and could have bearing on why these elements (in particular the WPRE) are useful for stimulating gene expression from vectors and in the context of the hepadnaviral life cycle.
Correlating RRE- and PRE-linked mRNA trafficking phenotypes to single-cell reporter gene expression dynamics.
Having established particularly striking mRNA trafficking signatures intrinsic to the RRE- and PRE-linked conditions, we next sought to determine the relationship between these behaviors and subsequent mRNA translation kinetics in the cytoplasm (Figure 3, F and G). To this end, we used single-cell tracking and computational cell segmentation (see Materials and Methods) to derive per cell changes to MS2-YFP subcellular distribution, with “nuclear export” defined as increases to the ratio of cytoplasmic to nuclear MS2-YFP MFI over time (shown in Figure 3F). These mRNA trafficking dynamics were compared with per cell increases to CFP MFI for identical conditions evaluated over a 20 h time course (Figure 3G). In these experiments, our analysis of per cell MS2-YFP distribution was initiated at the onset of CFP synthesis, a time point at which we already detected low to moderate levels of MS2-YFP in the cytoplasm (Figure 3F, t = 0). As expected, our analysis demonstrated much greater net transitions of MS2-YFP signal from the nucleus to the cytoplasm over time for the RRE plus Rev and WPRE conditions relative to either the ∆EE or RRE alone controls (Figure 3F). Accordingly, changes to single-cell CFP MFI were much more pronounced for the bursting conditions, exhibiting two- to fourfold net increases to CFP MFI relative to the ∆EE control at the 20 h time point (Figure 3G). However, we noted that the RRE plus Rev and PRE conditions were not identical. The RRE plus Rev condition tended to trigger earlier, more rapid increases to mRNA nuclear export, while the effects of the WPRE were more linear (Figure 3F).
Determining high-resolution gene expression kinetics using K-means clustering
Data-mining principles inspired us to explore additional novel ways to extract information from a multitude of dynamic, single-cell gene expression profiles. We tested the use of K-means clustering, a classification algorithm, to objectively derive single-cell CFP translation/turnover signatures reflecting the activities of the ∆EE, RRE alone, RRE plus Rev, and WPRE conditions (Figure 4). K-means clustering of CFP expression profiles assumes that each RNA regulatory element will cause a unique distribution of CFP single-cell rise profiles (relative changes to MFI over time), with clustering based on CFP signal-overtime shape similarity (Eisen et al., 1998; Tamayo et al., 1999; Tavazoie et al., 1999; Gasch and Eisen, 2002; Huang et al., 2011b; Bar-Joseph et al., 2012). An attractive feature of the approach is that it normalizes data sets for experiments despite the heterogeneity intrinsic to transfected cells, wherein all cells may not have taken up equivalent amounts of DNA plasmids.
FIGURE 4:

Single-cell CFP expression signatures derived by K-means clustering. (A) Six distinct clusters (A–F) presenting a total of 1638 CFP expression profiles from pooled cells expressing the four indicated transcripts. Each CFP expression trace is color-coded according to the transcript’s specific regulatory element (see key). (B) Average expression profile for each of the clusters shown in A. (C) Percentage of total cells for each condition partitioning into each of the six clusters as indicated. Error bars represent standard error for three independent experiments.
For our K-means clustering analysis, more than 300 single cells were tracked for 30 h with a 10× objective for each of the four conditions of interest (∆EE, RRE alone, RRE plus Rev, and WPRE) and normalized to the minimum to maximum range of CFP MFI over time [0,1], with rise curves combined into a single pooled data set (n = 1638 cells) before being portioned into six discrete clusters (Figure 4A, clusters A–F). A chi-square test for homogeneity of multiple populations confirmed cell populations for each element were not evenly distributed among clusters (p < 0.0005). Traces were color-coded for each individual export element (Figure 4A), with the average behavior for each of the six groups depicted in Figure 4B. ∆EE transcripts predominantly yielded CFP rise signatures in clusters C and D (>60% of cells), with relatively linear overall rates of increase to CFP levels over the course of the experiment (Figure 4C). Interestingly, the addition of the RRE, expressed in the absence of Rev, led to a profile in which increases to CFP MFI were more rapid at early time points relative to the ∆EE control (Figure 4C, >60% of cells in clusters B and C), consistent with the notion that the RRE has roles in regulating viral gene expression that extend beyond its interactions with Rev (Bolinger and Boris-Lawrie, 2009; Groom et al., 2009b). Indeed, the RRE no Rev condition made up the majority of cluster A behaviors (∼50% of this cluster), defined by a rapid early rise to CFP expression before a plateau (see Figure 4C, cluster A). By contrast, the addition of Rev moderately shifted the rise signature back toward clusters B and C (Figure 4C, compare purple and red bars).
The majority of CFP rise profiles for the WPRE-bearing transcripts (>60% of cells) largely partitioned into the more “linear” C and D clusters, similar to the ∆EE control (Figure 4C, yellow bars) and consistent with the linear effects we observed on mRNA nuclear export and CFP reporter gene expression in the aggregate analyses presented in Figure 3, F and G. However, we did note a unique subgroup (∼14% of cells) for the WPRE condition that almost exclusively populated clusters E and F, exhibiting very low CFP MFI (relative to peak expression) for several hours before explosive, very rapid increases at the latest time points (Figure 4A, clusters E and F, gold traces, and Figure 4C, yellow bars). Combined with the interesting RRE alone and RRE plus Rev signatures described above, the capacity of K-means clustering to expose unique, single-cell, WPRE-associated CFP rise behaviors demonstrates its utility as a tool to derive gene expression profiles at higher resolution than conventional aggregate analyses (i.e., Figure 3G).
DISCUSSION
In this study, we describe assays that, combined, constitute a relatively comprehensive imaging-based platform for studying mRNA trafficking and gene expression activities linked to specific viral and cellular cis-acting RNA elements. To validate the system, we compared the effects of six discrete RNA structures previously implicated in mRNA trafficking and translation using quantitative measures including: manual scoring of transitional phenotypes (Figure 2); computational cell segmentation coupled to relative bulk MFI measurements in the cytoplasm and nucleus (Figure 3); and a data-mining strategy, K-means clustering, that provides a novel, high-resolution approach for elucidating otherwise invisible single-cell mRNA translation/protein turnover signatures. With the exception of the scoring of transitional phenotypes (Figure 2), the analysis is fully automated in the context of our image analysis pipeline. A current goal for achieving full automation is to implement machine-learning algorithms into the platform, thereby obtaining the capacity to objectively identify and classify even very transient phenotypes for hundreds of cells in a single experiment.
Per cell variability is intrinsic to gene expression kinetics or infection dynamics in the context of an otherwise highly similar cell population (Elowitz et al., 2002; Snijder et al., 2009; Timm and Yin, 2012; Buettner et al., 2015; Sen et al., 2015; Ciuffi et al., 2016). Such heterogeneity can be amplified in transfection-based single-cell assays, reflecting differences not only to cell biology but also to per cell levels of plasmid uptake. A core strength of our system is that it assumes heterogeneity and is designed to capture, average, and categorize large numbers of single-cell behaviors in order to compare them directly among differing RNA conditions. K-means clustering is a particularly useful exploratory tool for studying such variability and thus highlights behaviors of interest for more in-depth study as illustrated in Figure 4.
The system should be readily adaptable to study many types of posttranscriptional signaling, for example, by swapping out 5′ untranslated region (UTR) regulatory elements, adding introns, or modulating the expression of RNA regulatory factors (as illustrated by studying the effects of Rev on the RRE). Moreover, although currently not configured to directly measure per cell RNA translation rates or protein turnover, the system might be modified to do so using either photoconvertible reporters or by tracking reporter persistence in response to inhibitors of transcription and/or translation, assuming equivalent rates of protein folding. Indeed, a current goal is to employ destabilized versions of CFP in order to measure reporter gene dynamics with greater precision, for example, to test the hypothesis that the PRE-regulated pulsiform RNA export behavior correlates with punctuated, periodic bursts of protein synthesis (Li et al., 1998; Corish and Tyler-Smith, 1999).
We observed a remarkable diversity of mRNA trafficking behaviors for even a relatively small sampling of RNA regulatory elements (Figure 2). Directed mRNA trafficking and compartmentalization play a crucial role in regulated gene expression (Giorgi and Moore, 2007; Martin and Ephrussi, 2009; Eliscovich et al., 2013; Buxbaum et al., 2015). For example, during embryogenesis, more than 70% of mRNAs are compartmentalized in cells and are essential to providing spatial cues for tissue development (Lécuyer et al., 2007). Directed mRNA trafficking also plays prominent roles in somatic cell processes such as regulation of the actin cytoskeleton in fibroblasts (Kislauskis et al., 1994; Czaplinski and Singer, 2006) and long-range transport of RNA–protein complexes in the axons and dendrites of neurons (Martin and Zukin, 2006; Holt and Bullock, 2009; Donnelly et al., 2010; Czaplinski, 2014). Fluorescently tagged RNAs have been used previously to measure the dynamics of transcription and/or posttranscriptional regulatory activities, including mRNA subcellular trafficking and translation, but only over relatively short time windows (minutes to hours) (Bertrand et al., 1998; Femino et al., 1998; Larson et al., 2011, 2013; Trcek et al., 2011; Coulon et al., 2013; Buxbaum et al., 2015; Halstead et al., 2015; Wu et al., 2016; Yan et al., 2016). Although our long-term strategy (hours to days) lacks the resolution to pinpoint nanoscale stochastic activities such as individual transcription, nuclear export, or translation events, the advantage of our approach is its ability to sequentially capture broad-scale mRNA trafficking and compartmentalization phenotypes that are transient and/or recurring (e.g., focus formation or burst nuclear export; Figure 2) and thus only apparent when monitoring cells over the entire duration of the cell cycle. Moreover, as configured, our strategy allows us to correlate mRNA trafficking dynamics to protein synthesis effects for hundreds of cells per condition.
A more targeted goal was to study links between viral RNA trafficking behaviors and translation kinetics, with the hope of better understanding the complex gene regulatory pathways that underpin the late, productive stages of viral infection. All viruses must compartmentalize mRNAs and genomes in specific regions of the cell in order to 1) ensure efficient virion assembly, 2) evade the innate cellular antiviral immune defense, and 3) promote the transfer of infection from cell to cell (Beckham and Parker, 2008; Miller and Krijnse-Locker, 2008; den Boon and Ahlquist, 2010; Mothes et al., 2010). Here we show that viral RNA transport elements not only ensure RNA nuclear egress but also endow RNAs with diverse and extraordinary cytoplasmic trafficking behaviors. Both the RRE plus Rev and WPRE conditions triggered burst mRNA nuclear export and enhanced the rates of CFP production more than threefold on a per cell basis relative to control transcripts (Figure 3). We also noted interesting differences for these elements in terms of the frequency of burst export and CFP expression profiles on a per cell level. We speculate that the RRE plus Rev programs a single burst activity needed for a rapid early rise to gene expression followed by stabilization in the cytoplasm (Figure 3F). By contrast, the WPRE’s pulsiform activity allows transcripts to build up in the cytoplasm incrementally (Figure 3F), perhaps explaining why it regulated CFP rise kinetics that were more linear (Figure 3G). We also found it compelling that our clustering analysis suggested that the RRE exhibits an activity independent of Rev, yielding more rapid relative rates of CFP expression at early time points compared with the cfp-∆EE control (Figure 4C, compare blue and purple bars).
Of course, scenarios for viral RNAs are inherently more complicated during infection, reflecting roles for complex mRNA splicing regimes and contributions from additional cis-acting elements and/or nucleic acid modifications (Cochrane et al., 2006; Swanson and Malim, 2006; Sommer and Heise, 2008; Bolinger and Boris-Lawrie, 2009). Moreover, integration into the host cell chromatin is obligatory to the retroviral life cycle, thus subjecting viral RNAs to an additional level of tight gene regulatory control (e.g., transcriptional regulation by HIV-1 Tat and/or cellular transcription factors) (Varmus, 1988; Swanstrom and Wills, 1997; Wu, 2004). That said, the “burst” phenotype observed for our CFP-RRE transcripts expressed with Rev was identical to what we have previously described for full-length, intron-retaining HIV-1 RNAs (Pocock et al., 2016). Thus we hypothesize that the differential activities described herein, intrinsic to each RNA regulatory element, reflect core features of each virus’s (or NXF1’s) posttranscriptional regulatory program. Future work will dissect select minimalist scenarios (e.g., RRE alone or “burst” export conditions) using gene silencing or pharmacological inhibitors to more fully elucidate the viral and cellular machineries involved. Moreover, the observations fuel our more expansive efforts to generate a full, imaging-based model of the posttranscriptional regulatory stages of HIV-1 and HBV (Aligeti et al., 2014; Pocock et al., 2016; Unchwaniwala et al., 2016). Such efforts may expose new virus–host interactions relevant to the development of novel antiviral strategies.
In sum, the described assays allow access to spatial and temporal dynamics of the integrated processes of transcription, mRNA trafficking, and translation in single cells, providing insights that would be difficult if not impossible to access using traditional biochemical approaches. Our strategy should also hold utility as a screening platform for identifying additional unique viral (or cellular) cis-acting RNA regulatory elements or trans-acting factors that modulate viral RNA trafficking behaviors and/or cytoplasmic utilization.
MATERIALS AND METHODS
Cell lines and plasmids
Human HeLa cervical carcinoma cells were obtained from the American Type Culture Collection (ATCC) and cultured in DMEM supplemented with 10% fetal bovine serum (FBS), 1% l-glutamine, and 1% penicillin/streptomycin. HeLa-MS2-YFP cells were generated by retroviral transduction as previously described (Sherer et al., 2003; Pocock et al., 2016) and further modified to stably express nuclear-localized mCherry (mCherry-NLS) by retroviral transduction before puromycin selection and derivation of a high-performance single-cell clone using limiting dilution (HeLa-MS2-YFP/mChe-NLS cells). The mCherry-NLS vector plasmid was generated by PCR amplification of the mCherry reading frame and overlapping PCR to generate a fusion to the NLS derived from the M9 domain of the cellular protein hnRNPA1 (Siomi and Dreyfuss, 1995). CFP-MSL plasmids were generated by inserting cerulean cfp cDNAs (Rizzo et al., 2004) into pcDNA3.1 using NheI and BamHI cut sites, adding the ∼1.3 kb 24x MS2 stem loops (24xMSL) cassette (Bertrand et al., 1998) using BamHI and NotI sites, and then inserting viral or cellular RNA regulatory element sequences downstream using either StuI-XhoI (RRE from HIV-1IIIB, [accession no. KJ925006.1] nts 7708–8058, and M-PMV CTE genome [accession no. AF033815.1] nts 7386–7505) or MfeI-EcoRI (NXF1 CTE transcript variant 2 [accession no. NM_001081491.1] nts 1928–2023, MLV Pol genome [accession no. AF033811.1] nts 1970–5573, HBV HPRE genome [accession no. JQ040127.1] nts 962–1664, WHV WPRE genome [accession no. M18752.1] nts 1096–1684) cut fragments generated by PCR and restriction digest. All plasmid coding regions and regulatory elements were verified using Sanger sequencing (Functional Biosciences). Sequences for all elements are provided in the Supplementary Data.
Live-cell imaging
For all experiments, MS2-YFP HeLa cells were plated for ∼40% confluency in eight-well no. 1.5 glass-bottom slides (Ibidi) before transfection and imaging. Cells were transfected with 200 ng of plasmids encoding each CFP expression vector using polyethylenimine (PEI; #23966; Polysciences). PEI (1 mg/ml stock concentration) was mixed with DNA in 25 µl Opti-MEM (Thermo Fisher) at a ratio of 3:1 PEI to DNA (e.g., 600 ng of PEI to 200 ng DNA). Transfection mixes were incubated for 15 min at room temperature and then added directly to cells. PEI typically yielded 30–60% transfection efficiency in our HeLa-MS2-YFP cells.
Imaging was carried out using a Nikon Ti-Eclipse inverted wide-field epifluorescent deconvolution microscope (Nikon Corporation) equipped with an Orca-Flash 4.0 C11440 camera (Hamamatsu) and Nikon NIS Elements software (version 4.00.03). Cells were imaged in two dimensions starting at 3 h posttransfection and for up to 30 h with cells maintained at 37°C, ∼50% humidity, and 5% CO2 in a LiveCell stage top incubator (Pathology Devices). Single images were acquired every 20–90 min, depending on the experiment, using 418-442/458-482 (CFP), 490-520/520-550 (YFP), and 565-590/590-650 (mCherry) excitation/emission Chroma band-pass filters (wavelengths in nanometers). Objectives used in the study: 10× (N.A. 0.45) Plan-Apo λ, 20× (N.A. 0.75) Plan-Apo λ, and 40× (N.A. 1.3) Plan-Fluor. Fields of view were 1269 × 1269 µm (10×), 666 × 666 µm (20×), and 333 × 333 µm (40×), respectively.
Image analysis
The amount of image data generated necessitated automated image analysis methods for the extraction of CFP, YFP, and mCherry intensity and derivation of subcellular distribution. Time-lapse movies were postprocessed with cells tracked over time using FIJI/ImageJ2 plug-ins (Schindelin et al., 2012, 2015; Aligeti et al., 2014) integrated into the Konstanz Information Miner (KNIME) image analysis platform (Berthold et al., 2008). The KNIME platform includes image postprocessing, subcellular segmentation, cell tracking (TrackMate), and extraction of cellular morphological feature descriptors for final single-cell analysis. Within the KNIME workflow, nuclear portions of each cell were defined by mCherry-NLS fluorescence to identify and track each cell. For MS2-YFP tracking, single-cell fluorescence intensity measurements were obtained for nuclear versus cytoplasmic compartments. Transitional phenotypes (Figure 2) were scored for >30 cells for each condition. Cytoplasmic measurements were constrained to a region within 10 um of the nuclear boundary. Nuclear and cytoplasmic MFIs were calculated as the upper 75th quartile of the median fluorescence for a minimum of 30 cells in experiments done in triplicate (Figure 3). For CFP measurements (Figures 3 and 4), single cells were tracked using the mCherry-NLS signal, and the CFP MFI overlapping the mCherry-NLS signal was extracted on a per cell basis in order to roughly control for area and ensure minimal cell–cell signal overlap. t = 0 represented the first detection of CFP expression over background. Daughter cells following cell division or dying cells were excluded from CFP rise-time analyses. Three independent experiments of CFP rise time were averaged at the t = 0, 5,10,15, and 20 h time points for the ∆EE, RRE, RRE plus Rev, and WPRE conditions (n > 100 per experiment). A one-way analysis of variance (ANOVA) was conducted to compare CFP export element conditions on the fluorescence intensity at different time points. Levene’s F test was used to determine the homogeneity of variance before ANOVA. A Welch ANOVA determined that the effect of export elements on CFP fluorescence intensity resulted in a statistically significant difference between groups at the 10, 15, and 20 h time points (F (3, 4.2) = 6.9, p = 0.04; F (3, 4.2) = 8.6, p = 0.02; F (3, 4.2) = 10.8, p = 0.01, respectively). A Games-Howell post hoc procedure showed that the RRE plus Rev condition was significantly different from the ∆EE condition at the t = 10, 15, and 20 h time points (p < 0.05), and RRE and RRE plus Rev conditions were significantly different at the 15 and 20 h time points (p ≤ 0.05). To control for some of the heterogeneity intrinsic to transient transfection, we excluded cells that did not achieve a threshold MFI of 200 fluorescence intensity arbitrary units over the 20 h time course from all analyses based on observations that weak CFP fluorescence correlated with weak MS2-YFP trafficking activities.
For a more detailed analysis of how cis-acting export elements influence CFP rise kinetics in single cells, K-means clustering was used to objectively identify unique gene expression signatures (Figure 4). Each single-cell CFP rise curve was populated with 61 time points (images acquired every 20 min), thus covering a total of 20 h. Minimum–maximum normalization [0,1] over the time course was used to derive net changes to CFP MFI over time independent of magnitude before clustering. The best arrangement of K-cluster centroids was selected out of 30 replicate clusters at different starting values. A cosine distance measure was used to assign data points to clusters. The MATLAB (MathWorks) “silhouette” function was used to examine cluster separation and to determine an optimal number of clusters for CFP rise signatures. The silhouette value [−1,−1] is a measure of how similar each CFP signature is to other signatures in its respective cluster compared with CFP signatures in the five other clusters. Silhouette values greater than 0.6 were considered the minimal acceptable score to determine optimal cluster separation. To compare the frequency distributions of the CFP conditions in each of the clusters, we used a chi-square test for homogeneity of multiple populations. The null hypothesis is that the frequency of the CFP conditions is the same across all six cluster groups.
Supplementary Material
Acknowledgments
We are grateful to Anthony Gitter and Gabriel Einsdorf for technical advice and thank Dan Loeb and Janet Mertz for providing valuable reagents. Jolynne Roorda provided artwork. This work was supported by National Institutes of Health/National Institute of Allergy and Infectious Diseases grant RO1AI110221A1 and a Shaw Scientist Award (Greater Milwaukee Foundation) to N.M.S. G.M.P. received training support from NIH National Research Service Award T32 CA009135 and the Morgridge Institute for Research. P.A. is an investigator of the Howard Hughes Medical Institute and the Morgridge Institute for Research.
Abbreviations used:
- ANOVA
analysis of variance
- CFP
cyan fluorescent protein
- CTE
constitutive transport element
- FBS
fetal bovine serum
- HBV
hepatitis B virus
- HPRE
hepatitis B virus PRE
- KNIME
Konstanz Information Miner
- MFI
median fluorescence intensity
- MLV
murine leukemia virus
- M-PMV
Mason-Pfizer monkey virus
- MTOC
microtubule-organizing center
- NES
nuclear export signal
- NLS
nuclear localization signal
- PEI
polyethylenimine
- PRE
posttranscriptional regulatory element
- RRE
Rev response element
- WPRE
woodchuck hepatitis virus PRE
- YFP
yellow fluorescent protein
Footnotes
This article was published online ahead of print in MBoC in Press (http://www.molbiolcell.org/cgi/doi/10.1091/mbc.E16-08-0612) on November 30, 2016.
REFERENCES
- Aligeti M, Behrens RT, Pocock GM, Schindelin J, Dietz C, Eliceiri KW, Swanson CM, Malim MH, Ahlquist P, Sherer NM. Cooperativity among Rev-associated nuclear export signals regulates HIV-1 gene expression and is a determinant of virus species tropism. J Virol. 2014;88:14207–14221. doi: 10.1128/JVI.01897-14. [DOI] [PMC free article] [PubMed] [Google Scholar]
- Bar-Joseph Z, Gitter A, Simon I. Studying and modelling dynamic biological processes using time-series gene expression data. Nat Rev Genet. 2012;13:552–564. doi: 10.1038/nrg3244. [DOI] [PubMed] [Google Scholar]
- Bartels H, Luban J. Gammaretroviral pol sequences act in cis to direct polysome loading and NXF1/NXT-dependent protein production by gag-encoded RNA. Retrovirology. 2014;11:73. doi: 10.1186/s12977-014-0073-0. [DOI] [PMC free article] [PubMed] [Google Scholar]
- Beckham CJ, Parker R. P bodies, stress granules, and viral life cycles. Cell Host Microbe. 2008;3:206–212. doi: 10.1016/j.chom.2008.03.004. [DOI] [PMC free article] [PubMed] [Google Scholar]
- Berthold MR, Cebron N, Dill F, Gabriel TR, Kötter T, Meinl T, Ohl P, Sieb C, Thiel K, Wiswedel B. KNIME: the Konstanz Information Miner. In: Preisach C, Burkhardt PDH, Schmidt-Thieme PDL, Decker PDR, editors. Data Analysis, Machine Learning and Applications. Berlin: Springer; 2008. pp. 319–326. [Google Scholar]
- Bertrand E, Chartrand P, Schaefer M, Shenoy SM, Singer RH, Long RM. Localization of ASH1 mRNA particles in living yeast. Mol Cell. 1998;2:437–445. doi: 10.1016/s1097-2765(00)80143-4. [DOI] [PubMed] [Google Scholar]
- Bolinger C, Boris-Lawrie K. Mechanisms employed by retroviruses to exploit host factors for translational control of a complicated proteome. Retrovirology. 2009;6:8. doi: 10.1186/1742-4690-6-8. [DOI] [PMC free article] [PubMed] [Google Scholar]
- Brandt S, Blissenbach M, Grewe B, Konietzny R, Grunwald T, Uberla K. Rev proteins of human and simian immunodeficiency virus enhance RNA encapsidation. PLoS Pathog. 2007;3:e54. doi: 10.1371/journal.ppat.0030054. [DOI] [PMC free article] [PubMed] [Google Scholar]
- Bray M, Prasad S, Dubay JW, Hunter E, Jeang KT, Rekosh D, Hammarskjöld ML. A small element from the Mason-Pfizer monkey virus genome makes human immunodeficiency virus type 1 expression and replication Rev-independent. Proc Natl Acad Sci USA. 1994;91:1256–1260. doi: 10.1073/pnas.91.4.1256. [DOI] [PMC free article] [PubMed] [Google Scholar]
- Buettner F, Natarajan KN, Casale FP, Proserpio V, Scialdone A, Theis FJ, Teichmann SA, Marioni JC, Stegle O. Computational analysis of cell-to-cell heterogeneity in single-cell RNA-sequencing data reveals hidden subpopulations of cells. Nat Biotechnol. 2015;33:155–160. doi: 10.1038/nbt.3102. [DOI] [PubMed] [Google Scholar]
- Buxbaum AR, Haimovich G, Singer RH. In the right place at the right time: visualizing and understanding mRNA localization. Nat Rev Mol Cell Biol. 2015;16:95–109. doi: 10.1038/nrm3918. [DOI] [PMC free article] [PubMed] [Google Scholar]
- Caly L, Wagstaff KM, Jans DA. Nuclear trafficking of proteins from RNA viruses: potential target for antivirals. Antiviral Res. 2012;95:202–206. doi: 10.1016/j.antiviral.2012.06.008. [DOI] [PubMed] [Google Scholar]
- Chen A, Panjaworayan T-Thienprasert N, Brown CM. Prospects for inhibiting the posttranscriptional regulation of gene expression in hepatitis B virus. World J Gastroenterol. 2014;20:7993–8004. doi: 10.3748/wjg.v20.i25.7993. [DOI] [PMC free article] [PubMed] [Google Scholar]
- Ciuffi A, Rato S, Telenti A. Single-cell genomics for virology. Viruses. 2016;9:E123. doi: 10.3390/v8050123. [DOI] [PMC free article] [PubMed] [Google Scholar]
- Cochrane AW, McNally MT, Mouland AJ. The retrovirus RNA trafficking granule: from birth to maturity. Retrovirology. 2006;3:18. doi: 10.1186/1742-4690-3-18. [DOI] [PMC free article] [PubMed] [Google Scholar]
- Cockrell AS, van Praag H, Santistevan N, Ma H, Kafri T. The HIV-1 Rev/RRE system is required for HIV-1 5′ UTR cis elements to augment encapsidation of heterologous RNA into HIV-1 viral particles. Retrovirology. 2011;8:51. doi: 10.1186/1742-4690-8-51. [DOI] [PMC free article] [PubMed] [Google Scholar]
- Corish P, Tyler-Smith C. Attenuation of green fluorescent protein half-life in mammalian cells. Protein Eng. 1999;12:1035–1040. doi: 10.1093/protein/12.12.1035. [DOI] [PubMed] [Google Scholar]
- Coulon A, Chow CC, Singer RH, Larson DR. Eukaryotic transcriptional dynamics: from single molecules to cell populations. Nat Rev Genet. 2013;14:572–584. doi: 10.1038/nrg3484. [DOI] [PMC free article] [PubMed] [Google Scholar]
- Cullen BR. Nuclear mRNA export: insights from virology. Trends Biochem Sci. 2003;28:419–424. doi: 10.1016/S0968-0004(03)00142-7. [DOI] [PubMed] [Google Scholar]
- Czaplinski K. Understanding mRNA trafficking: are we there yet? Semin Cell Dev Biol. 2014;32:63–70. doi: 10.1016/j.semcdb.2014.04.025. [DOI] [PubMed] [Google Scholar]
- Czaplinski K, Singer RH. Pathways for mRNA localization in the cytoplasm. Trends Biochem Sci. 2006;31:687–693. doi: 10.1016/j.tibs.2006.10.007. [DOI] [PubMed] [Google Scholar]
- Daly TJ, Cook KS, Gray GS, Maione TE, Rusche JR. Specific binding of HIV-1 recombinant Rev protein to the Rev-responsive element in vitro. Nature. 1989;342:816–819. doi: 10.1038/342816a0. [DOI] [PubMed] [Google Scholar]
- Delaleau M, Borden KLB. Multiple export mechanisms for mRNAs. Cells. 2015;4:452–473. doi: 10.3390/cells4030452. [DOI] [PMC free article] [PubMed] [Google Scholar]
- den Boon JA, Ahlquist P. Organelle-like membrane compartmentalization of positive-strand RNA virus replication factories. Annu Rev Microbiol. 2010;64:241–256. doi: 10.1146/annurev.micro.112408.134012. [DOI] [PubMed] [Google Scholar]
- Donello JE, Beeche AA, Smith GJ, Lucero GR, Hope TJ. The hepatitis B virus posttranscriptional regulatory element is composed of two subelements. J Virol. 1996;70:4345–4351. doi: 10.1128/jvi.70.7.4345-4351.1996. [DOI] [PMC free article] [PubMed] [Google Scholar]
- Donello JE, Loeb JE, Hope TJ. Woodchuck hepatitis virus contains a tripartite posttranscriptional regulatory element. J Virol. 1998;72:5085–5092. doi: 10.1128/jvi.72.6.5085-5092.1998. [DOI] [PMC free article] [PubMed] [Google Scholar]
- Donnelly CJ, Fainzilber M, Twiss JL. Subcellular communication through RNA transport and localized protein synthesis. Traffic. 2010;11:1498–1505. doi: 10.1111/j.1600-0854.2010.01118.x. [DOI] [PMC free article] [PubMed] [Google Scholar]
- Ehlers I, Horke S, Reumann K, Rang A, Grosse F, Will H, Heise T. Functional characterization of the interaction between human La and hepatitis B virus RNA. J Biol Chem. 2004;279:43437–43447. doi: 10.1074/jbc.M402227200. [DOI] [PubMed] [Google Scholar]
- Eisen MB, Spellman PT, Brown PO, Botstein D. Cluster analysis and display of genome-wide expression patterns. Proc Natl Acad Sci USA. 1998;95:14863–14868. doi: 10.1073/pnas.95.25.14863. [DOI] [PMC free article] [PubMed] [Google Scholar]
- Eliscovich C, Buxbaum AR, Katz ZB, Singer RH. mRNA on the move: the road to its biological destiny. J Biol Chem. 2013;288:20361–20368. doi: 10.1074/jbc.R113.452094. [DOI] [PMC free article] [PubMed] [Google Scholar]
- Elowitz MB, Levine AJ, Siggia ED, Swain PS. Stochastic gene expression in a single cell. Science. 2002;297:1183–1186. doi: 10.1126/science.1070919. [DOI] [PubMed] [Google Scholar]
- Ernst RK, Bray M, Rekosh D, Hammarskjold ML. Secondary structure and mutational analysis of the Mason-Pfizer monkey virus RNA constitutive transport element. RNA. 1997;3:210–222. [PMC free article] [PubMed] [Google Scholar]
- Femino AM, Fay FS, Fogarty K, Singer RH. Visualization of single RNA transcripts in situ. Science. 1998;280:585–590. doi: 10.1126/science.280.5363.585. [DOI] [PubMed] [Google Scholar]
- Fernandes J, Jayaraman B, Frankel A. The HIV-1 Rev response element. RNA Biol. 2012;9:6–11. doi: 10.4161/rna.9.1.18178. [DOI] [PMC free article] [PubMed] [Google Scholar]
- Fornerod M, Ohno M, Yoshida M, Mattaj IW. CRM1 is an export receptor for leucine-rich nuclear export signals. Cell. 1997;90:1051–1060. doi: 10.1016/s0092-8674(00)80371-2. [DOI] [PubMed] [Google Scholar]
- Fukuda M, Asano S, Nakamura T, Adachi M, Yoshida M, Yanagida M, Nishida E. CRM1 is responsible for intracellular transport mediated by the nuclear export signal. Nature. 1997;390:308–311. doi: 10.1038/36894. [DOI] [PubMed] [Google Scholar]
- Gasch AP, Eisen MB. Exploring the conditional coregulation of yeast gene expression through fuzzy K-means clustering. Genome Biol. 2002;3:RESEARCH0059. doi: 10.1186/gb-2002-3-11-research0059. [DOI] [PMC free article] [PubMed] [Google Scholar]
- Giorgi C, Moore MJ. The nuclear nurture and cytoplasmic nature of localized mRNPs. Semin. Cell Dev Biol. 2007;18:186–193. doi: 10.1016/j.semcdb.2007.01.002. [DOI] [PubMed] [Google Scholar]
- Grice SFJL. Targeting the HIV RNA genome: high-hanging fruit only needs a longer ladder. In: Torbett BE, Goodsell DS, Richman DD, editors. The Future of HIV-1 Therapeutics. New York: Springer International Publishing; 2015. pp. 147–169. [Google Scholar]
- Groom HCT, Anderson EC, Dangerfield JA, Lever AML. Rev regulates translation of human immunodeficiency virus type 1 RNAs. J Gen Virol. 2009a;90:1141–1147. doi: 10.1099/vir.0.007963-0. [DOI] [PubMed] [Google Scholar]
- Groom HCT, Anderson EC, Lever AML. Rev: beyond nuclear export. J Gen Virol. 2009b;90:1303–1318. doi: 10.1099/vir.0.011460-0. [DOI] [PubMed] [Google Scholar]
- Grüter P, Tabernero C, von Kobbe C, Schmitt C, Saavedra C, Bachi A, Wilm M, Felber BK, Izaurralde E. TAP, the human homolog of Mex67p, mediates CTE-dependent RNA export from the nucleus. Mol Cell. 1998;1:649–659. doi: 10.1016/s1097-2765(00)80065-9. [DOI] [PubMed] [Google Scholar]
- Halstead JM, Lionnet T, Wilbertz JH, Wippich F, Ephrussi A, Singer RH, Chao JA. Translation. An RNA biosensor for imaging the first round of translation from single cells to living animals. Science. 2015;347:1367–1671. doi: 10.1126/science.aaa3380. [DOI] [PMC free article] [PubMed] [Google Scholar]
- Hammarskjöld ML. Constitutive transport element-mediated nuclear export. Curr Top Microbiol Immunol. 2001;259:77–93. doi: 10.1007/978-3-642-56597-7_4. [DOI] [PubMed] [Google Scholar]
- Harris ME, Hope TJ. RNA export: insights from viral models. Essays Biochem. 2000;36:115–127. doi: 10.1042/bse0360115. [DOI] [PubMed] [Google Scholar]
- Heaphy S, Dingwall C, Ernberg I, Gait MJ, Green SM, Karn J, Lowe AD, Singh M, Skinner MA. HIV-1 regulator of virion expression (Rev) protein binds to an RNA stem-loop structure located within the Rev response element region. Cell. 1990;60:685–693. doi: 10.1016/0092-8674(90)90671-z. [DOI] [PubMed] [Google Scholar]
- Heise T, Sommer G, Reumann K, Meyer I, Will H, Schaal H. The hepatitis B virus PRE contains a splicing regulatory element. Nucleic Acids Res. 2006;34:353–363. doi: 10.1093/nar/gkj440. [DOI] [PMC free article] [PubMed] [Google Scholar]
- Hofacre A, Nitta T, Fan H. Jaagsiekte sheep retrovirus encodes a regulatory factor, Rej, required for synthesis of Gag protein. J Virol. 2009;83:12483–12498. doi: 10.1128/JVI.01747-08. [DOI] [PMC free article] [PubMed] [Google Scholar]
- Holt CE, Bullock SL. Subcellular mRNA localization in animal cells and why it matters. Science. 2009;326:1212–1216. doi: 10.1126/science.1176488. [DOI] [PMC free article] [PubMed] [Google Scholar]
- Hope T. Improving the post-transcriptional aspects of lentiviral vectors. In: Trono PDD, editor. Lentiviral Vectors. Berlin: Springer; 2002. pp. 179–189. [DOI] [PubMed] [Google Scholar]
- Hope TJ. The ins and outs of HIV Rev. Arch Biochem Biophys. 1999;365:186–191. doi: 10.1006/abbi.1999.1207. [DOI] [PubMed] [Google Scholar]
- Horke S, Reumann K, Rang A, Heise T. Molecular characterization of the human La protein hepatitis B virus RNA.B interaction in vitro. J Biol Chem. 2002;277:34949–34958. doi: 10.1074/jbc.M201911200. [DOI] [PubMed] [Google Scholar]
- Huang C, Xie M-H, Liu W, Yang B, Yang F, Huang J, Huang J, Wu Q, Fu X-D, Zhang Y. A structured RNA in hepatitis B virus posttranscriptional regulatory element represses alternative splicing in a sequence-independent and position-dependent manner. FEBS J. 2011a;278:1533–1546. doi: 10.1111/j.1742-4658.2011.08077.x. [DOI] [PMC free article] [PubMed] [Google Scholar]
- Huang J, Liang TJ. A novel hepatitis B virus (HBV) genetic element with Rev response element-like properties that is essential for expression of HBV gene products. Mol Cell Biol. 1993;13:7476–7486. doi: 10.1128/mcb.13.12.7476. [DOI] [PMC free article] [PubMed] [Google Scholar]
- Huang Y, Zaas AK, Rao A, Dobigeon N, Woolf PJ, Veldman T, Øien NC, McClain MT, Varkey JB, Nicholson B, et al. Temporal dynamics of host molecular responses differentiate symptomatic and asymptomatic influenza a infection. PLoS Genet. 2011b;7:e1002234. doi: 10.1371/journal.pgen.1002234. [DOI] [PMC free article] [PubMed] [Google Scholar]
- Huang ZM, Yen TS. Hepatitis B virus RNA element that facilitates accumulation of surface gene transcripts in the cytoplasm. J Virol. 1994;68:3193–3199. doi: 10.1128/jvi.68.5.3193-3199.1994. [DOI] [PMC free article] [PubMed] [Google Scholar]
- Huang ZM, Yen TS. Role of the hepatitis B virus posttranscriptional regulatory element in export of intronless transcripts. Mol Cell Biol. 1995;15:3864–3869. doi: 10.1128/mcb.15.7.3864. [DOI] [PMC free article] [PubMed] [Google Scholar]
- Indik S, Günzburg WH, Salmons B, Rouault F. A novel, mouse mammary tumor virus encoded protein with Rev-like properties. Virology. 2005;337:1–6. doi: 10.1016/j.virol.2005.03.040. [DOI] [PubMed] [Google Scholar]
- Jin J, Sturgeon T, Weisz OA, Mothes W, Montelaro RC. HIV-1 matrix dependent membrane targeting is regulated by Gag mRNA trafficking. PloS One. 2009;4:e6551. doi: 10.1371/journal.pone.0006551. [DOI] [PMC free article] [PubMed] [Google Scholar]
- Kislauskis EH, Zhu X, Singer RH. Sequences responsible for intracellular localization of beta-actin mRNA also affect cell phenotype. J Cell Biol. 1994;127:441–451. doi: 10.1083/jcb.127.2.441. [DOI] [PMC free article] [PubMed] [Google Scholar]
- Köhler A, Hurt E. Exporting RNA from the nucleus to the cytoplasm. Nat Rev Mol Cell Biol. 2007;8:761–773. doi: 10.1038/nrm2255. [DOI] [PubMed] [Google Scholar]
- Larson DR, Fritzsch C, Sun L, Meng X, Lawrence DS, Singer RH. Direct observation of frequency modulated transcription in single cells using light activation. eLife. 2013;2:e00750. doi: 10.7554/eLife.00750. [DOI] [PMC free article] [PubMed] [Google Scholar]
- Larson DR, Zenklusen D, Wu B, Chao JA, Singer RH. Real-time observation of transcription initiation and elongation on an endogenous yeast gene. Science. 2011;332:475–478. doi: 10.1126/science.1202142. [DOI] [PMC free article] [PubMed] [Google Scholar]
- Lécuyer E, Yoshida H, Parthasarathy N, Alm C, Babak T, Cerovina T, Hughes TR, Tomancak P, Krause HM. Global analysis of mRNA localization reveals a prominent role in organizing cellular architecture and function. Cell. 2007;131:174–187. doi: 10.1016/j.cell.2007.08.003. [DOI] [PubMed] [Google Scholar]
- Le Hir H, Nott A, Moore MJ. How introns influence and enhance eukaryotic gene expression. Trends Biochem Sci. 2003;28:215–220. doi: 10.1016/S0968-0004(03)00052-5. [DOI] [PubMed] [Google Scholar]
- Li H-C, Huang E-Y, Su P-Y, Wu S-Y, Yang C-C, Lin Y-S, Chang W-C, Shih C. Nuclear export and import of human hepatitis B virus capsid protein and particles. PLoS Pathog. 2010;6:e1001162. doi: 10.1371/journal.ppat.1001162. [DOI] [PMC free article] [PubMed] [Google Scholar]
- Li X, Zhao X, Fang Y, Jiang X, Duong T, Fan C, Huang C-C, Kain SR. Generation of destabilized green fluorescent protein as a transcription reporter. J Biol Chem. 1998;273:34970–34975. doi: 10.1074/jbc.273.52.34970. [DOI] [PubMed] [Google Scholar]
- Li Y, Bor Y-C, Misawa Y, Xue Y, Rekosh D, Hammarskjöld M-L. An intron with a constitutive transport element is retained in a Tap mRNA. Nature. 2006;443:234–237. doi: 10.1038/nature05107. [DOI] [PubMed] [Google Scholar]
- Li Y, Huang T, Zhang X, Wan T, Hu J, Huang A, Tang H. Role of glyceraldehyde-3-phosphate dehydrogenase binding to hepatitis B virus posttranscriptional regulatory element in regulating expression of HBV surface antigen. Arch Virol. 2009;154:519–524. doi: 10.1007/s00705-009-0326-8. [DOI] [PubMed] [Google Scholar]
- Lindtner S, Felber BK, Kjems J. An element in the 3′ untranslated region of human LINE-1 retrotransposon mRNA binds NXF1(TAP) and can function as a nuclear export element. RNA. 2002;8:345–356. doi: 10.1017/s1355838202027759. [DOI] [PMC free article] [PubMed] [Google Scholar]
- Loeb JE, Cordier WS, Harris ME, Weitzman MD, Hope TJ. Enhanced expression of transgenes from adeno-associated virus vectors with the woodchuck hepatitis virus posttranscriptional regulatory element: implications for gene therapy. Hum Gene Ther. 1999;10:2295–2305. doi: 10.1089/10430349950016942. [DOI] [PubMed] [Google Scholar]
- Malim MH, Cullen BR. HIV-1 structural gene expression requires the binding of multiple Rev monomers to the viral RRE: implications for HIV-1 latency. Cell. 1991;65:241–248. doi: 10.1016/0092-8674(91)90158-u. [DOI] [PubMed] [Google Scholar]
- Malim MH, Tiley LS, McCarn DF, Rusche JR, Hauber J, Cullen BR. HIV-1 structural gene expression requires binding of the Rev trans-activator to its RNA target sequence. Cell. 1990;60:675–683. doi: 10.1016/0092-8674(90)90670-a. [DOI] [PubMed] [Google Scholar]
- Martin KC, Ephrussi A. mRNA localization: gene expression in the spatial dimension. Cell. 2009;136:719. doi: 10.1016/j.cell.2009.01.044. [DOI] [PMC free article] [PubMed] [Google Scholar]
- Martin KC, Zukin RS. RNA trafficking and local protein synthesis in dendrites: an overview. J Neurosci. 2006;26:7131–7134. doi: 10.1523/JNEUROSCI.1801-06.2006. [DOI] [PMC free article] [PubMed] [Google Scholar]
- McKnight KL, Heinz BA. RNA as a target for developing antivirals. Antivir Chem Chemother. 2003;14:61–73. doi: 10.1177/095632020301400201. [DOI] [PubMed] [Google Scholar]
- Mertz JA, Lozano MM, Dudley JP. Rev and Rex proteins of human complex retroviruses function with the MMTV Rem-responsive element. Retrovirology. 2009;6:10. doi: 10.1186/1742-4690-6-10. [DOI] [PMC free article] [PubMed] [Google Scholar]
- Mertz JA, Simper MS, Lozano MM, Payne SM, Dudley JP. Mouse mammary tumor virus encodes a self-regulatory RNA export protein and is a complex retrovirus. J Virol. 2005;79:14737–14747. doi: 10.1128/JVI.79.23.14737-14747.2005. [DOI] [PMC free article] [PubMed] [Google Scholar]
- Miller S, Krijnse-Locker J. Modification of intracellular membrane structures for virus replication. Nat Rev Microbiol. 2008;6:363–374. doi: 10.1038/nrmicro1890. [DOI] [PMC free article] [PubMed] [Google Scholar]
- Mothes W, Sherer NM, Jin J, Zhong P. Virus cell-to-cell transmission. J Virol. 2010;84:8360–8368. doi: 10.1128/JVI.00443-10. [DOI] [PMC free article] [PubMed] [Google Scholar]
- Müllner M, Salmons B, Günzburg WH, Indik S. Identification of the Rem-responsive element of mouse mammary tumor virus. Nucleic Acids Res. 2008;36:6284–6294. doi: 10.1093/nar/gkn608. [DOI] [PMC free article] [PubMed] [Google Scholar]
- Nappi F, Schneider R, Zolotukhin A, Smulevitch S, Michalowski D, Bear J, Felber BK, Pavlakis GN. Identification of a novel posttranscriptional regulatory element by using a rev- and RRE-mutated human immunodeficiency virus type 1 DNA proviral clone as a molecular trap. J Virol. 2001;75:4558–4569. doi: 10.1128/JVI.75.10.4558-4569.2001. [DOI] [PMC free article] [PubMed] [Google Scholar]
- Natalizio BJ, Wente SR. Postage for the messenger: designating routes for nuclear mRNA export. Trends Cell Biol. 2013;23:365–373. doi: 10.1016/j.tcb.2013.03.006. [DOI] [PMC free article] [PubMed] [Google Scholar]
- Neville M, Stutz F, Lee L, Davis LI, Rosbash M. The importin-beta family member Crm1p bridges the interaction between Rev and the nuclear pore complex during nuclear export. Curr Biol. 1997;7:767–775. doi: 10.1016/s0960-9822(06)00335-6. [DOI] [PubMed] [Google Scholar]
- Nitta T, Hofacre A, Hull S, Fan H. Identification and mutational analysis of a Rej response element in Jaagsiekte sheep retrovirus RNA. J Virol. 2009;83:12499–12511. doi: 10.1128/JVI.01754-08. [DOI] [PMC free article] [PubMed] [Google Scholar]
- Nott A, Le Hir H, Moore MJ. Splicing enhances translation in mammalian cells: an additional function of the exon junction complex. Genes Dev. 2004;18:210–222. doi: 10.1101/gad.1163204. [DOI] [PMC free article] [PubMed] [Google Scholar]
- Ogert RA, Beemon KL. Mutational analysis of the rous sarcoma virus DR posttranscriptional control element. J Virol. 1998;72:3407–3411. doi: 10.1128/jvi.72.4.3407-3411.1998. [DOI] [PMC free article] [PubMed] [Google Scholar]
- Okamura M, Inose H, Masuda S. RNA export through the NPC in eukaryotes. Genes. 2015;6:124–149. doi: 10.3390/genes6010124. [DOI] [PMC free article] [PubMed] [Google Scholar]
- Olsen HS, Cochrane AW, Dillon PJ, Nalin CM, Rosen CA. Interaction of the human immunodeficiency virus type 1 Rev protein with a structured region in env mRNA is dependent on multimer formation mediated through a basic stretch of amino acids. Genes Dev. 1990;4:1357–1364. doi: 10.1101/gad.4.8.1357. [DOI] [PubMed] [Google Scholar]
- Otero GC, Harris ME, Donello JE, Hope TJ. Leptomycin B inhibits equine infectious anemia virus Rev and feline immunodeficiency virus Rev function but not the function of the hepatitis B virus posttranscriptional regulatory element. J Virol. 1998;72:7593–7597. doi: 10.1128/jvi.72.9.7593-7597.1998. [DOI] [PMC free article] [PubMed] [Google Scholar]
- Otero GC, Hope TJ. Splicing-independent expression of the herpes simplex virus type 1 thymidine kinase gene is mediated by three cis-acting RNA subelements. J Virol. 1998;72:9889–9896. doi: 10.1128/jvi.72.12.9889-9896.1998. [DOI] [PMC free article] [PubMed] [Google Scholar]
- Paca RE, Ogert RA, Hibbert CS, Izaurralde E, Beemon KL. Rous sarcoma virus DR posttranscriptional elements use a novel RNA export pathway. J Virol. 2000;74:9507–9514. doi: 10.1128/jvi.74.20.9507-9514.2000. [DOI] [PMC free article] [PubMed] [Google Scholar]
- Pasquinelli AE, Ernst RK, Lund E, Grimm C, Zapp ML, Rekosh D, Hammarskjöld M-L, Dahlberg JE. The constitutive transport element (CTE) of Mason–Pfizer monkey virus (MPMV) accesses a cellular mRNA export pathway. EMBO J. 1997;16:7500–7510. doi: 10.1093/emboj/16.24.7500. [DOI] [PMC free article] [PubMed] [Google Scholar]
- Paterna J-C, Moccetti T, Mura A, Feldon J, Büeler H. Influence of promoter and WHV posttranscriptional regulatory element on AAV-mediated transgene expression in the rat brain. Gene Ther. 2000;7:1304–1311. doi: 10.1038/sj.gt.3301221. [DOI] [PubMed] [Google Scholar]
- Pessel-Vivares L, Ferrer M, Lainé S, Mougel M. MLV requires Tap/NXF1-dependent pathway to export its unspliced RNA to the cytoplasm and to express both spliced and unspliced RNAs. Retrovirology. 2014;11:21. doi: 10.1186/1742-4690-11-21. [DOI] [PMC free article] [PubMed] [Google Scholar]
- Pfeifer A, Kessler T, Yang M, Baranov E, Kootstra N, Cheresh DA, Hoffman RM, Verma IM. Transduction of liver cells by lentiviral vectors: analysis in living animals by fluorescence imaging. Mol Ther J Am Soc Gene Ther. 2001;3:319–322. doi: 10.1006/mthe.2001.0276. [DOI] [PubMed] [Google Scholar]
- Pocock GM, Becker JT, Swanson CM, Ahlquist P, Sherer NM. HIV-1 and M-PMV RNA nuclear export elements program viral genomes for distinct cytoplasmic trafficking behaviors. PLoS Pathog. 2016;12:e1005565. doi: 10.1371/journal.ppat.1005565. [DOI] [PMC free article] [PubMed] [Google Scholar]
- Pollard VW, Malim MH. The HIV-1 Rev protein. Annu Rev Microbiol. 1998;52:491–532. doi: 10.1146/annurev.micro.52.1.491. [DOI] [PubMed] [Google Scholar]
- Popa I, Harris ME, Donello JE, Hope TJ. CRM1-dependent function of a cis-acting RNA export element. Mol Cell Biol. 2002;22:2057–2067. doi: 10.1128/MCB.22.7.2057-2067.2002. [DOI] [PMC free article] [PubMed] [Google Scholar]
- Rausch JW, Grice SFJL. HIV Rev assembly on the Rev response element (RRE): a structural perspective. Viruses. 2015;7:3053–3075. doi: 10.3390/v7062760. [DOI] [PMC free article] [PubMed] [Google Scholar]
- Ribet D, Harper F, Dewannieux M, Pierron G, Heidmann T. Murine MusD retrotransposon: structure and molecular evolution of an “intracellularized” retrovirus. J Virol. 2007;81:1888–1898. doi: 10.1128/JVI.02051-06. [DOI] [PMC free article] [PubMed] [Google Scholar]
- Rizzo MA, Springer GH, Granada B, Piston DW. An improved cyan fluorescent protein variant useful for FRET. Nat Biotechnol. 2004;22:445–449. doi: 10.1038/nbt945. [DOI] [PubMed] [Google Scholar]
- Sakuma T, Davila JI, Malcolm JA, Kocher J-PA, Tonne JM, Ikeda Y. Murine leukemia virus uses NXF1 for nuclear export of spliced and unspliced viral transcripts. J Virol. 2014;88:4069–4082. doi: 10.1128/JVI.03584-13. [DOI] [PMC free article] [PubMed] [Google Scholar]
- Schindelin J, Arganda-Carreras I, Frise E, Kaynig V, Longair M, Pietzsch T, Preibisch S, Rueden C, Saalfeld S, Schmid B. Fiji: an open-source platform for biological-image analysis. Nat Methods. 2012;9:676–682. doi: 10.1038/nmeth.2019. [DOI] [PMC free article] [PubMed] [Google Scholar]
- Schindelin J, Rueden CT, Hiner MC, Eliceiri KW. The ImageJ ecosystem: an open platform for biomedical image analysis. Mol Reprod Dev. 2015;82:518–529. doi: 10.1002/mrd.22489. [DOI] [PMC free article] [PubMed] [Google Scholar]
- Sen N, Mukherjee G, Arvin AM. Single cell mass cytometry reveals remodeling of human T-cell phenotypes by varicella zoster virus. Methods. 2015;90:85–94. doi: 10.1016/j.ymeth.2015.07.008. [DOI] [PMC free article] [PubMed] [Google Scholar]
- Sherer NM, Lehmann MJ, Jimenez-Soto LF, Ingmundson A, Horner SM, Cicchetti G, Allen PG, Pypaert M, Cunningham JM, Mothes W. Visualization of retroviral replication in living cells reveals budding into multivesicular bodies. Traffic. 2003;4:785–801. doi: 10.1034/j.1600-0854.2003.00135.x. [DOI] [PubMed] [Google Scholar]
- Sherpa C, Rausch JW, Le Grice SFJ, Hammarskjold M-L, Rekosh D. The HIV-1 Rev response element (RRE) adopts alternative conformations that promote different rates of virus replication. Nucleic Acids Res. 2015;43:4676–4686. doi: 10.1093/nar/gkv313. [DOI] [PMC free article] [PubMed] [Google Scholar]
- Siddiqui N, Borden KLB. mRNA export and cancer. Wiley Interdiscip Rev RNA. 2012;3:13–25. doi: 10.1002/wrna.101. [DOI] [PubMed] [Google Scholar]
- Sinn PL, Sauter SL, McCray PB. Gene therapy progress and prospects: development of improved lentiviral and retroviral vectors—design, biosafety, and production. Gene Ther. 2005;12:1089–1098. doi: 10.1038/sj.gt.3302570. [DOI] [PubMed] [Google Scholar]
- Siomi H, Dreyfuss G. A nuclear localization domain in the hnRNP A1 protein. J Cell Biol. 1995;129:551–560. doi: 10.1083/jcb.129.3.551. [DOI] [PMC free article] [PubMed] [Google Scholar]
- Snijder B, Sacher R, Rämö P, Damm E-M, Liberali P, Pelkmans L. Population context determines cell-to-cell variability in endocytosis and virus infection. Nature. 2009;461:520–523. doi: 10.1038/nature08282. [DOI] [PubMed] [Google Scholar]
- Somia N, Verma IM. Gene therapy: trials and tribulations. Nat Rev Genet. 2000;1:91–99. doi: 10.1038/35038533. [DOI] [PubMed] [Google Scholar]
- Sommer G, Heise T. Posttranscriptional control of HBV gene expression. Front Biosci J Virtual Libr. 2008;13:5533–5547. doi: 10.2741/3097. [DOI] [PubMed] [Google Scholar]
- Swanson CM, Malim MH. Retrovirus RNA trafficking: from chromatin to invasive genomes. Traffic. 2006;7:1440–1450. doi: 10.1111/j.1600-0854.2006.00488.x. [DOI] [PubMed] [Google Scholar]
- Swanson CM, Puffer BA, Ahmad KM, Doms RW, Malim MH. Retroviral mRNA nuclear export elements regulate protein function and virion assembly. EMBO J. 2004;23:2632–2640. doi: 10.1038/sj.emboj.7600270. [DOI] [PMC free article] [PubMed] [Google Scholar]
- Swanstrom R, Wills J. Synthesis, Assembly, and Processing of Viral Proteins. Cold Spring Harbor, NY: Cold Spring Harbor Laboratory Press; 1997. [PubMed] [Google Scholar]
- Tabernero C, Zolotukhin AS, Bear J, Schneider R, Karsenty G, Felber BK. Identification of an RNA sequence within an intracisternal-A particle element able to replace Rev-mediated posttranscriptional regulation of human immunodeficiency virus type 1. J Virol. 1997;71:95–101. doi: 10.1128/jvi.71.1.95-101.1997. [DOI] [PMC free article] [PubMed] [Google Scholar]
- Tabernero C, Zolotukhin AS, Valentin A, Pavlakis GN, Felber BK. The posttranscriptional control element of the simian retrovirus type 1 forms an extensive RNA secondary structure necessary for its function. J Virol. 1996;70:5998–6011. doi: 10.1128/jvi.70.9.5998-6011.1996. [DOI] [PMC free article] [PubMed] [Google Scholar]
- Tamayo P, Slonim D, Mesirov J, Zhu Q, Kitareewan S, Dmitrovsky E, Lander ES, Golub TR. Interpreting patterns of gene expression with self-organizing maps: methods and application to hematopoietic differentiation. Proc Natl Acad Sci USA. 1999;96:2907–2912. doi: 10.1073/pnas.96.6.2907. [DOI] [PMC free article] [PubMed] [Google Scholar]
- Tavazoie S, Hughes JD, Campbell MJ, Cho RJ, Church GM. Systematic determination of genetic network architecture. Nat Genet. 1999;22:281–285. doi: 10.1038/10343. [DOI] [PubMed] [Google Scholar]
- Timm A, Yin J. Kinetics of virus production from single cells. Virology. 2012;424:11–17. doi: 10.1016/j.virol.2011.12.005. [DOI] [PMC free article] [PubMed] [Google Scholar]
- Trcek T, Larson DR, Moldón A, Query CC, Singer RH. Single-molecule mRNA decay measurements reveal promoter- regulated mRNA stability in yeast. Cell. 2011;147:1484–1497. doi: 10.1016/j.cell.2011.11.051. [DOI] [PMC free article] [PubMed] [Google Scholar]
- UNAIDS. 2016. UNAIDS 2016 Fact Sheet on HIV/AIDS. www.unaids.org/en/resources/fact-sheet (accessed 26 August 2016)
- Unchwaniwala N, Sherer NM, Loeb DD. Hepatitis B virus polymerase localizes to the mitochondria and its terminal protein domain contains the mitochondrial-targeting signal. J Virol. 2016;90:8705–8719. doi: 10.1128/JVI.01229-16. [DOI] [PMC free article] [PubMed] [Google Scholar]
- Varmus H. Regulation of HIV and HTLV gene expression. Genes Dev. 1988;2:1055–1062. doi: 10.1101/gad.2.9.1055. [DOI] [PubMed] [Google Scholar]
- Vercruysse T, Daelemans D. HIV-1 Rev multimerization: mechanism and insights. Curr HIV Res. 2013;11:623–634. doi: 10.2174/1570162x12666140307094603. [DOI] [PubMed] [Google Scholar]
- Vogt VM. Retroviral virions and genomes. In: Coffin JM, Hughes SH, Varmus HE, editors. Retroviruses. Cold Spring Harbor, NY: Cold Spring Harbor Laboratory Press; 1997. pp. 27–69. [PubMed] [Google Scholar]
- Wang B, Rekosh D, Hammarskjold M-L. Evolutionary conservation of a molecular machinery for export and expression of mRNAs with retained introns. RNA. 2015;21:426–437. doi: 10.1261/rna.048520.114. [DOI] [PMC free article] [PubMed] [Google Scholar]
- WHO. 2016. 2016 WHO Fact Sheet on Hepatitis B. www.who.int/mediacentre/factsheets/fs204/en (accessed 26 August 2016)
- Wodrich H, Bohne J, Gumz E, Welker R, Kräusslich HG. A new RNA element located in the coding region of a murine endogenous retrovirus can functionally replace the Rev/Rev-responsive element system in human immunodeficiency virus type 1 Gag expression. J Virol. 2001;75:10670–10682. doi: 10.1128/JVI.75.22.10670-10682.2001. [DOI] [PMC free article] [PubMed] [Google Scholar]
- Wu B, Eliscovich C, Yoon YJ, Singer RH. Translation dynamics of single mRNAs in live cells and neurons. Science. 2016;352:1430–1435. doi: 10.1126/science.aaf1084. [DOI] [PMC free article] [PubMed] [Google Scholar]
- Wu Y. HIV-1 gene expression: lessons from provirus and nonintegrated DNA. Retrovirology. 2004;1:13. doi: 10.1186/1742-4690-1-13. [DOI] [PMC free article] [PubMed] [Google Scholar]
- Yan X, Hoek TA, Vale RD, Tanenbaum ME. Dynamics of translation of single mRNA molecules in vivo. Cell. 2016;165:976–989. doi: 10.1016/j.cell.2016.04.034. [DOI] [PMC free article] [PubMed] [Google Scholar]
- Yang C-C, Huang E-Y, Li H-C, Su P-Y, Shih C. Nuclear export of human hepatitis b virus core protein and pregenomic RNA depends on the cellular nxf1-p15 machinery. PLoS One. 2014;9:e106683. doi: 10.1371/journal.pone.0106683. [DOI] [PMC free article] [PubMed] [Google Scholar]
- Yang J, Bogerd H, Le SY, Cullen BR. The human endogenous retrovirus K Rev response element coincides with a predicted RNA folding region. RNA. 2000;6:1551–1564. doi: 10.1017/s135583820000100x. [DOI] [PMC free article] [PubMed] [Google Scholar]
- Yang J, Bogerd HP, Peng S, Wiegand H, Truant R, Cullen BR. An ancient family of human endogenous retroviruses encodes a functional homolog of the HIV-1 Rev protein. Proc Natl Acad Sci USA. 1999;96:13404–13408. doi: 10.1073/pnas.96.23.13404. [DOI] [PMC free article] [PubMed] [Google Scholar]
- Yang J, Cullen BR. Structural and functional analysis of the avian leukemia virus constitutive transport element. RNA. 1999;5:1645–1655. doi: 10.1017/s1355838299991616. [DOI] [PMC free article] [PubMed] [Google Scholar]
- Zang W-Q, Li B, Huang P-Y, Lai MMC, Yen TSB. Role of polypyrimidine tract binding protein in the function of the hepatitis b virus posttranscriptional regulatory element. J Virol. 2001;75:10779–10786. doi: 10.1128/JVI.75.22.10779-10786.2001. [DOI] [PMC free article] [PubMed] [Google Scholar]
- Zang WQ, Yen TS. Distinct export pathway utilized by the hepatitis B virus posttranscriptional regulatory element. Virology. 1999;259:299–304. doi: 10.1006/viro.1999.9777. [DOI] [PubMed] [Google Scholar]
- Zufferey R, Donello JE, Trono D, Hope TJ. Woodchuck hepatitis virus posttranscriptional regulatory element enhances expression of transgenes delivered by retroviral vectors. J Virol. 1999;73:2886–2892. doi: 10.1128/jvi.73.4.2886-2892.1999. [DOI] [PMC free article] [PubMed] [Google Scholar]
Associated Data
This section collects any data citations, data availability statements, or supplementary materials included in this article.