

Abstract
BACKGROUND & AIMS
We investigated the real-world effectiveness of sofosbuvir, ledipasvir/sofosbuvir, and paritaprevir/ ritonavir/ombitasvir and dasabuvir (PrOD) in treatment of different subgroups of patients infected with hepatitis C virus (HCV) genotypes 1, 2, 3, or 4.
METHODS
We performed a retrospective analysis of data from 17,487 patients with HCV infection (13,974 with HCV genotype 1; 2131 with genotype 2; 1237 with genotype 3; and 135 with genotype 4) who began treatment with sofosbuvir (n = 2986), ledipasvir/sofosbuvir (n = 11,327), or PrOD (n = 3174), with or without ribavirin, from January 1, 2014 through June 20, 2015 in the Veterans Affairs health care system. Data through April 15, 2016 were analyzed to assess completion of treatments and sustained virologic response 12 weeks after treatment (SVR12). Mean age of patients was 61 ± 7 years, 97% were male, 52% were non-Hispanic white, 29% were non-Hispanic black, 32% had a diagnosis of cirrhosis (9.9% with decompensated cirrhosis), 36% had a Fibrosis-4 index score >3.25 (indicator of cirrhosis), and 29% had received prior antiviral treatment.
RESULTS
An SVR12 was achieved by 92.8% (95% confidence interval [CI], 92.3%–93.2%) of subjects with HCV genotype 1 infection (no significant difference between ledipasvir/sofosbuvir and PrOD regimens), 86.2% (95% CI, 84.6%–87.7%) of those with genotype 2 infection (treated with sofosbuvir and ribavirin), 74.8% (95% CI, 72.2%–77.3%) of those with genotype 3 infection (77.9% in patients given ledipasvir/sofosbuvir plus ribavirin, 87.0% in patients given sofosbuvir and pegylated-interferon plus ribavirin, and 70.6% of patients given sofosbuvir plus ribavirin), and 89.6% (95% CI 82.8%–93.9%) of those with genotype 4 infection. Among patients with cirrhosis, 90.6% of patients with HCV genotype 1, 77.3% with HCV genotype 2, 65.7% with HCV genotype 3, and 83.9% with HCV genotype 4 achieved an SVR12. Among previously treated patients, 92.6% with genotype 1; 80.2% with genotype 2; 69.2% with genotype 3; and 93.5% with genotype 4 achieved SVR12. Among treatment-naive patients, 92.8% with genotype 1; 88.0% with genotype 2; 77.5% with genotype 3; and 88.3% with genotype 4 achieved SVR12. Eight-week regimens of ledipasvir/sofosbuvir produced an SVR12 in 94.3% of eligible patients with HCV genotype 1 infection; this regimen was underused.
CONCLUSIONS
High proportions of patients with HCV infections genotypes 1–4 (ranging from 75% to 93%) in the Veterans Affairs national health care system achieved SVR12, approaching the results reported in clinical trials, especially in patients with genotype 1 infection. An 8-week regimen of ledipasvir/sofosbuvir is effective for eligible patients with HCV genotype 1 infection and could reduce costs. There is substantial room for improvement in SVRs among persons with cirrhosis and genotype 2 or 3 infections.
Keywords: Harvoni, Viekira, DAA, VA
The introduction of sofosbuvir (SOF) in December of 2013 and ledipasvir/sofosbuvir (LDV/SOF) and paritaprevir/ritonavir/ombitasvir and dasabuvir (PrOD) in October and December of 2014, respectively, made highly effective, well-tolerated, non–interferon-based antiviral regimens for hepatitis C virus (HCV) infection available for the first time. These regimens were reported in clinical trials to have sustained virologic response (SVR) rates well in excess of 90%,1-9 with the exception of certain subgroups, such as patients with Child’s B or C cirrhosis10 and those infected with genotype 3 HCV.11
Prior interferon-based antiviral regimens had significantly lower SVR rates in real-world clinical practice than in clinical trials.12-17 It is unclear if this is the case for current interferon-free regimens, or whether the relative ease of administration of these regimens has narrowed the SVR gap between clinical trials and clinical practice. Some non–US Food and Drug Administration (FDA)-approved regimens have been used widely in clinical practice, but it is unclear if they are as effective as FDA-approved regimens and whether they are used in appropriate patient groups. Finally, for HCV genotypes and patient subgroup for which multiple regimens exist, it is uncertain whether there are substantial differences in effectiveness between regimens.
We aimed to describe and compare the real-world effectiveness of SOF, LDV/SOF, and PrOD-based regimens among clinically relevant patient subgroups in a national health care system. Such data on effectiveness are important for guiding patients and providers in making decisions about treatment regimens and timing of treatment, as well as informing policy around treatment coverage.
Methods
Data Source: The Veterans Affairs Corporate Data Warehouse
The Veterans Affairs (VA) health care system includes 167 medical centers and 875 ambulatory care and community-based outpatient clinics throughout the United States. It is the largest integrated health care provider for HCV-infected patients in the United States. There were 174,889 patients with diagnosed HCV infection in VA care in 2014 and an estimated additional 45,000 patients with undiagnosed HCV infection.15 The VA utilizes electronic medical records almost exclusively. We extracted electronic data on all patients in VA care who received HCV antiviral treatments using the VA Corporate Data Warehouse, a national, continually updated repository of data from the VA’s computerized patient records.18 Data extracted included all patient pharmacy prescriptions, demographic characteristics, inpatient and outpatient visits, problem lists, procedures, vital signs, diagnostic tests, and laboratory tests.
Study Population and Antiviral Regimens
Of 24,089 HCV antiviral regimens initiated in the VA nationally during the 18-month period from January 1, 2014 (the month after SOF was approved by the FDA) to June 30, 2015 and completed before October 1, 2015, we excluded 6193 regimens that were no longer used or recommended by the time we analyzed our data (eg, SOF and simeprevir±ribavirin or SOF+pegylated interferon [PEG]/RIBA for genotype 1–infected patients) (Figure 1A). We additionally excluded 409 duplicate regimens, in which the same patient appeared to have received one very short regimen (eg, 14-day regimen) followed at a later date by a longer course of the same regimen (these short, duplicate regimens were most likely erroneous or postponed prescriptions) leaving 17,487 patients in the current analysis, all of which included the direct antiviral agents (DAAs) SOF, LDV/SOF, or PrOD.
Figure 1.
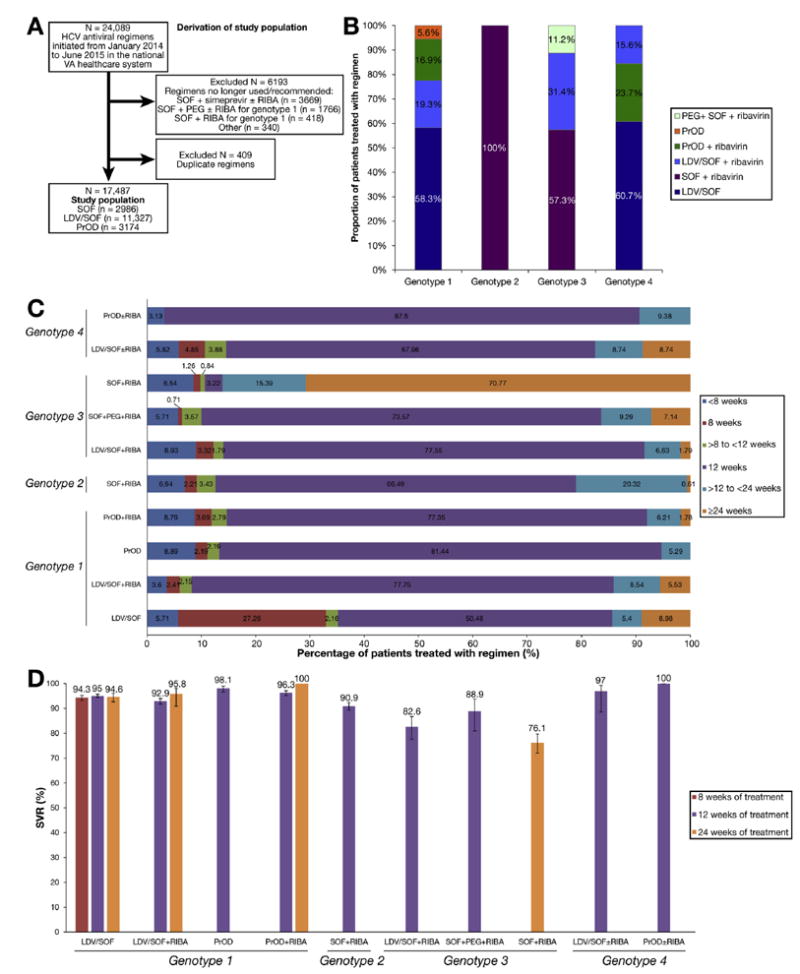
Study population, duration of antiviral treatment and SVR. (A) Derivation of study population. (B) Distribution of HCV antiviral regimens by genotype during period January 2014 to June 2015. (C) Proportions of patient completing treatment durations of <8 weeks, 8 weeks, >8 to <12 weeks, >12 to <24 weeks, and ≥24 weeks, by genotype and treatment regimen. (D) SVR in patients completing 8 weeks, 12 weeks, or 24 weeks of treatment, by genotype and treatment regimen.
Duration of therapy was determined as the total duration of the DAA prescriptions filled. A course was considered terminated if medications were not refilled within 45 days after the final prescription was exhausted. Data extended backward to October 1, 1999, in order to allow determination of previous antiviral treatments and medical history, and forward until April 15, 2016, in order to allow completion of treatments and ascertainment of SVR.
Baseline Characteristics
All baseline characteristics were ascertained using data recorded before the initiation of antiviral treatment. We ascertained age race, ethnicity, sex, receipt of a prior antiviral regimen since 1999 (treatment experienced); diagnosis of cirrhosis (defined by International Classification of Diseases, 9th revision (ICD-9) codes for cirrhosis with alcoholism (571.2) or cirrhosis no mention of alcohol (571.5) or by the presence of decompensated cirrhosis defined by the ICD-9 codes for esophageal varices with or without bleeding (456.0–456.21), ascites (789.5), spontaneous bacterial peritonitis (567.23), hepatic encephalopathy (572.2), and hepatorenal syndrome (572.4); hepatocellular carcinoma (defined by ICD-9 code 155.019-22); diabetes (ICD-9 codes 250.0–250.92 or prescription of diabetes medications); and liver transplantation (ICD-9 code 996.82, V42.7). Patients with cirrhosis or hepatocellular carcinoma (HCC) who underwent liver transplantation were excluded from the cirrhosis or HCC categories. We used ICD-9 codes to define depression (311.0–311.9), post-traumatic stress disorder (309.81), anxiety or panic (300.0–300.9), and schizophrenia (295.0–295.9). Alcohol use disorders were identified by ICD-9 codes for alcohol abuse (305.00–305.03), dependence (303.90–303.93), and withdrawal (291.81). Substance use disorders were defined by codes for substance abuse (305.2–305.9), dependence (304.0–304.9), or drug withdrawal (292.0). These conditions were noted only if recorded at least twice before treatment initiation in any inpatient or outpatient encounter. These ICD-9–based definitions of cirrhosis and HCC,19-24 as well as the other comorbidities,14,21,25-28 have been widely used and validated in VA medical records.
We extracted all laboratory tests shown in Table 1 and recorded the value of each test closest to the treatment starting date within the preceding 6 months. We calculated the Fibrosis-4 Index (FIB-4) score29 (FIB-4 = [age × aspartate aminotransferase]/[platelets × alanine aminotransferase1/2]), which is associated with advanced fibrosis and cirrhosis. Of 17,487 regimens, 678 had missing genotype information. These patients were treated with either PrOD±ribavirin (n = 130) or LDV/SOF monotherapy (n = 548) and were assigned genotype 1 because these regimens are used almost exclusively for genotype 1 HCV. Among patients with known genotype treated with these regimens 11,761 of 11,871 (99%) had genotype 1 HCV.
Table 1.
Baseline Characteristics of 17,487 Patients Who Initiated Antiviral Treatment in the Veterans Affairs Nationally From January 2014 to June 2015
| Genotype 1, %b
|
Genotype 2, %, b
|
Genotype 3, %b
|
Genotype 4, %b
|
||||||||
|---|---|---|---|---|---|---|---|---|---|---|---|
| Characteristic | All patients, n (%)a | LDV/SOF | LDV/SOF+RIBA | PrOD | PrOD+RIBA | SOF+RIBA | LDV/SOF+RIBA | SOF+PEG+RIBA | SOF+RIBA | LDV/SOF±RIBA | PrOD±RIBA |
| All patients | 17,487 (100) | 8140 | 2692 | 776 | 2366 | 2131 | 392 | 140 | 715 | 103 | 32 |
| Age, y, mean (SD) | 61 (7) | 61 (6) | 62 (5) | 62 (6) | 61 (6) | 61 (7) | 58 (8) | 58 (5) | 58 (8) | 60 (7) | 60 (8) |
| Male | 16,920 (97) | 96 | 97 | 97 | 98 | 97 | 98 | 97 | 98 | 94 | 100 |
| Race/ethnicity | |||||||||||
| White, non-Hispanic | 9141 (52) | 46 | 52 | 40 | 48 | 70 | 74 | 68 | 77 | 58 | 48 |
| Black, non-Hispanic | 5043 (29) | 36 | 27 | 45 | 32 | 8.9 | 2.0 | 6.1 | 3.4 | 32 | 39 |
| Hispanic | 913 (5.3) | 4.3 | 6.8 | 3.0 | 5.6 | 6.1 | 7.8 | 8.2 | 7.3 | 6.6 | 0 |
| Asian, Pacific Islander, American Indian | 280 (1.6) | 1.4 | 1.6 | 0.6 | 2.0 | 1.6 | 3.2 | 2.7 | 2.7 | 0 | 3.0 |
| Declined to answer, missing | 2110 (12) | 12 | 13 | 11 | 13 | 13 | 13 | 15 | 9.8 | 2.8 | 9.0 |
| Treatment experienced | 5109 (29) | 25 | 56 | 21 | 26 | 23 | 26 | 48 | 31 | 26 | 24 |
| Prior interferon | 4680 (27) | 22 | 51 | 20 | 24 | 21 | 23 | 48 | 28 | 24 | 24 |
| Prior boceprevir | 929 (5.3) | 5.4 | 17 | 0.9 | 1.6 | 0 | 0 | 0 | 0 | 0 | 0 |
| Prior telaprevir | 225 (1.3) | 1.3 | 4.5 | 0.1 | 0.04 | 0 | 0 | 0 | 0 | 0 | 0 |
| Prior simeprevir+SOF | 306 (1.8) | 1.5 | 6.5 | 0.6 | 0.9 | 0 | 0 | 0 | 0 | 0 | 0 |
| Prior SOF | 741 (4.2) | 2.9 | 14 | 1.2 | 2.2 | 2.6 | 5.4 | 2.7 | 2.6 | 3.8 | 0 |
| Prior LDV/SOF | 142 (0.8) | 1.2 | 1.2 | 0.6 | 0.4 | 0 | 0.5 | 0 | 0.5 | 0.9 | 0 |
| Prior PrOD | 68 (0.4) | 0.2 | 0.4 | 0.6 | 1.5 | 0 | 0 | 0 | 0 | 0 | 0 |
| HCV RNA viral load >6 million IU/mL | 3248 (19) | 17 | 16 | 22 | 23 | 24 | 15 | 15 | 15 | 14 | 6 |
| HIV co-infection | 713 (4.1) | 6.0 | 3.7 | 2.1 | 1.4 | 2.4 | 2.0 | 4.1 | 1.8 | 8.5 | 3.0 |
| Cirrhosis | 5250 (30) | 23 | 58 | 6.8 | 29 | 25 | 35 | 54 | 43 | 25 | 25 |
| Decompensated cirrhosis | 1448 (8.3) | 5.9 | 18 | 0.9 | 4.5 | 7.9 | 13 | 11 | 16 | 7.8 | 9.4 |
| Hepatocellular carcinoma | 482 (2.8) | 2.1 | 6.1 | 0.6 | 2.0 | 1.6 | 4.9 | 4.3 | 4.3 | 1.9 | 3.1 |
| Liver transplantation | 391 (2.2) | 1.7 | 7.5 | 0.1 | 0.2 | 1.5 | 3.2 | 0.7 | 3.2 | 1.9 | 0 |
| Diabetes | 5106 (29) | 30 | 38 | 29 | 25 | 27 | 25 | 20 | 25 | 27 | 18 |
| Alcohol use disorder | 7720 (44) | 44 | 45 | 38 | 40 | 45 | 53 | 50 | 51 | 37 | 42 |
| Substance use disorder | 6466 (37) | 39 | 33 | 33 | 34 | 35 | 43 | 40 | 43 | 41 | 36 |
| Depression | 8284 (47) | 49 | 51 | 41 | 43 | 45 | 49 | 51 | 51 | 52 | 48 |
| PTSD | 4689 (27) | 28 | 27 | 23 | 25 | 26 | 26 | 18 | 26 | 28 | 15 |
| Anxiety/panic | 5961 (34) | 35 | 34 | 28 | 31 | 35 | 37 | 32 | 38 | 41 | 33 |
| Schizophrenia | 941 (5.4) | 6.1 | 4.5 | 4.7 | 4.5 | 5.4 | 4.2 | 2.0 | 4.4 | 3.8 | 9.1 |
| Laboratory results | |||||||||||
| Anemiac | 2541 (15) | 17 | 17 | 13 | 9 | 13 | 11 | 11 | 13 | 14 | 6 |
| Platelet count <100 k/μL | 2368 (14) | 11 | 26 | 1 | 11 | 14 | 21 | 22 | 26 | 7.6 | 9.1 |
| Creatinine >1.1 mg/dL | 3384 (20) | 22 | 21 | 22 | 18 | 17 | 12 | 8.2 | 12 | 23 | 17 |
| Bilirubin >1.1 g/dL | 294 (14) | 12 | 24 | 6 | 11 | 14 | 17 | 14 | 22 | 11 | 9 |
| Albumin <3.6 g/dL | 3564 (20) | 19 | 35 | 10 | 17 | 16 | 21 | 20 | 25 | 19 | 18 |
| INR >1.1 | 3653 (22) | 20 | 31 | 9.8 | 18 | 24 | 29 | 25 | 33 | 18 | 9.3 |
| FIB-4d score >3.25 | 5960 (36) | 31 | 55 | 12 | 34 | 35 | 49 | 53 | 58 | 26 | 21 |
INR, international normalized ratio; PTSD, post-traumatic stress disorder.
Data are n (%) except age, which is mean (SD).
Data are percentages, except age, which is mean (SD), and all patients, which is n (%).
Anemia is defined as a hemoglobin concentration <13 g/dL in men or <12 g/dL in women.
FIB-4 score29 = [age × aspartate aminotransferase] / [platelets × alanine aminotransferase1/2].
Sustained Virologic Response
SVR was defined by a viral load below the limit of quantification performed >12 weeks after the end of treatment.30 If no viral load test was available >12 weeks after the end of treatment, then SVR was defined by a viral load performed 4 to 12 weeks after the end of treatment, which accounted for only 996 additional SVR determinations. This was justified because SVR ascertained based on viral load 4 weeks after the end of treatment was shown to have 98% concordance (positive predictive value 98%; negative predictive value 100%) with SVR ascertained based on viral load >12 weeks after the end of treatment in SOF-treated patients.30
Statistical Analysis
We determined SVR rates and their 95% confidence intervals (CIs) by regimen, genotype, and clinically significant subgroup. We developed multivariable logistic regression models predicting SVR using age, sex, race/ethnicity, history of alcohol use disorders, HCV genotype and subgenotype, HCV regimen, baseline HCV viral load, diabetes, treatment naïve/ experienced, cirrhosis, decompensated cirrhosis, HCC, liver transplantation, platelet count, serum bilirubin and albumin levels, separately for each genotype or for all patients combined in order to identify significant predictors of SVR.
Genotypes 1 and 3 have multiple treatment regimen options available requiring additional analytical methods to determine the association between regimen and SVR, because the regimens were not randomly assigned. We chose to use an augmented inverse-probability-weighted method using propensity scores as weights to estimate the average treatment effect of different regimens on achieving SVR for these genotypes.31 Augmented inverse-probability-weighted estimators are doubly robust and provide consistent estimates in the case of correct specification of either the treatment assignment propensity score model (multinomial logit) or the SVR outcome model (logit). After the removal of 304 (2%) genotype 1 and 34 (3%) genotype 3 patients without sufficient overlap, positivity was assumed. Exchangeability was assumed by the inclusion of the following confounders in the regimen assignment model: race/ethnicity, baseline HCV viral load, diabetes, treatment naïve/experienced, cirrhosis, decompensated cirrhosis, HCC, platelet count, serum bilirubin, and albumin levels. The same predictors were used in the SVR outcome model as those listed here for the multivariable logistic regression.
We anticipated that viral load testing necessary to ascertain SVR might be missing in a proportion of patients. To estimate the impact that missing SVR data might have, we used multiple imputation to impute missing SVR values in secondary analyses. Missing SVR values were imputed using a logistic regression model that included duration of treatment together with 24 baseline patient characteristics shown in Table 1, including regimen, genotype, treatment experience/naïve, cirrhosis, and HCC. The number of imputations was varied from 10 to 200, resulting in estimates that were identical up to 4 significant digits. The model was determined stable and an m = 20 imputations were used. Data were assumed to be missing at random. This assumption was verified using observed data.
Analyses were performed using STATA MP version 14 (StataCorp, College Station, TX).
Results
Treatment Regimens by Genotype
Among HCV genotype 1-infected patients (n = 13,974), the majority were treated with LDV/SOF alone (58%) or in combination with ribavirin (19%), while PrOD regimens with (17%) or without (5.5%) ribavirin were used much less frequently (Figure 1B). Genotype 2–infected patients (n = 2131) were all treated with SOF and ribavirin. The majority of genotype 3–infected patients (n = 1247) were treated with SOF and ribavirin (57%), followed by LDV/SOF and ribavirin (31%) and SOF+PEG+ribavirin (11%). Genotype 4–infected patients (n = 135) were treated mostly with LDV/SOF alone (61%) or in combination with ribavirin (16%), while the remaining 23% received PrOD with ribavirin.
Patient Characteristics
The mean age of antiviral treatment recipients was 61 ± 7 years, 97% were male, 52% were non-Hispanic white, 29% were non-Hispanic black, 32% had a diagnosis of cirrhosis (including 9.9% with decompensated cirrhosis), 36% had an FIB-4 score >3.25 (suggestive of cirrhosis), 3.7% had HCC and 29% were treatment-experienced (Table 1). Among genotype 1–infected patients, those treated with LDV/SOF and ribavirin were more than twice as likely to be treatment-experienced and to have cirrhosis, decompensated cirrhosis, or HCC than patients treated with LDV/SOF monotherapy or PrOD regimens. Almost all liver transplantation recipients with genotype 1 infection were treated with LDV/SOF rather than PrOD regimens. Among genotype 3–infected patients, those treated with SOF+PEG+ribavirin were more likely to be treatment-experienced and to have cirrhosis than those treated with SOF+ribavirin or LDV/SOF+RIBA. Genotype 2– and 3–infected patients were much more likely to be white and less likely to be black than genotype 1– and 4–infected patients.
Early Discontinuation of Treatment
Early discontinuation of treatment in <8 weeks occurred in 6.3% (n = 1098) among all patients who initiated antiviral treatment (n = 17,487) and in 4.4% (n = 700) among those with available SVR data (n = 15,884). Among genotype 1–infected patients, early discontinuation in <8 weeks was more common in PrOD (8.9%) and PrOD plus ribavirin (8.8%) regimens than in LDV/SOF (5.7%) or LDV/ SOF plus ribavirin (3.6%) regimens (P < .001) (Figure 1C and Supplementary Table 1). Early discontinuation in <8 weeks was more common in genotype 3–infected patients (8.3%) than in genotype 2 (7.0%) or genotype 1 (6.0%) patients. Early discontinuation was not more common in patients with cirrhosis (5.2%), decompensated cirrhosis (6.1%), or age ≥65 years (6.5%), but was slightly more common in black (7.0%), Hispanic (8.4%), and Asian/Pacific Islander/America Indian/Alaska Native (7.9%) patients than in white patients (5.7%).
Overall Sustained Virologic Response Rates by Genotype
Of 17,487 patients, SVR data were available in 15,884 (91%) and are reported here and in Tables 2-5 and Figures 1 and 2.
Table 2.
Sustained Virologic Response Rates (95% Confidence Intervals) in 15,884a Patients Who Initiated Antiviral Treatment in the Veterans Affairs Nationally From January 2014 to June 2015
| Genotype 1, SVR, % (95% CI)
|
Genotype 2, SVR, % (95% CI)
|
Genotype 3, SVR, % (95% CI)
|
Genotype 4, SVR, % (95% CI)
|
|||||||||
|---|---|---|---|---|---|---|---|---|---|---|---|---|
| n | All patients | LDV/SOF | LDV/SOF+RIBA | PrOD | PrOD+RIBA | SOF+RIBA | LDV/SOF+RIBA | SOF+PEG+RIBA | SOF+RIBA | LDV/SOF±RIBA | PrOD±RIBA | |
| n | 15,884 | 7412 | 2500 | 704 | 2128 | 1910 | 344 | 131 | 630 | 97 | 28 | |
| All patients | 15,884 | 90.7 (90.2–91.1) | 92.9 (92.2–93.3) | 92.0 (90.9–93.0) | 94.9 (92.9–96.3) | 92.5 (91.3–93.5) | 86.2 (84.6–87.7) | 77.9 (73.1–82.0) | 87.0 (80.0–91.8) | 70.6 (66.9–74.1) | 87.6 (79.3–92.9) | 96.4 (76.3–99.5) |
| Patients who completed | ||||||||||||
| 8-wk treatment | 2027 | NA | 94.3 (93.2–95.3) | NA | NA | NA | NA | NA | NA | NA | NA | NA |
| 12-wk treatment | 9921 | 94.0 (93.5–94.4) | 95.0 (94.3–95.7) | 92.9 (91.7–94.0) | 98.1 (96.7–99.0) | 96.3 (95.3–97.1) | 90.9 (89.3–92.4) | 82.6 (77.6–86.7) | 88.9 (80.9–93.8) | NA | 97.0 (88.5–99.3) | 100 |
| 24-wk treatment | 1383 | 88.1 (86.3–89.7) | 94.6 (92.7–96.1) | 95.8 (90.9–98.1) | NA | 100 | NA | NA | NA | 76.1 (72.0–79.7) | NA | NA |
| SVR in the following subgroups | ||||||||||||
| No cirrhosis | 11,111 | 92.3 (91.8–92.8) | 93.5 (92.8–94.1) | 95.6 (94.1–96.7) | 94.8 (92.8–96.3) | 92.1 (90.6–93.5) | 89.1 (89.1–90.6) | 84.8 (79.4–88.9) | 93.4 (83.4–97.6) | 77.6 (72.9–81.6) | 90.3 (80.7–95.4) | 95.5 (70.4–99.5) |
| Cirrhosis | 4773 | 86.8 (85.8–87.7) | 90.5 (88.9–91.9) | 89.4 (87.7–90.9) | 95.7 (83.8–99.0) | 93.4 (91.1–95.1) | 77.3 (73.3–80.8) | 65.3 (56.3–73.3) | 81.4 (70.3–89.0) | 61.9 (56.0–67.4) | 80.0 (58.3–92.0) | 100 |
| FIB-4 score ≤3.25 | 9695 | 92.5 (92.0–93.0) | 93.7 (93.0–94.3) | 93.7 (92.1–95.0) | 95.2 (93.1–96.6) | 92.2 (90.6–93.5) | 89.2 (87.3–90.9) | 85.6 (79.4–90.2) | 92.9 (82.0–97.4) | 80.4 (74.9–84.9) | 90 (80.2–95.2) | 95.5 (70.4–99.5) |
| FIB-4 score >3.25 | 5418 | 87.4 (86.7–88.3) | 90.9 (89.6–92.1) | 90.7 (89.0–92.2) | 92.6 (84.2–96.7) | 93.1 (90.9–94.8) | 80.8 (77.6–83.7) | 69.0 (61.2–75.9) | 81.0 (69.0–89.0) | 62.7 (57.5–67.7) | 80.8 (59.6–92.3) | 100 |
| Treatment-naïve | 11,159 | 91.1 (90.6–91.6) | 92.7 (92.0–93.4) | 92.9 (91.2–94.3) | 95.8 (93.8–97.2) | 92.0 (90.6–93.3) | 88.0 (86.3–89.6) | 78.1 (72.3–82.7) | 90.6 (80.3–95.9) | 75.1 (70.8–79.0) | 86.1 (75.8–92.5) | 95.5 (70.4–99.5) |
| Treatment-experienced | 4725 | 89.7 (88.7–90.5) | 93.2 (91.9–94.3) | 91.4 (89.8–92.7) | 91.4 (85.7–95.0) | 93.8 (91.4–95.5) | 80.2 (76.2–83.6) | 77.4 (67.0–85.2) | 83.6 (72.4–90.8) | 61.1 (54.0–67.6) | 92.0 (70.9–98.2) | 100 |
NA, not available.
The number of patients is different from that in Table 1 because Table 2 includes only 15,884 patients with available SVR data (of 17,487 patients who initiated antiviral treatment).
Table 5.
Comparison of Observed Sustained Virologic Response Among Patients With Available Sustained Virologic Response Data (n = 15,884) and Combined Observed or Imputed Sustained Virologic Response Among All Patients Who Initiated Antiviral Treatment (n = 17,487)
| Observed SVR, % (95% CI) (n = 15,884) | Observed SVR or Imputed SVRa for patients missing SVR data, % (95% CI) (n = 17,301) | SVR assuming all patients with missing SVR data did not achieve SVR, % (95% CI) (n = 17,487) | |
|---|---|---|---|
| All patients | 90.7 (90.2–91.1) | 90.0 (90–91) | 82.4 (81.8–82.9) |
| Genotype 1 | 92.8 (92.3–93.2) | 92.2 (92–93) | 84.6 (84.0–85.2) |
| LDV/SOF | 92.9 (92.2–93.3) | 93 (92–93) | 84.5 (83.7–85.3) |
| LDV/SOF+RIBA | 92.0 (90.9–93.0) | 92 (90–93) | 85.5 (84.1–86.8) |
| PrOD | 94.9 (92.9–96.3) | 94 (92–96) | 86.1 (83.5–88.3) |
| PrOD+RIBA | 92.5 (91.3–93.5) | 91 (90–92) | 83.2 (81.6–84.6) |
| Genotype 2 | |||
| SOF+RIBA | 86.2 (84.6–87.7) | 85 (84–87) | 77.2 (75.4–79.0) |
| Genotype 3 | 74.8 (72.2–77.3) | 73.9 (71–77) | 66.3 (63.6–68.9) |
| LDV/SOF+RIBA | 77.9 (73.1–82.0) | 77 (73–82) | 68.4 (63.6–72.8) |
| SOF+PEG+RIBA | 87.0 (80.0–91.8) | 86 (80–92) | 81.4 (74.0–87.1) |
| SOF+RIBA | 70.6 (66.9–74.1) | 70 (66–73) | 62.2 (58.6–65.7) |
| Genotype 4 | 89.6 (82.8–93.9) | 86.9 (81–93) | 83.0 (75.6–88.5) |
| LDV/SOF±RIBA | 87.6 (79.3 –92.9) | 86 (78–93) | 82.5 (73.8–88.8) |
| PrOD±RIBA | 96.4 (76.3 –99.5) | 90 (78–100) | 84.3 (66.3–93.7) |
Imputed by multiple imputation using a logistic regression model that included duration of treatment together with 24 baseline patient characteristics shown in Table 1. The number of patients is slightly less than 17,487 due to missing data in the characteristics used to impute SVR.
Figure 2.
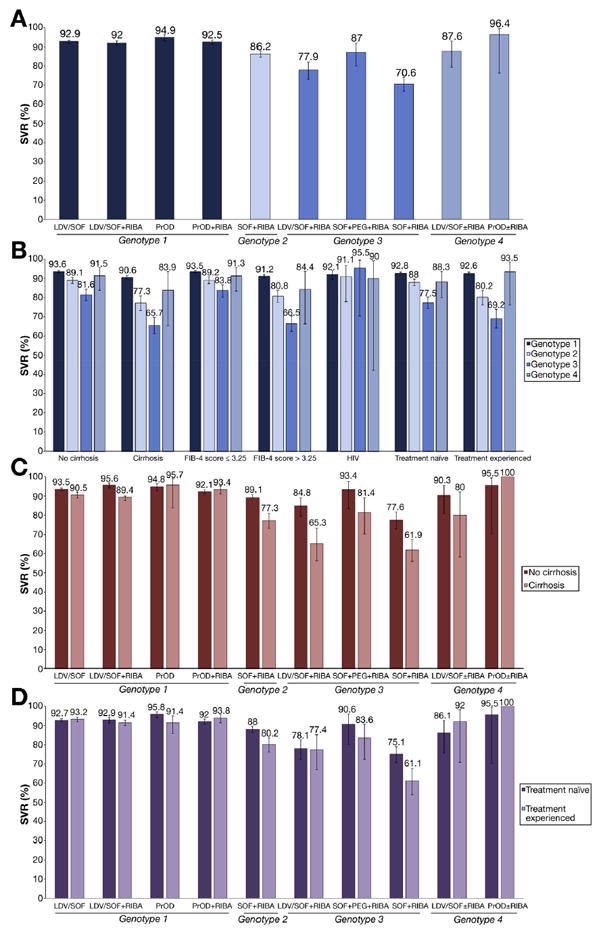
SVR rates by genotype and antiviral regimen. (A) SVR in all patients by genotype and treatment regimen. (B) SVR in subpopulations by genotype. (C) SVR in patients with vs without cirrhosis by genotype and treatment regimen. (D) SVR in treatment naïve vs experienced patients by genotype and treatment regimen.
SVR rates were 90.7% overall and were higher in genotype 1 (SVR 92.8%; 95% CI, 92.3%–93.2%) and genotype 4–infected patients (SVR 89.6%; 95% CI, 82.8%–93.9%) than genotype 2 (SVR 86.2%; 95% CI, 84.6%–87.7%) or 3 (SVR 74.8%; 95% CI, 72.2%–77.3%) patients. Among genotype 1–infected patients, all 4 regimens studied had similarly high SVR rates, ranging from 92.0% to 94.9%, with no significant difference between LDV/SOF and PrOD regimens in unadjusted SVR rates (Table 2 and Figure 2A). Although paradoxically the LDV/SOF and PrOD regimens without ribavirin seemed to have slightly higher SVR rates than the regimens with ribavirin, this can be explained by the higher prevalence of adverse predictors in the combination regimens and by the fact that almost all patients treated with PrOD monotherapy had genotype 1b infection, as shown in Supplementary Table 2. Genotype 1b patients had slightly higher SVR than genotype 1a patients treated with PrOD+ribavirin regimens (94.2% vs 91.7%), but there was almost no difference between genotype 1a and 1b for LDV/SOF regimens (Supplementary Table 2).
Among genotype 3–infected patients, the best SVR was achieved in those treated with SOF+PEG+RIBA (SVR, 86.5%; 95% CI, 79.2%–91.5%), followed by LDV/SOF and ribavirin (SVR, 79.5%; 95% CI, 74.6%–83.7%) and last SOF plus ribavirin (SVR, 70.1%; 95% CI, 66.2%–73.7%), even though SOF plus ribavirin is a 24-week regimen.
Utilization and Sustained Virologic Response Rates of 8-Week Ledipasvir/Sofosbuvir Regimens
VA guidelines recommended that treatment-naïve, non-cirrhotic, genotype 1–infected patients with a viral load <6 million IU/mL can be treated with LDV/SOF monotherapy for only 8 weeks, rather than 12 weeks. However, this regimen is based on a post-hoc analysis of the ION-3 study,3 is not FDA-approved, and it is unclear if it is widely utilized. We found that of 8140 patients who received LDV/SOF monotherapy, 2219 (27.3%) received only 8 weeks of treatment and had an overall SVR of 94.3% (Table 2 and Figure 1). However, of 4066 treatment-naïve, non-cirrhotic patients with a viral load <6 million IU/mL who received LDV/SOF monotherapy, only a minority (n = 1975 [48.6%]) received 8 weeks of treatment and achieved an SVR of 95.1% (95% CI, 94.0%–96.0%), and 1556 (38%) received 12 weeks of treatment and achieved a very similar SVR of 95.8% (95% CI, 94.7%–96.8%; P = .6).
Utilization and Sustained Virologic Response Rates of 24-Week Ledipasvir/Sofosbuvir and Paritaprevir/Ritonavir/Ombitasvir Regimens
Although 24-week LDV/SOF or PrOD regimens are FDA-approved and American Association for the Study of Liver Diseases/Infectious Diseases Society of America–recommended32 for cirrhotic patients (PrOD, genotype 1) or for treatment-experienced cirrhotic patients (LDV/SOF, genotype 1), they were rarely used in practice. Among all genotype 1–infected patients, only 1.8% of PrOD+ribavirin regimens, 9.5% of LDV/SOF regimens, and 5.0% of LDV/ SOF+ribavirin regimens extended to 24 weeks (Table 3), and there was little difference in SVR between 12-week and 24-week regimens overall (Table 3 and Figure 1). Limiting to the specific subpopulations for which 24-week regimens are recommended, PrOD+ribavirin regimens extended to 24 weeks only in 5.9% of cirrhotic patients, which was too small a number to allow robust estimates of SVR; however, 12 weeks of PrOD+ribavirin resulted in very high SVR rates in both treatment-naïve (97.4%) and treatment-experienced (98.5%) cirrhotic patients (Table 3), leaving little room for further improvement in SVR by extending to 24 weeks. Among cirrhotic, treatment-experienced, genotype 1–infected patients, LDV/SOF regimens extended to 24 weeks in 58% of patients (SVR 94.1% for 24 weeks and 94.2% for 12 weeks), and LDV/SOF+ribavirin regimens in 11.5% of cases (SVR 95.8% for 24 weeks and 89.2% for 12 weeks) (Table 3).
Table 3.
Sustained Virologic Response Rates in Genotype 1–Infected Patients by Duration of Treatment, Cirrhosis, and Prior Treatment
| LDV/SOF
|
LDV/SOF+RIBA
|
PrOD
|
PrOD+RIBA
|
|||||
|---|---|---|---|---|---|---|---|---|
| n | SVR, % (95% CI) | n | SVR, % (95% CI) | n | SVR, % (95% CI) | n | SVR, % (95% CI) | |
| Treatment-naïve | ||||||||
| No cirrhosis | ||||||||
| All durations | 4485 | 93.4 (92.6–94.0) | 522 | 96.7 (94.8–98.0) | 519 | 95.8 (93.6–97.2) | 1135 | 91.6 (89.9–93.1) |
| 12 wk | 2101 | 95.6 (94.7–96.4) | 404 | 98.5 (96.7–99.3) | 448 | 97.8 (95.9–98.8) | 930 | 95.8 (94.3–96.9) |
| 24 wk | NR | NR | NR | NR | NR | NR | NR | NR |
| Cirrhosis | ||||||||
| All durations | 1131 | 90.1 (88.2–91.7) | 579 | 89.5 (86.7–91.7) | 34 | 97.1 (80.2–99.6) | 445 | 93.0 (90.3–95.1) |
| 12 wk | 798 | 92.0 (89.9–93.7) | 468 | 91.2 (88.3–93.5) | 23 | 100 | 350 | 97.4 (95.1–98.7) |
| 24 wk | 141 | 92.2 (86.4–95.7) | 22 | 95.5 (70.4–99.5) | NR | NR | NAa | NAa |
| Treatment-experienced | ||||||||
| No cirrhosis | ||||||||
| All durations | 1237 | 94.1 (92.6–95.3) | 538 | 94.4 (92.1–96.1) | 138 | 91.3 (85.2–95.0) | 373 | 93.6 (90.6–95.7) |
| 12 wk | 806 | 96.7 (95.2–97.7) | 424 | 95.0 (92.5–96.8) | 114 | 99.1 (93.9–99.9) | 298 | 95.6 (92.6–97.5) |
| 24 wk | 147 | 96.6 (92.0–98.6) | NR | NR | NR | NR | NR | NR |
| Cirrhosis | ||||||||
| All durations | 559 | 91.2 (88.6–93.3) | 861 | 89.4 (87.2–91.3) | 13 | 92.3 (53.1–99.2) | 175 | 94.3 (89.6–96.9) |
| 12 wk | 127 | 94.5 (88.8–97.4) | 668 | 89.4 (86.8–91.5) | NA | NAa | 132 | 98.5 (94.0–99.6) |
| 24 wk | 332 | 93.7 (90.5–95.8) | 85 | 94.1 (86.4–97.6) | NR | NR | NA | NAa |
NA, not available; NR, not recommended for the specific subpopulation.
Regimens with <20 patients.
Sustained Virologic Response Rates in Patients With Cirrhosis
Patients with a diagnosis of cirrhosis had lower SVR (86.8%) than patients without a diagnosis of cirrhosis (SVR 92.3%) (Table 2). The gap in SVR between cirrhotics and non-cirrhotics was much smaller among genotype 1 (90.6% vs 93.6% or 3% difference) than genotype 2 (77.3% vs 89.1% or 11.8% difference) or genotype 3 (65.7% vs 81.6% or 15.6% difference) infected patients (Figure 2B, Table 2 and Supplementary Table 3). Similar findings were observed when comparing patients with FIB-4 >3.25 vs ≤3.25. Consequently, among cirrhotic patients, there were large differences in SVR between genotype 1 (90.6%; 95% CI, 89.7%–91.5%), genotype 2 (77.3%; 95% CI, 73.3%–80.9%), and genotype 3 (65.7%; 95% CI, 61.2%–69.8%) infected patients. These findings demonstrate the high effectiveness of LDV/SOF and PrOD regimens in cirrhotic, genotype 1–infected patients and the relatively poor effectiveness of SOF regimens in genotype 2 and LDV/SOF and SOF regimens in genotype 3–infected cirrhotic patients.
Among genotype 1–infected cirrhotic patients, there was little difference in SVR between LDV/SOF±ribavirin and PrOD±ribavirin regimens (Figure 2C, Table 2). However, among genotype 3–infected cirrhotic patients, there were great differences in SVR among SOF+PEG+RIBA (81.4%), LDV/SOF+RIBA (65.3%), and SOF+RIBA (61.9%).
Sustained Virologic Response Rates in Treatment-Experienced vs Treatment-Naïve Patients
There was almost no difference in SVR between treatment-experienced (92.6%; 95% CI, 91.7%–93.3%) and treatment-naive (92.8%; 95% CI, 92.2%–93.3%) patients with genotype 1 infection, whereas this difference was more pronounced in genotype 2 (80.2% vs 88%) and genotype 3 patients (69.2% vs 77.5%) (Figure 2B, Table 2, and Supplementary Table 3). Among treatment-experienced patients, there were large differences in SVR between genotype 1 (92.6%; 95% CI, 91.7%–93.3%), genotype 2 (80.2%; 95% CI, 76.2%–83.6%), and genotype 3 (69.2%; 95% CI, 64.2%–73.9%) infected patients.
Among genotype 1-infected, treatment-experienced patients there was little difference in SVR between LDV/ SOF±ribavirin and PrOD±ribavirin regimens (Figure 2D, Table 2). Among genotype 3–infected treatment-experienced patients, SVR was especially low in SOF+RIBA-treated patients (61.1%) compared with PEG+SOF+RIBA (83.6%) and LDV/SOF+RIBA (77.4%).
Among genotype 1–infected, treatment-experienced patients, SVR rates were >90% for patients previously treated with interferon (92.8%), boceprevir (94.7%), telaprevir (90.1%), or PrOD (96.8%), but they were <90% for patients previously treated with SOF (88.7%), simeprevir+SOF (87.0%), or LDV/SOF (87.7%) (Supplementary Table 4).
Independent Predictors of Sustained Virologic Response
Among all patients, the following characteristics were independent predictors of failure to achieve SVR in multivariable models: male sex, black race, Hispanic ethnicity, genotype 2 or 3 HCV, cirrhosis, diabetes, low platelet count, low serum albumin level, and elevated serum bilirubin level (Table 4). Notable characteristics that were not associated with SVR included age, baseline HCV viral load, and history of alcohol use disorders. Treatment experience was associated with reduced likelihood of SVR only among genotype 2– and 3–infected patients, but not among genotype 1–infected patients. Also, cirrhosis was more strongly associated with reduced likelihood of SVR in genotypes 2 and 3 than in genotype 1.
Table 4.
Predictors of Sustained Virologic Response by Genotypea in Multivariable Logistic Regression Models
| All patients
|
Genotype 1
|
Genotype 2
|
Genotype 3
|
|||||
|---|---|---|---|---|---|---|---|---|
| AORb | P value | AORb | P value | AORb | P value | AORb | P value | |
| Age | ||||||||
| <55 y | 1 | 1 | 1 | 1 | ||||
| 55 to <60 y | 0.88 | .2 | 0.87 | .3 | 1.37 | .2 | 0.58 | .01 |
| 60 to <65 y | 0.95 | .6 | 0.84 | .2 | 1.61 | .05 | 0.73 | .2 |
| 65 to <70 y | 0.95 | .6 | 0.86 | .3 | 1.20 | .5 | 1.12 | .7 |
| 70 to <75 y | 0.91 | .6 | 0.86 | .5 | 1.41 | .4 | 0.81 | .7 |
| ≥75 y | 1.62 | .2 | 1.22 | .7 | 3.04 | .09 | NA | |
| Race/ethnicity | ||||||||
| White, non-Hispanic | 1 | 1 | 1 | 1 | ||||
| Black, non-Hispanic | 0.81 | .004 | 0.83 | .02 | 0.49 | .001 | 0.76 | .5 |
| Hispanic | 0.79 | .05 | 0.72 | .04 | 1.14 | .7 | 0.80 | .4 |
| Asian, Pacific Islander, American Indian | 0.93 | .7 | 0.84 | .5 | 0.67 | .4 | 1.77 | .3 |
| Declined to answer, missing | 0.92 | .4 | 0.76 | .01 | 1.42 | .1 | 1.31 | .3 |
| Sex | ||||||||
| Female | 1 | 1 | 1 | 1 | ||||
| Male | 0.58 | .01 | 0.55 | .02 | 0.42 | .1 | 0.98 | .97 |
| Alcohol use disorder | ||||||||
| No | 1 | 1 | 1 | 1 | ||||
| Yes | 0.93 | .2 | 0.91 | .2 | 1.0 | 1.0 | 0.98 | .9 |
| Diabetes | ||||||||
| No | 1 | 1 | 1 | 1 | ||||
| Yes | 0.81 | .001 | 0.89 | .1 | 0.69 | .01 | 0.66 | .01 |
| Regimenc | ||||||||
| LDV/SOF | NA | NA | 1 | NA | NA | NA | NA | |
| LDV/SOF+ribavirin | NA | NA | 1.51 | .001 | NA | NA | 1 | |
| PrOD | NA | NA | 0.63 | .3 | NA | NA | NA | NA |
| PrOD+ribavirin | NA | NA | 1.04 | .9 | NA | NA | NA | NA |
| SOF+ribavirin | NA | NA | NA | NA | NA | NA | 0.78 | .04 |
| PEG+SOF+ribavirin | NA | NA | NA | NA | NA | NA | 2.65 | .001 |
| Genotype | ||||||||
| 1 | 1 | NA | NA | NA | NA | NA | NA | |
| 2 | 0.43 | <.001 | NA | NA | NA | NA | NA | NA |
| 3 | 0.23 | <.001 | NA | NA | NA | NA | NA | NA |
| 4 | 0.59 | .08 | NA | NA | NA | NA | NA | NA |
| Subgenotype | ||||||||
| a | NA | 1 | 1 | 1 | ||||
| b | NA | NA | 1.33 | .001 | 0.82 | .7 | NA | NA |
| None | NA | NA | 1.42 | .006 | 0.65 | .4 | NA | NA |
| HCV RNA viral load | ||||||||
| ≤6 million IU/mL | 1 | 1 | 1 | 1 | ||||
| >6 million IU/mL | 0.92 | .3 | 0.83 | .04 | 1.53 | .02 | 0.83 | .4 |
| Cirrhosis | ||||||||
| No | 1 | 1 | 1 | 1 | ||||
| Yes | 0.80 | .002 | 0.88 | .1 | 0.62 | .007 | 0.67 | .03 |
| Prior treatment | ||||||||
| Treatment-naïve | 1 | 1 | 1 | 1 | ||||
| Treatment-experienced | 0.92 | .2 | 1.02 | .8 | 0.59 | .001 | 0.69 | .02 |
| Platelet count | ||||||||
| ≥100 k/μL | 1 | 1 | 1 | 1 | ||||
| <100 k/μL | 0.74 | <.001 | 0.81 | .06 | 0.46 | <.001 | 0.84 | .4 |
| Serum bilirubin | ||||||||
| ≤1.1 g/dL | 1 | 1 | 1 | 1 | ||||
| >1.1 g/dL | 0.81 | .01 | 0.86 | .06 | 0.83 | .3 | 0.78 | .2 |
| Serum albumin | ||||||||
| ≥3.6 g/dL | 1 | 1 | 1 | 1 | ||||
| <3.6 g/dL | 0.81 | .003 | 0.79 | .007 | 1.13 | .5 | 0.60 | .007 |
NA, not available.
Genotype 4–infected patients were not modeled separately as there were too few for robust multivariable models.
AOR, adjusted odds ratio, by multivariable logistic regression modeling including the following variables: age, sex, race/ ethnicity, history of alcohol use disorders, HCV genotype and subgenotype, HCV regimen, baseline HCV viral load, diabetes, treatment naïve/experienced, cirrhosis, decompensated cirrhosis, HCC, liver transplantation, platelet count, serum bilirubin and albumin levels.
The effect of regimen on SVR was estimated using augmented inverse-probability-weighted logistic regression to account for the propensity of receiving each regimen.
We employed augmented inverse-probability-weighted methods using propensity scores specifically to look at the association between regimen and SVR among genotype 1– or 3–infected patients. Among genotype 1–infected patients, there was no significant difference between LDV/ SOF±ribavirin regimens and PrOD±ribavirin regimens (Table 4). Addition of ribavirin to LDV/SOF, which was much more common in cirrhotic and treatment-experienced patients, was associated with a significantly higher likelihood of SVR (adjusted odds ratio, 1.51; P = .001), suggesting that ribavirin was appropriately used more commonly in patients with cirrhosis and treatment experience. Among genotype 3–infected patients, PEG+SOF+ribavirin was significantly better, while SOF+ribavirin was significantly worse than LDV/SOF+ribavirin.
Impact of Missing Sustained Virologic Response Data and Imputation for Missing Sustained Virologic Response
SVR data were missing in 1603 of the 17,487 patients who received antiviral treatment (9%). It is possible that patients lacking data on SVR were more likely to have been lost follow-up or to discontinue therapy early or to have other predictors of poor response, which would mean that the observed SVR rates we report in Tables 2 and 3 and Figures 1B and 2 are overestimates. However, patients with vs without SVR data had very similar characteristics with respect to race/ethnicity, age, HCV genotype, cirrhosis, decompensated cirrhosis, and most other baseline characteristics (Supplementary Table 5). Patients with missing SVR did indeed have a higher rate of early treatment discontinuation at <8 weeks compared with those with available SVR data (25% vs 4.4%). However, the majority (75%) completed 8 or more weeks of treatment and the mean duration of treatment was 71 ± 38 days compared with 87 ± 31 days in patients with available SVR data. The majority of patients without SVR data were not patients who dropped out of treatment, but rather patients who simply had not yet had their follow-up HCV viral load performed in the relatively short follow-up period of our study.
When multiple imputation was used to derive missing SVR values using baseline characteristics as well as duration of treatment, the results that included imputed and observed SVR were only slightly lower than those of observed SVR (Table 5), again suggesting that it is unlikely that our results of observed SVR are biased substantially toward overestimation due to the missing SVR data. Finally, we calculated SVR rates assuming that all patients with missing SVR data did not achieve SVR, a highly unlikely worst-case scenario (Table 5).
Discussion
LDV/SOF, PrOD, and SOF-based antiviral regimens resulted in remarkably high SVR rates in the VA national health care system, approaching the rates reported in clinical trials. This is in contrast to previous interferon-based regimens, which consistently resulted in much lower SVR rates in real-world clinical practice than in clinical trials.12-17 SVR rates were higher in genotype 1– (SVR 92.8%) and genotype 4–infected patients (SVR 89.6%) than genotype 2– (SVR 86.2%) or 3–infected patients (SVR 74.8%), and these differences were even greater among cirrhotic and treatment-experienced patients. Among genotype 1–infected patients, there was no significant difference in SVR rates between LDV/SOF and PrOD regimens in either unadjusted or multivariable, propensity-score-adjusted analyses, and SVR rates >90% were achieved even in subgroups such as treatment-experienced or cirrhotic patients. The short, 8-week LDV/SOF monotherapy regimen resulted in excellent SVR rate (94.3%), but was used in only 48.6% of genotype 1–infected patients eligible for 8-week therapy (ie, treatment-naïve patients with viral load <6 million IU/mL, without cirrhosis). Long, 24-week regimens did not result in higher SVR rates and were rarely used, despite being FDA-approved and American Association for the Study of Liver Diseases/Infectious Diseases Society of America–recommended32 for certain genotype 1 patients with cirrhosis.
Among a total of 17,487 patients, our study included 5250 patients with a diagnosis of cirrhosis and 5960 with a FIB-4 score >3.25 (which is highly suggestive of cirrhosis), who achieved surprisingly high overall SVR rates of 86.8% and 87.4%, respectively. These high SVR rates were driven by genotype 1–infected cirrhotic patients who had much higher SVR (90.6%; 95% CI, 89.7%–91.5%) than genotype 2 (77.3%; 95% CI 73.3%–80.9%) or genotype 3 (65.7%; 95% CI, 61.2%–69.8%). To our knowledge, this is the largest study of DAAs in cirrhotic patients and the SVR rates in genotype 1–infected patients are the highest reported in real-world clinical practice. LDV/SOF, PrOD, and SOF regimens have allowed patients with cirrhosis to be cured of HCV in substantial numbers and proportions for the first time ever. Longer follow-up of these patients is necessary to determine whether patients with cirrhosis who achieve SVR by DAAs are protected from developing progressive liver dysfunction, liver failure, or HCC and, whether they are capable of liver remodeling and regression of cirrhosis.
American Association for the Study of Liver Diseases/ Infectious Diseases Society of America guidelines during the time period of our study,32 as well as the LDV/SOF package insert,33 recommend that LDV/SOF regimens should extend for 12 or 24 weeks, with the single exception of a short, 8-week LDV/SOF monotherapy regimen that “can be considered,”33 “with caution and at the discretion of the practitioner”32 in treatment-naïve, genotype 1–infected patients without cirrhosis with an HCV viral load <6 million IU/mL. This is based on a post-hoc analysis of the ION-3 clinical trial showing higher relapse rates in those treated for 8 weeks who had a viral load ≥6 million (9 of 92 [10%]) compared with those with a viral load <6 million IU/mL (2 of 123 [2%]).3 VA treatment guidelines explicitly recommended 8 weeks of treatment for this subgroup of patients.34 Indeed, our study confirmed that 8 weeks of LDV/SOF monotherapy had similarly high SVR rates (94.8%) as 12 weeks (95.3%) in this favorable subgroup. However, our results also showed that treatment was unnecessarily extended beyond 8 weeks in 1833 of 4066 patients in this subgroup, dramatically increasing the cost of treatment without increasing SVR. Our results should offer reassurance to treatment providers that 8 weeks of LDV/SOF monotherapy is sufficient duration in this subgroup.
VA treatment guidelines during the study period designated PrOD as the preferred regimen in genotype 1–infected patients except for prior null responders, those previously treated with protease inhibitors, and patients with Child’s B or C cirrhosis (in whom the preferred regimen was LDV/SOF and ribavirin for 12 weeks) and except for treatment naïve, non-cirrhotics with a viral load <6 million (in whom 8-week LDV/SOF and 12-week PrOD regimens were equally preferred). This was due to the lower cost of 12 weeks of PrOD ($22,850) compared with 12 weeks of LDV/SOF ($37,157) in the VA system during the study period and the absence of evidence that one is more effective than the other in the subgroups for which PrOD was preferred. Our data support the VA treatment recommendations because we found no difference in SVR between PrOD and LDV/SOF regimens in either adjusted or unadjusted analyses, in the entire population or in clinically relevant subgroups (cirrhosis or not, treatment-experienced or naïve). Despite these recommendations and the higher cost, LDV/SOF regimens constituted 77% and PrOD only 23% of regimens in genotype-1–infected patients. This could be due to higher prevalence of drug–drug interactions, higher pill burden, and more frequent requirement for co-prescription of ribavirin in PrOD regimens compared with LDV/SOF regimens. After the end of the study period, and after FDA approval of elbasvir/ grazoprevir as an additional regimen for genotype 1 HCV on January 28, 2016, regimen costs in the VA were further reduced dramatically, to approximately $17,000 per 12-week course for LDV/SOF, PrOD, and elbasvir/grazoprevir and treatment recommendations changed to “equally recommend” all 3 agents as of March 2016.
Genotype 3–infected patients had the lowest SVR rates in our study, just as in clinical trials. We found that the non-FDA–approved regimen of LDV/SOF and ribavirin had a higher SVR rate (77.9%; 95% CI, 73.1%–82.0%) than the longer and more expensive FDA-approved regimen of SOF and ribavirin for 24 weeks (70.6%; 95% CI, 66.9%–74.1%). However, the highest SVR rate in genotype 3–infected patients was observed in the regimen that included PEG together with SOF and ribavirin (87.0%; 95% CI, 80.0%–91.8%), the only interferon-containing regimen that is still recommended.32
Few large real-world studies of interferon-free regimens are currently available for comparison with ours. The HCV-TARGET, a prospective cohort study of patients undergoing HCV treatment in routine clinical care in academic centers, reported SVR rate to SOF and simeprevir in genotype 1–infected patients of 88% among 151 transplant recipients and 84% among 836 non-transplant recipients.35,36 This regimen has been superseded by LDV/ SOF and PrOD-based regimens. Among 487 patients with decompensated cirrhosis treated in the United Kingdom under an Expanded Access Programme with SOF, LDV/ SOF, or daclatasvir, SVR was achieved in 90.5% of genotype 1– and 68.8% of genotype 3–infected patients37—very similar to our findings. A smaller VA study looked at only treatment-naïve, genotype 1–infected patients treated with LDV/SOF and reported SVR rates almost identical to ours among this subgroup.38 The TRIO Network, which compiles data from participating “real-world” academic and community HCV treatment clinics in the United States, reported in an abstract an SVR rate of 94% among 1521 genotype 1–infected patients treated with LDV/SOF monotherapy.39
The main limitation of our study was that SVR data were unavailable in 9% of patients, which can lead to overestimated SVR rates among those with available SVR data. We think this is unlikely for 2 reasons. First, patients with missing SVR data were similar to those with available SVR data (Supplementary Table 2). Although early discontinuation of treatment in <8 weeks was more common in patients with missing SVR data (25% vs 4.4%), the majority of patients with missing SVR completed 8 or more weeks of treatment, demonstrating that patients with missing SVR data were not patients who “dropped out” of treatment or were “lost to follow-up,” but rather patients (or physicians) who were simply delinquent in getting their SVR viral load measured after the end of their treatment—not an uncommon phenomenon outside of clinical trials. Second, we used comprehensive multiple imputation models that included duration of treatment in addition to baseline, pretreatment characteristics to impute the missing SVR data and found only a non-substantial reduction in SVR after imputation (Table 5), suggesting that it is unlikely that our results of observed SVR are biased toward overestimation due to the missing SVR data. Important strengths of the study include the complete ascertainment of filled pharmacy prescriptions and the utilization of complete electronic medical records since 1999 from a national health care system that treats the greatest number of HCV-infected patients in the United States.
Our results demonstrate that LDV/SOF, PrOD, and SOF regimens can achieve remarkably high SVR rates in real-world clinical practice, especially in genotype 1–infected patients. The main obstacle to curing HCV infection in the maximum possible number of patients is currently the cost of HCV antiviral regimens. It is expected that cost will decline dramatically as more antiviral regimens become FDA-approved, resulting in competition between manufacturers. In fact, costs decreased dramatically within the VA after the completion of our study and after the FDA approval of elbasvir/grazeprevir in January 2016. The VA health care system has budgeted $1.5 billion nationally for antiviral medications for fiscal year 2016, while every health care organization in the United States is faced with similar budgetary constraints due to the cost of antiviral medications. We hope that our results will be used to determine the most cost-effective ways to treat HCV-infected patients and to reassure patients, clinicians, and health care systems that current treatments for HCV, though costly, appear to be effective in the real-world setting.
Supplementary Material
Acknowledgments
Funding This study was funded by Merit Review grants (I01CX000320 and I01CX001156), Clinical Science Research and Development, Office of Research and Development, Veterans Affairs (to George N. Ioannou). The contents do not represent the views of the US Department of Veterans Affairs or the US Government.
Abbreviations
- CI
confidence interval
- DAA
direct antiviral agent
- FDA
US Food and Drug Administration
- FIB-4
Fibrosis-4 Index
- HCC
hepatocellular carcinoma
- HCV
hepatitis C virus
- ICD-9
International Classification of Diseases, 9th revision
- LDV
ledipasvir
- PEG
pegylated interferon
- PrOD
paritaprevir/ritonavir/ombitasvir and dasabuvir
- RIBA
ribavirin
- SOF
sofosbuvir
- SVR
sustained virologic response
- VA
Veterans Affairs
Footnotes
Author contributions: George Ioannou: Study concept and design, acquisition of data, statistical analysis and interpretation of data, drafting of the manuscript, critical revision of the manuscript, obtained funding. Pamela Green: Analysis of data. Elliott Lowy: Analysis of data. Kristin Berry: Study design and analysis of data. Feng Su: Study design and critical revision of the manuscript. Michael F. Chang: Study design and critical revision of the manuscript. Judith Tsui: Study design and critical revision of the manuscript. Lauren Beste: Study design and critical revision of the manuscript. George Ioannou is the guarantor of this paper. All authors approved the final version of the manuscript.
Conflicts of interest
The authors disclose no conflicts.
Supplementary Material
Note: To access the supplementary material accompanying this article, visit the online version of Gastroenterology at www.gastrojournal.org, and at http://dx.doi.org/10.1053/j.gastro.2016.05.049.
References
- 1.Andreone P, Colombo MG, Enejosa JV, et al. ABT-450, ritonavir, ombitasvir, and dasabuvir achieves 97% and 100% sustained virologic response with or without ribavirin in treatment-experienced patients with HCV genotype 1b infection. Gastroenterology. 2014;147:359–365 e1. doi: 10.1053/j.gastro.2014.04.045. [DOI] [PubMed] [Google Scholar]
- 2.Ferenci P, Bernstein D, Lalezari J, et al. ABT-450/r-ombitasvir and dasabuvir with or without ribavirin for HCV. N Engl J Med. 2014;370:1983–1992. doi: 10.1056/NEJMoa1402338. [DOI] [PubMed] [Google Scholar]
- 3.Kowdley KV, Gordon SC, Reddy KR, et al. Ledipasvir and sofosbuvir for 8 or 12 weeks for chronic HCV without cirrhosis. N Engl J Med. 2014;370:1879–1888. doi: 10.1056/NEJMoa1402355. [DOI] [PubMed] [Google Scholar]
- 4.Poordad F, Hezode C, Trinh R, et al. ABT-450/r-ombitasvir and dasabuvir with ribavirin for hepatitis C with cirrhosis. N Engl J Med. 2014;370:1973–1982. doi: 10.1056/NEJMoa1402869. [DOI] [PubMed] [Google Scholar]
- 5.Zeuzem S, Jacobson IM, Baykal T, et al. Retreatment of HCV with ABT-450/r-ombitasvir and dasabuvir with ribavirin. N Engl J Med. 2014;370:1604–1614. doi: 10.1056/NEJMoa1401561. [DOI] [PubMed] [Google Scholar]
- 6.Afdhal N, Reddy KR, Nelson DR, et al. Ledipasvir and sofosbuvir for previously treated HCV genotype 1 infection. N Engl J Med. 2014;370:1483–1493. doi: 10.1056/NEJMoa1316366. [DOI] [PubMed] [Google Scholar]
- 7.Afdhal N, Zeuzem S, Kwo P, et al. Ledipasvir and sofosbuvir for untreated HCV genotype 1 infection. N Engl J Med. 2014;370:1889–1898. doi: 10.1056/NEJMoa1402454. [DOI] [PubMed] [Google Scholar]
- 8.Feld JJ, Kowdley KV, Coakley E, et al. Treatment of HCV with ABT-450/r-ombitasvir and dasabuvir with ribavirin. N Engl J Med. 2014;370:1594–1603. doi: 10.1056/NEJMoa1315722. [DOI] [PubMed] [Google Scholar]
- 9.Naggie S, Cooper C, Saag M, et al. Ledipasvir and Sofosbuvir for HCV in Patients Coinfected with HIV-1. N Engl J Med. 2015;373:705–713. doi: 10.1056/NEJMoa1501315. [DOI] [PMC free article] [PubMed] [Google Scholar]
- 10.Charlton M, Everson GT, Flamm SL, et al. Ledipasvir and sofosbuvir plus ribavirin for treatment of HCV infection in patients with advanced liver disease. Gastroenterology. 2015;149:649–659. doi: 10.1053/j.gastro.2015.05.010. [DOI] [PubMed] [Google Scholar]
- 11.Gane EJ, Hyland RH, An D, et al. Efficacy of ledipasvir and sofosbuvir, with or without ribavirin, for 12 weeks in patients with HCV genotype 3 or 6 infection. Gastroenterology. 2015;149:1454–1461 e1. doi: 10.1053/j.gastro.2015.07.063. [DOI] [PubMed] [Google Scholar]
- 12.Beste LA, Green PK, Ioannou GN. Boceprevir and telaprevir-based regimens for the treatment of hepatitis C virus in HIV/HCV coinfected patients. Eur J Gastroenterol Hepatol. 2015;27:123–129. doi: 10.1097/MEG.0000000000000241. [DOI] [PubMed] [Google Scholar]
- 13.Ioannou GN, Beste LA, Green PK. Similar effectiveness of boceprevir and telaprevir treatment regimens for hepatitis C virus infection on the basis of a nationwide study of veterans. Clin Gastroenterol Hepatol. 2014;12:1371–1380. doi: 10.1016/j.cgh.2013.12.011. [DOI] [PubMed] [Google Scholar]
- 14.Backus LI, Boothroyd DB, Phillips BR, et al. Predictors of response of US veterans to treatment for the hepatitis C virus. Hepatology. 2007;46:37–47. doi: 10.1002/hep.21662. [DOI] [PubMed] [Google Scholar]
- 15.Beste LA, Ioannou GN. Prevalence and treatment of chronic hepatitis C Virus infection in the US Department of Veterans Affairs. Epidemiol Rev. 2015;37:131–143. doi: 10.1093/epirev/mxu002. [DOI] [PubMed] [Google Scholar]
- 16.Ioannou GN, Scott JD, Yang Y, et al. Rates and predictors of response to anti-viral treatment for hepatitis C virus in HIV/HCV co-infection in a nationwide study of 619 patients. Aliment Pharmacol Ther. 2013;38:1373–1384. doi: 10.1111/apt.12524. [DOI] [PubMed] [Google Scholar]
- 17.Sterling RK, Kuo A, Rustgi VK, et al. Virological outcomes and treatment algorithms utilisation in observational study of patients with chronic hepatitis C treated with boceprevir or telaprevir. Aliment Pharmacol Ther. 2015;41:671–685. doi: 10.1111/apt.13095. [DOI] [PMC free article] [PubMed] [Google Scholar]
- 18.US Department of Veterans Affairs. [February 10, 2016];Health services research and development. http://www.hsrd.research.va.gov/for_researchers/vinci/cdw.cfm.
- 19.Kramer JR, Giordano TP, Souchek J, et al. The effect of HIV coinfection on the risk of cirrhosis and hepatocellular carcinoma in US veterans with hepatitis C. Am J Gastroenterol. 2005;100:56–63. doi: 10.1111/j.1572-0241.2005.40670.x. [DOI] [PubMed] [Google Scholar]
- 20.Ioannou GN, Splan MF, Weiss NS, et al. Incidence and predictors of hepatocellular carcinoma in patients with cirrhosis. Clin Gastroenterol Hepatol. 2007;5:938–945. doi: 10.1016/j.cgh.2007.02.039. [DOI] [PubMed] [Google Scholar]
- 21.Davila JA, Henderson L, Kramer JR, et al. Utilization of surveillance for hepatocellular carcinoma among hepatitis C virus-infected veterans in the United States. Ann Intern Med. 2011;154:85–93. doi: 10.7326/0003-4819-154-2-201101180-00006. [DOI] [PubMed] [Google Scholar]
- 22.Ioannou GN, Bryson CL, Weiss NS, et al. The prevalence of cirrhosis and hepatocellular carcinoma in patients with human immunodeficiency virus infection. Hepatology. 2013;57:249–257. doi: 10.1002/hep.25800. [DOI] [PubMed] [Google Scholar]
- 23.Kramer JR, Davila JA, Miller ED, et al. The validity of viral hepatitis and chronic liver disease diagnoses in Veterans Affairs administrative databases. Aliment Pharmacol Ther. 2008;27:274–282. doi: 10.1111/j.1365-2036.2007.03572.x. [DOI] [PubMed] [Google Scholar]
- 24.Beste LA, Leipertz SL, Green PK, et al. Trends in burden of cirrhosis and hepatocellular carcinoma by underlying liver disease in US Veterans 2001–2013. Gastroenterology. 2015;149:1471–1482 e5. doi: 10.1053/j.gastro.2015.07.056. [DOI] [PubMed] [Google Scholar]
- 25.Kramer JR, Kanwal F, Richardson P, et al. Importance of patient, provider, and facility predictors of hepatitis C virus treatment in veterans: a national study. Am J Gastroenterol. 2011;106:483–491. doi: 10.1038/ajg.2010.430. [DOI] [PubMed] [Google Scholar]
- 26.Beste LA, Ioannou GN, Larson MS, et al. Predictors of early treatment discontinuation among patients with genotype 1 hepatitis C and implications for viral eradication. Clin Gastroenterol Hepatol. 2010;8:972–978. doi: 10.1016/j.cgh.2010.07.012. [DOI] [PubMed] [Google Scholar]
- 27.Kanwal F, Hoang T, Kramer JR, et al. Increasing prevalence of HCC and cirrhosis in patients with chronic hepatitis C virus infection. Gastroenterology. 2011;140:1182–1188 e1. doi: 10.1053/j.gastro.2010.12.032. [DOI] [PMC free article] [PubMed] [Google Scholar]
- 28.Miller DR, Safford MM, Pogach LM. Who has diabetes? Best estimates of diabetes prevalence in the Department of Veterans Affairs based on computerized patient data. Diabetes Care. 2004;27(Suppl 2):B10–B21. doi: 10.2337/diacare.27.suppl_2.b10. [DOI] [PubMed] [Google Scholar]
- 29.Vallet-Pichard A, Mallet V, Nalpas B, et al. FIB-4: an inexpensive and accurate marker of fibrosis in HCV infection. comparison with liver biopsy and fibrotest. Hepatology. 2007;46:32–36. doi: 10.1002/hep.21669. [DOI] [PubMed] [Google Scholar]
- 30.Yoshida EM, Sulkowski MS, Gane EJ, et al. Concordance of sustained virological response 4, 12, and 24 weeks post-treatment with sofosbuvir-containing regimens for hepatitis C virus. Hepatology. 2015;61:41–45. doi: 10.1002/hep.27366. [DOI] [PubMed] [Google Scholar]
- 31.McCaffrey DF, Griffin BA, Almirall D, et al. A tutorial on propensity score estimation for multiple treatments using generalized boosted models. Stat Med. 2013;32:3388–3414. doi: 10.1002/sim.5753. [DOI] [PMC free article] [PubMed] [Google Scholar]
- 32.HCV Guidance: recommendations for testing, managing, and treating hepatitis C. [January 25, 2016];AASLD and IDSA. Available at: http://www.hcvguidelines.org.
- 33. [January 26, 2016];Harvoni Package Insert. Available at: https://www.gilead.com/~/media/Files/pdfs/medicines/liver-disease/harvoni/harvoni_pi.pdf.
- 34. [January 26, 2016];Chronic hepatitis C virus (HCV) infection: treatment considerations from the Department of Veterans Affairs National Hepatitis C Resource Center Program and National Viral Hepatitis Program. Available at: http://www.hepatitis.va.gov/provider/index.asp.
- 35.Brown RS, Jr, O’Leary JG, Reddy KR, et al. Interferon-free therapy for genotype 1 hepatitis C in liver transplant recipients: real-world experience from the hepatitis C therapeutic registry and research network. Liver Transpl. 2016;22:24–33. doi: 10.1002/lt.24366. [DOI] [PMC free article] [PubMed] [Google Scholar]
- 36.Sulkowski MS, Vargas HE, Di Bisceglie AM, et al. Effectiveness of simeprevir plus sofosbuvir, with or without ribavirin, in real-world patients with HCV genotype 1 infection. Gastroenterology. 2016;150:419–429. doi: 10.1053/j.gastro.2015.10.013. [DOI] [PMC free article] [PubMed] [Google Scholar]
- 37.Foster GR, Irving WL, Cheung MC, et al. Cohort study of the impact of direct acting antiviral therapy in patients with chronic hepatitis C and decompensated cirrhosis. J Hepatol. 2016;64:1224–1231. doi: 10.1016/j.jhep.2016.01.029. [DOI] [PubMed] [Google Scholar]
- 38.Backus LI, Belperio PS, Shahoumian TA, et al. Real world effectiveness of ledipasvir/sofosbuvir in 4365 treatmentnaive genotype 1 hepatitis C infected patients. Hepatology. 2016 Apr 26; doi: 10.1002/hep.28625. [Epub ahead of print], http://dx.doi.org/10.1002/hep.28625. [DOI] [PubMed]
- 39.Nezam A, Bacon BR, Dieterich DT, et al. Failure with all-oral regimens: academic and community treatment of a real-world population from the TRIO Network. The Liver Meeting 2015, Late Breaking Abstract 17, November 16, 2015, The Liver Meeting; San Francisco, CA. 2016. [Google Scholar]
Associated Data
This section collects any data citations, data availability statements, or supplementary materials included in this article.