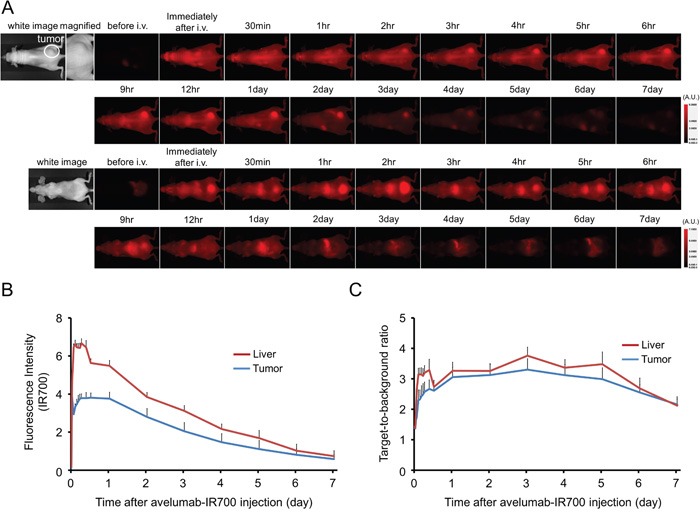
Figure 2. In vivo fluorescence imaging of H441tumor.

A. In vivo avelumab-IR700 fluorescence real-time imaging of tumor-bearing mice (right dorsum). The tumor showed high fluorescence intensity after injection and the intensity was gradually decreased over days. Most of the excess agent was excreted to the urine immediately after injection. B. Quantitative analysis of IR700 intensities in tumors and livers (n = 10). The IR700 fluorescence intensity of tumor and liver shows high intensities within 1 day after APC injection but this decreases gradually over days. C. Quantitative analysis of TBR in tumors and livers (n = 10). TBR of tumor and liver shows high immediately after APC injection, then the TBR did not change over days.
