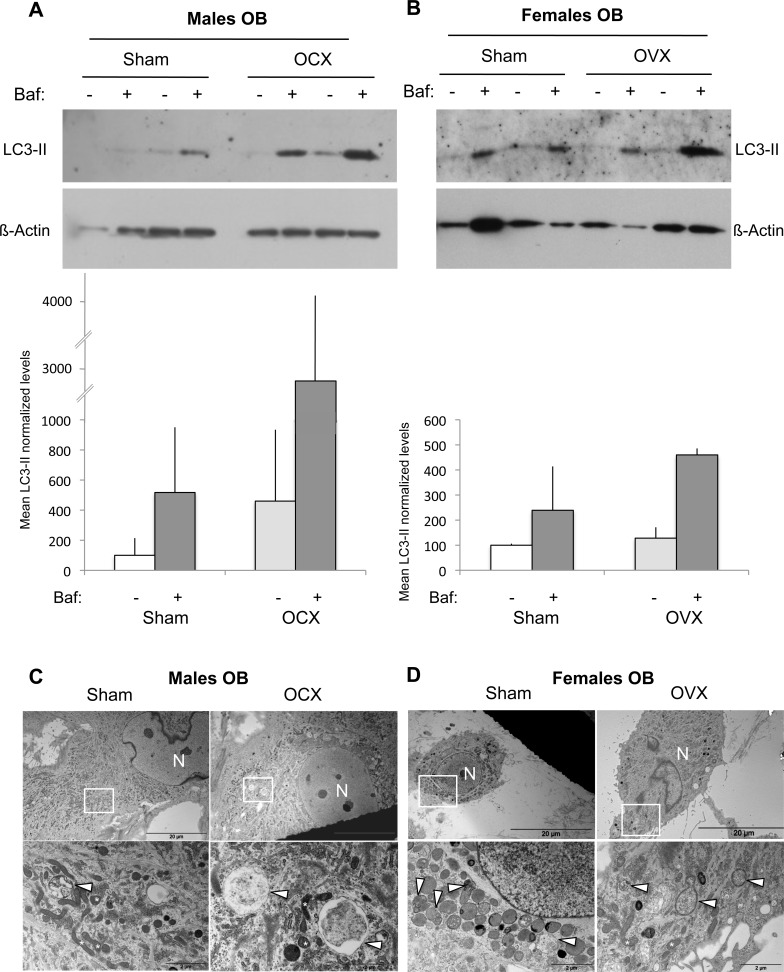
Figure 3. Autophagic activity in OB from gonadectomized mice.
OB cells were isolated from long bones of male (n = 2) and female (n = 2) mice two months after OCX and OVX, respectively. A.-B. LC3-II expression analysis by Western blot. Two hours prior to protein extraction, Bafilomycin A1 (Baf) was added or not to block to the autophagic flux. LC3-II to β-actin relative levels are expressed as means ± standard errors. C.-D. Analysis of autophagic vacuoles by transmission electron microscopy. The boxed areas are shown at higher magnification. arrowhead: autophagic vesicle, N: nucleus.

