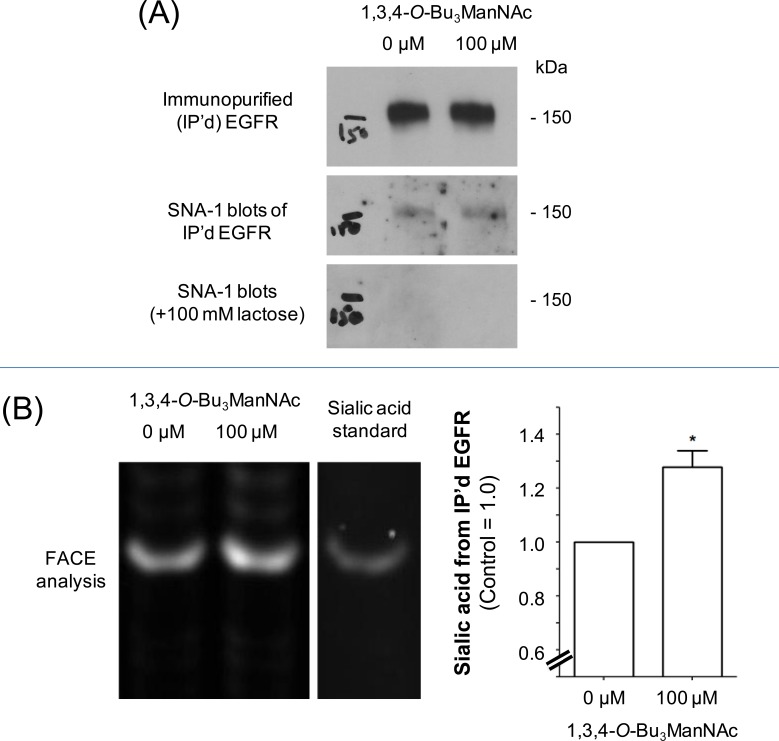
Figure 1. Sialylation of immunopurified (IP'd) EGFR from SW1990 cells.
Cells were treated with 100 μM (or 0 μM for controls) 1,3,4-O-Bu3ManNAc and EGFR was IP'd from each condition. (A) One aliquot of the IP'd EGFR was separated using PAGE and the resulting blots were probed with an EGFR-recognizing antibody or HRP-linked SNA-1 lectin; the SNA-1 staining was ablated by the binding competitor lactose. The data from the western blot was quantified and normalized to EGFR levels as shown in the the bar graph, which verifies that there was a small increase in α2,6 sialylation of EGFR in the 1,3,4-O-Bu3ManNAc-treated cells. (B) A second aliquot of IP'd EGFR was digested with sialidase, which was analyzed by Fluorescent Assisted Carbohydrate Electrophoresis (FACE). Quantification of the FACE bands (normalized to EGFR levels determined from the western blots) provided independent verification that overall sialylation of EGFR increased with 1,3,4-O-Bu3ManNAc treatment Each experiment includes at least three biological replicates and the bands were quantified using Image J with data expressed as mean ± standard error mean (SEM). * indicates a p value of < 0.05.

