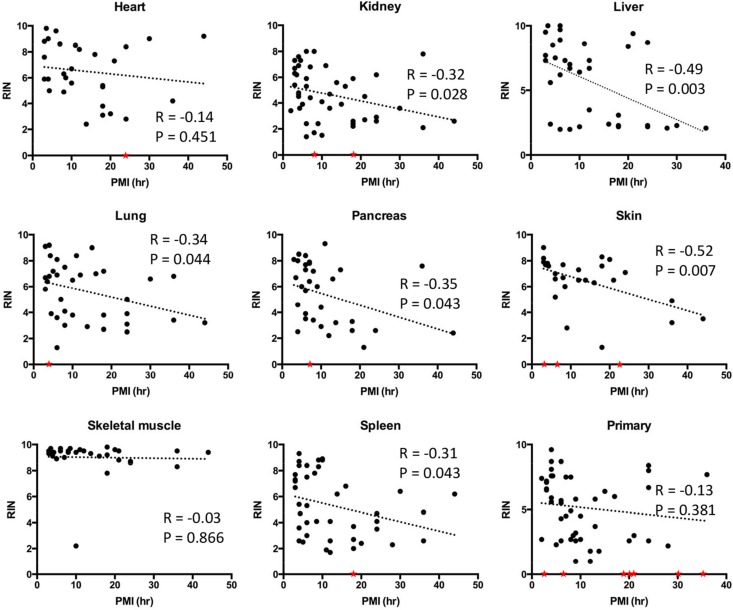
Figure 3. Correlations between RNA integrity numbers and post mortem interval by tissue site.
Scatter plots were generated by plotting RIN values from each normal tissue type or primary tumors against PMI. Linear regression was performed to create curve fits. Samples with low RNA yield leading to unreported or unreliable RIN were assigned to a RIN value of 0 (red stars) and excluded from linear regression analysis.

