ABSTRACT
Stress is known to perturb the microbiome and exacerbate irritable bowel syndrome (IBS) associated symptoms. Characterizing structural and functional changes in the microbiome is necessary to understand how alterations affect the biomolecular environment of the gut in IBS. Repeated water avoidance (WA) stress was used to induce IBS-like symptoms in rats. The colon-mucosa associated microbiome was characterized in 13 stressed and control animals by 16S sequencing. In silico analysis of the functional domains of microbial communities was done by inferring metagenomic profiles from 16S data. Microbial communities and functional profiles were compared between conditions. WA animals exhibited higher α-diversity and moderate divergence in community structure (β-diversity) compared with controls. Specific clades and taxa were consistently and significantly modified in the WA animals. The WA microbiome was particularly enriched in Proteobacteria and depleted in several beneficial taxa. A decreased capacity in metabolic domains, including energy- and lipid-metabolism, and an increased capacity for fatty acid and sulfur metabolism was inferred for the WA microbiome. The stressed condition favored the proliferation of a greater diversity of microbes that appear to be functionally similar, resulting in a functionally poorer microbiome with implications for epithelial health. Taxa, with known beneficial effects, were found to be depleted, which supports their relevance as therapeutic agents to restore microbial health. Microbial sulfur metabolism may form a key component of visceral nerve sensitization pathways and is therefore of interest as a target metabolic domain in microbial ecological restoration.
KEYWORDS: colon, microbiome, mucosa, stress, visceral hypersensitivity
Introduction
Irritable bowel syndrome (IBS) is linked to alterations in colonic microbial ecology. Characterizing structural and functional changes in the microbiome is necessary to understand how alterations in the microbiome may change the biomolecular environment and affect host biology.
Murine models of stress-induced visceral hypersensitivity, dysmotility and altered colonic permeability (i.e. IBS-like symptoms) allow for the study of alterations in microbial structural and functional ecology in IBS to reveal functional relationships between host and microbial biology. Biological, environmental, social and idiosyncratic heterogeneity inherent in human populations complicate the description of microbiome alterations and the discovery of functional relationships in IBS. Structural and functional microbial alterations discovered in animal models, such as rats, generate insights to guide the development of focused inquiries in human subjects, and are important in the discovery and development of therapeutic targets.1 Rats are particularly salient as model organisms in the study of GI conditions and the microbiome. Rats, like mice, are primarily cecal fermenters; however, it has now been shown that significant fermentation also occurs in the rat colon.2 Furthermore, the rat microbiome is more similar to that of humans than the microbiome of mice.3 These factors, along with the larger size and robust nature of rats, making them more convenient subjects for surgical procedures, make rats ideal murine models of human GI, and particular colonic dysregulation and dysbiosis.4
The use of chronic stress is well established as a mechanism to induce IBS-like symptoms and symptom related biologic dysregulation in rats.5 Chronic water avoidance stress, induces visceral hypersensitivity and concomitant upregulation of cannabinoid (CB1; cannabinoid receptor 1) and vanilloid (TRPV1; transient receptor potential vanilloid 1) receptors, and changes in certain enzymes and sodium channels, on primary nociceptive neurons in the rat gut.6 TRPV1 plays an important role in pain signaling and nociception7 and evidence suggests that TRPV1 functioning can be modulated by bacteria.8 Increased fecal output and colonic permeability is also observed in the rats along with downregulating glucocorticoid receptors (GR) and tight junction proteins (claudin-1, occludin and zona occludens-1) in the colonic but not the jejunal mucosa.9 Cells of the mucosal layer are in intimate contact with the mucosal adherent microbiome and mounting evidence suggests that the microbiome and its metabolites play an active role in epithelial health. This rat model of IBS provides a symptomatically, physiologically and biologically well characterized context, with described neurologic and mucosal mechanisms, within which to characterize and interpret structural and functional alterations in the colonic microbiome.
In this study we investigated structural and functional changes in the colonic microbiome when persistent IBS-like symptoms are induced in rats (visceral hypersensitivity, increased colonic permeability, and increased fecal pellet output).
Results
Richness and diversity
The 26 colonic mucosal samples yielded a total of 2,061,133 16S rRNA quality-filtered gene sequences that mapped to 1,679 OTUs. After the removal of spurious OTUs 1,197 OTUs (2,057,181 gene sequences) an average of 827 ± 85 OTUs per sample were retained for downstream analysis. Rarefaction curves generated from these data did not plateau (Supporting Information File 1: Fig. S2) indicating additional OTUs would be detected with increased sequencing depth. One control animal (C22) yielded an unusually low microbial richness (> 2 standard deviations), and when this animal was removed from the diversity analysis the Shannon diversity index coefficient of variation was 8.7%. The relatively stable Shannon diversity index across samples suggests that although additional phylotypes would be discovered by increased sequencing depth the majority of taxa have been captured. Good's coverage index (99.8 ± 0.1) shows that the sequencing used adequately characterizes the microbial composition. Accumulation curves did not differ (p > 0.1) between control and WA groups. The WA group had significantly higher number of observed taxa (p = 0.02), higher ACE index (p = 0.04) and a nearly significantly higher Chao1 index (p = 0.05), which suggest a difference in the minimum number of OTUs estimated to be present in the 2 groups. Shannon's index, which takes into account both the number of OTUs and their relative abundance, did not differ between conditions indicating similar OTU richness and abundance. No differences were found in the Good's coverage index between conditions indicating that sequencing coverage between the 2 conditions did not differ (Fig. 1a to e, Supporting Information File 2: Table S1).
Figure 1.
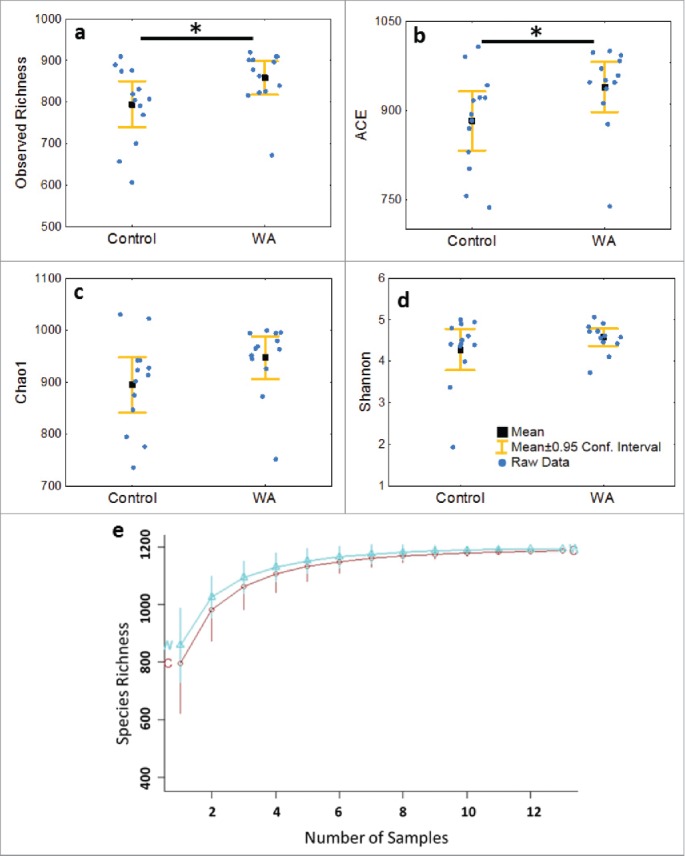
a) Observed Richness and the b) ACE diversity indices indicate significantly (*p < 0.05) increased diversity in the microbiome of WA animals, the c) Chao1 index tended to significance (p = 0.05), whereas the d) Shannon's index and e) Species Accumulation curve did not show differences in diversity in the microbiome of Control and WA animals.
Microbial community structure
Principle Coordinates Analysis (Fig. 2a) and cluster analysis (Fig. 2b) of Bray-Curtis found a significant (ANOSIM: r = 0.12, p = 0.03) divergence in microbial communities between the control and WA groups. The first 2 principal components (PC) accounted for approximately 48% of the observed variation in the microbiome. Both PC1 and 2 interpreted inter- and intra-group variability. Cluster analysis broadly discriminated between WA and control groups in agreement with discrimination observed in the PCoA.
Figure 2.
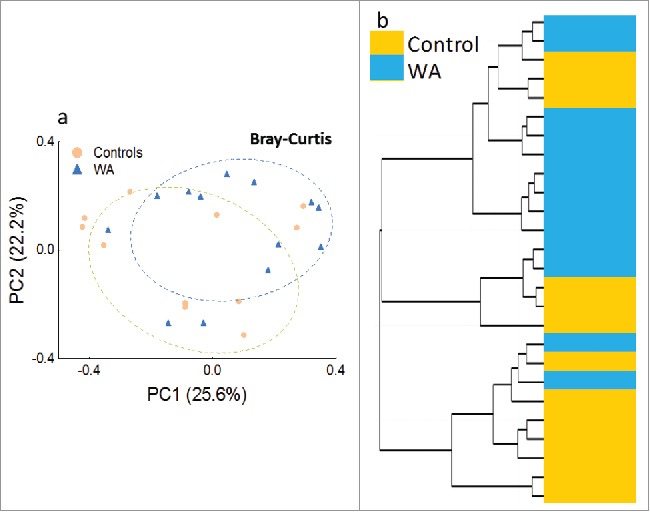
a) PCoA of abundance based Bray-Curtis distances of the colonic microbiome from control (orange) and WA (blue) rats plotted on the first 2 principal coordinates (PC) which account for approximately 48% of the observed variation b) Hierarchical clustering using Ward's method on Bray-Curtis distances reflect the clustering of microbial communities by treatment condition (Control and WA stress) observed in the PCoA analysis.
Significant condition associated clustering was not observed in PCoA of Jaccard or Sorensen presence/absence dissimilarities matrices (Fig. 3a and b). However, richness and diversity indices indicate a trend of richer and more diverse microbial communities among WA animals compared with control animals (Fig. 1a to d). The modified cladistic analysis of the presence/absence data bear out this pattern (Fig. 3c). As the tree is rooted in a hypothetical gnotobiotic individual, animals with lower diversity are sorted to the base of the tree (cluster composed mostly of HCs) and animals with increased diversity are sorted to the terminal branch ends of the tree (mostly WA animals). The WA dominated cluster is defined by the shared presence of microbial taxa (synapomorphies) belonging to the genera Corynbacterium, Facklamia, Anearocuccus and Methylobacterium, the families Sphingobacteriaceae and Methylobactriaceae and the order Actinomycetales in contrast to animals with more basal positions (control dominated) on the tree in which these taxa are predominantly absent (Fig. 3c).
Figure 3.
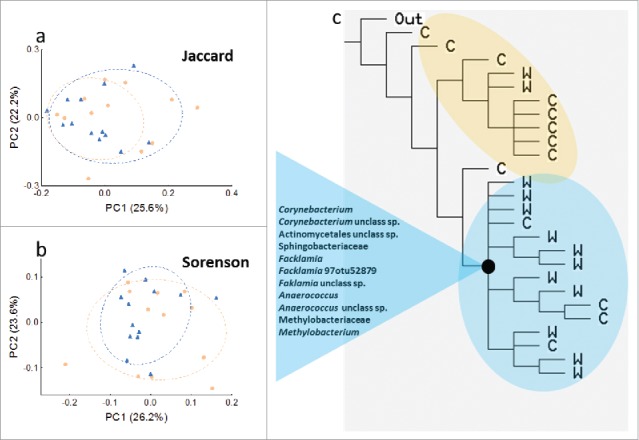
PCoA of presence-absence based a) Jaccard and b) Sorenson distances of the colonic microbiome from control (orange) and WA (blue) rats plotted on the first 2 principal coordinates (PC) which account for approximately 48% of the observed variation, showing little separation between conditions c) Cladogram constructed using individual rats as taxa, microbial OTUs and clades as characters, and their presence absence as binary character states. Maximum parsimony was used as the optimality criterion to select the tree that best described the descendant relationships between animals. Uniquely shared-derived traits (synapomorphies) in the form of microbes which define the terminal clade (i.e., the most derived clade) on the tree are indicated in the blue triangle. This clade is primarily represented by WA animals.
Differential microbial abundance
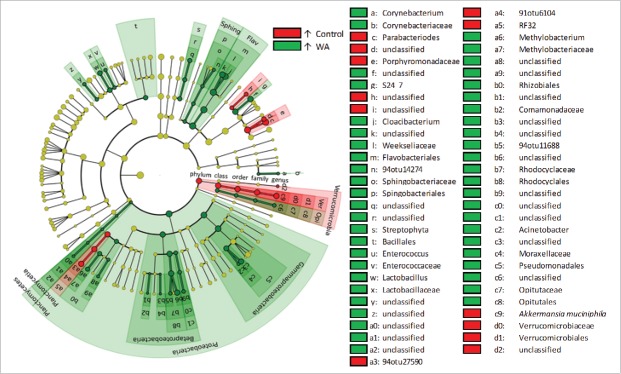
LEfSe analysis, performed on microbial abundance data, revealed OTUs and microbial clades that were perturbed by the experimental stressor. LEfSe identified 95 taxa that had significant and uniform differential abundances between conditions (Supporting Information File 2: Table S2). Of these, 19 had higher abundances in control animals and 76 had higher abundances in WA animals (Fig. 4). The 36 taxa with the largest effect sizes (LDA Score >3.5) are presented in Figure 5. The Proteobacteria as a phylum was prominently over abundant in WA animals (WA: 38 ± 21%; control: 20 ± 15%), including the classes γ- and β-proteobacteria (approximately 2-fold higher in WA respectively), so were the class Flavobacteriia (WA: 6.8 ± 4.7%; control: 3.0 ± 3.5%), the orders Pseudomonodales (WA: 10.0 ± 10.2%; control: 3.9 ± 3.9%), and Bacillales (WA: 6.8 ± 4.7%; control: 3 ± 3.6%), the families Weeksellaceae (WA: 6.8 ± 4.7%; control: 3 ± 3.5%), Rhodocyclaceae (WA: 1.0 ± 0.8%; control: 0.6 ± 0.8%) and Moraxellaceae (WA: 0.9 ± 0.5%; control: 0.7 ± 1.4%) and the genus Cloacibacterium (WA: 5.2 ± 3.6%; control: 2.3 ± 2.6%) (Figs. 4 and 5). The family Porphyromonadaceae10 (WA: 1.4 ± 0.9%; control: 7.6 ± 8.2%), the genus Parabacterioides (WA: 1.3 ± 0.9%; control: 7.4 ± 7.9%), and the species Akkermansia muciniphila (WA: 0.3 ± 0.4%; control: 1.4 ± 1.7%), had prominently decreased abundances in the WA group compared with controls (Figs. 4 and 5).
Figure 4.
Circular cladogram of statistically and biologically consistent differences in colonic microbial clades between WA and control animals. Red indicates higher abundance in control animals, green indicates higher abundance in WA animals and yellow is non-significant. Each circle's diameter is proportional to the taxon's abundance. The cladogram simultaneously highlights high-level trends and specific genera/species. Abbreviations: Sphing: Sphongobacteriia, Flav: Flavobacteriia, Ver: Verrucomicrobiae, Opi: Opitutae.
Figure 5.
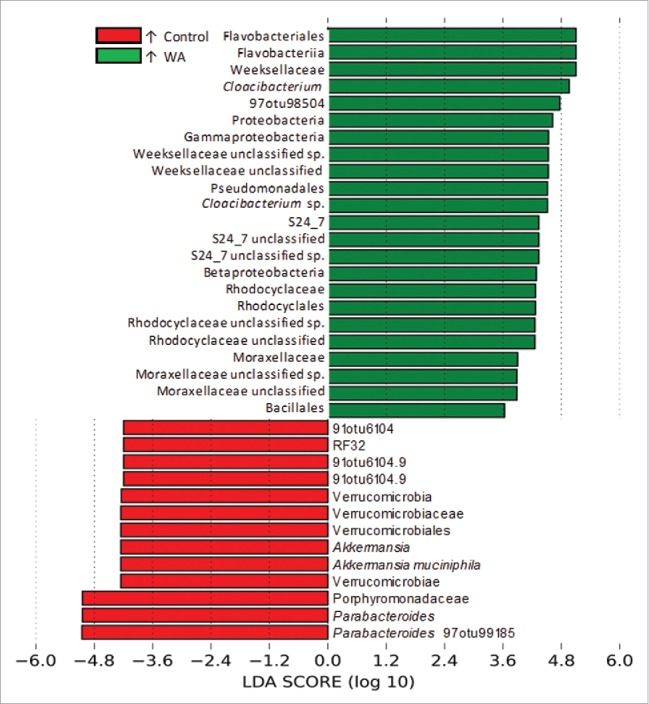
Histogram of the LDA scores computed for taxa that were found to be differentially abundant at between experimental conditions (WA vs. controls). The magnitude of the LEfSe score indicates the degree of consistency of the difference in relative abundance of the significant feature between the 2 conditions.
Differential abundances, of OTUs only, calculated using the DESeq2 method found 36 OTUs that were significantly differentially abundant and passed FDR (Supporting Information File 2: Table S3). Among these, OTUs belonging to the genera Akkermansia and Parabacteroides (> 2-fold lower in WA) were significantly less abundant in WA animals; whereas OTUs belonging to the genera Corynbacterium (> 3-fold higher in WA) and Acinetobacter (> 2-fold higher in WA) were significantly over-abundant in the WA group (Fig. 6). These results were congruent with those produced by the LEfSe analysis (Figs. 4, 5 and 6). For the complete list of relative abundances see Supporting Information File 2: Table S4.
Figure 6.
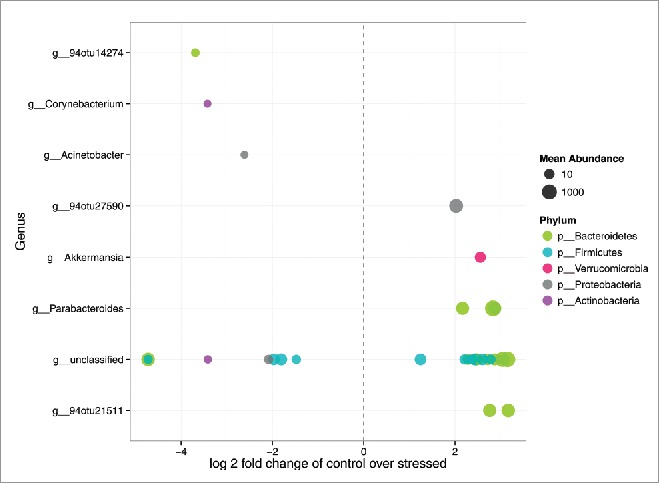
Differentially abundant features. Each point represents an OTU belonging to each Genus. Features were considered significant if their FDR-corrected p-value was less than or equal to 0.05, and the absolute value of the Log-2-fold change was greater than or equal to 1.
Metagenomic analysis
A total of 6,832 KEGG Orthologs (KOs) were detected, which was reduced to 6, 502 once spurious KOs were filtered out. Of these filtered KOs 84% were shared among the colonic mucosa-adherent microbiome of all animals. LEfSe analysis identified 48 KOs that were differentially abundant between control and WA groups (Supporting Information File 2: Table S5). Forty-two of these KOs were over-abundant in WA animals and 6 were depleted in WA animals compared with controls. KOs that were over abundant in WA animals mainly represented metabolic domains. WA microbiomes were depleted in genes related to valine-, leucine-, glycine-, serine-, glutathione metabolism (among others) in the amino-acid metabolism category; genes related to butanoate-, pyruvate-, propanoate-, and galactose metabolism in the carbohydrate metabolism category (Fig. 7). Other functional domains represented by genes depleted in WA microbiomes included glycosphingolipid biosynthesis, polyketide sugar biosynthesis and epithelial cell signaling (Fig. 7). Functional domains, which exhibited increased potential in WA animals, included biotin- and sulfur-metabolism, and the biosynthesis of fatty acids (Fig. 7).
Figure 7.
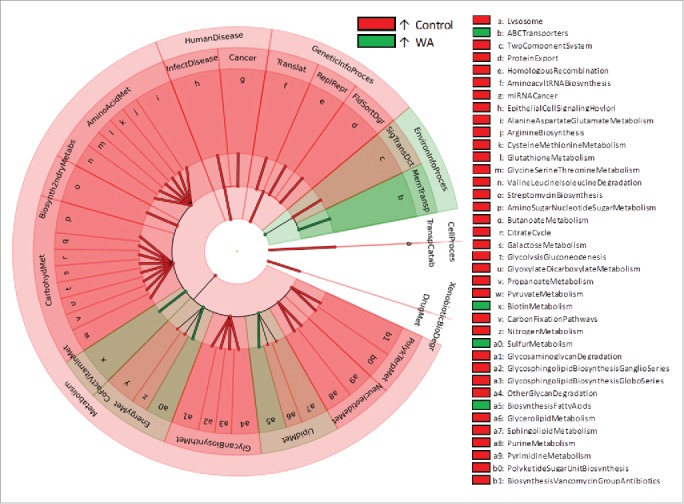
Characterization of statistically and biologically consistent differences in capacity functional domains of the colonic microbiome WA and control animals organized as a functional taxonomy using KEGG BRITE functional hierarchies. Red indicates higher abundance in control animals, green indicates higher abundance in WA animals. Abbreviations: CellProces – CellularProcesses, EnvironInfoProces - Environmental Information Processing, GeneticInfoProces – Genetic Information Processing, XenobioticBioDegr – Xenobiotics Biodegradation, AminoAcidMet – Amino Acid Metabolism, Biosynth2ndryMetabs –Biosynthesis of Other Secondary Metabolites, CarbohydMet – Carbohydrate Metabolism, CoFactVitaminMet – Metabolism of Cofactors and Vitamins, DrugMet – Drug Metabolism, EnergyMet – Energy Metabolism, FldSortDgr – Folding Sorting Degradation, GlycanBiosynthMet – Glycan Biosynthesis and Metabolism, InfectDisease – Infectious Diseases, LipidMet - Lipid Metabolism, MemTransp – Membrane Transport, NeucleotideMet – Nucleotide Metabolism, PolykTerpMet – Metabolism of Terpenoids and Polyketides, ReplRepr – Replication Repair, SigTransDct – Signal Transduction, Translat – Translation, TranspCatab – Transport Catabolism.
Discussion
WA animals exhibited an increased richness and diversity of microbes, and predominance of over-abundance among differentially abundant taxa. A trend for increased microbial diversity and richness in disease such as intra-abdominal hypertension (IAH),11 obesity12 and in response to stress and aerobic capacity13 have previously been in reported rats as well as studies of human health,14 including IBS.15 Although decreased microbial diversity and richness have become generally associated with stress, disease and poor health,16,17 several factors may influence the nature of microbiome perturbation in response to stress and disease. Evidence from a noxious-stress mouse model indicates differential responses of the mucosa-adherent and luminal microbial communities and further describes increased richness and diversity in response to an acute dose, versus decreased richness and diversity in response to chronic administration.18
Several microbial taxa were found to be uniquely predominantly present in WA animals compared with controls, contributing to the increased diversity observed in WA animals. Among these the family Methylobacteriaceae (phylum: Proteobacteria) has been observed to be uniquely present and/or enriched in the GI microbiome in several disease conditions,19-21 and the family Sphingobacteriaceae (phylum: Bacteroides) has previously been experimentally associated with chemically induced IBS-like symptoms in rats.22
The majority of perturbed functional domains of the microbiome showed decreased capacity in WA animals. Increased taxonomic diversity and abundance in the WA animals was associated with a loss of microbiome function. This suggests that taxa gained in the WA animals, though taxominically diverse were functionally similar, and that enrichment in certain taxa or clades (e.g. Proteobacteria) may suppress certain functional domains (e.g., energy metabolism) across the microbial community.
The microbiome of WA animals differed substantially in the abundance of certain key taxa and microbial clades. At the phylum level Proteobacteria were significantly enriched in the WA group, driven by class wide overabundance in γ-Protebacteria and β-Proteobacteria OTUs. Overabundance of Proteobacteria, and γ-Proteobacteria in particular, are commonly associated with IBS in humans23 and murine models of visceral hypersensitivity24 and IBD.25 β-Proteobacteria overabundance is also associated with other systemic conditions such as diabetes.26,27 The observed enrichment in the Bacillales, Cloacibacterium, Sphingobacteriales, Streptophyta, Lactobacillus, Acinetobacter and Enterococcaceae has also variously been associated with IBS in humans28,29 and primates30 as well as rat models of visceral pain.22,24 The association of the Opitutaceae, Sphingobacteriales, Weeksellaceae, and S24_7 with IBS appears to be novel. The γ-Protebacteria and Corynebacteriaceae are also implicated in chronic pain conditions, specifically chronic bladder, pelvic and prostate pain and inflammation.31-33
Microbes with known or suspected beneficial effects were significantly depleted in WA animals; these include Akkermansia muciniphila, and the Porphyromonadeaceae10 (the genus Parabacteriodes in particular). A. muciniphila is a mucin degrading bacteria which has been found to be important in maintaining and regulating host epithelial health. The organism has become an important focus for research into microbial cross-talk and host health. Depleted abundance of the microbe is associated with epithelial inflammation, IBD, obesity and diabetes, whereas restoration of A. muciniphila improves symptoms and outcomes.34 Elevated abundance of the genus Parabacteroides is associated with healthy microbial ecologies and certain Parabacteroides species exhibit beneficial properties.10,35,36
Taxonomic perturbations in the microbial community were associated with changes in the functional profile of the microbiome in response to the stressor. Various metabolic functions, mainly relating to energy, lipid and amino acid metabolism appeared to be decreased in the microbiome of WA animals whereas the capacity for fatty acid metabolism and sulfur metabolism were enhanced in the colonic microbiome of WA animals compared with controls. The colonic epithelium derives most of its energy from the microbiome and perturbations in the microbiomes' capacity to effectively extract and supply energy would affect epithelial health and function. Dysregulation in fatty acid metabolism is commonly associated with IBS and inflammatory bowel conditions.37 Increased capacity for short chain fatty acid metabolism appears to be typical in IBS, though the opposite trend has also been reported.38-40 Increased capacity in sulfur metabolism has also been reported in IBS and IBD and H2S is now appreciated to be an important neurotransmitter implicated in colonic hypersensitivity.41,42 Future experiments may specifically target sulfur metabolites and sulfur metabolizing bacteria. If these targets can be successfully modulated to prevent or alleviate symptoms and symptom severity in the model current model system they may be good targets of intervention in patients. Similarly, restoration of beneficial microbes, such as A. muciniphila, or functional domains, such as fatty acid metabolism dynamics, will be further examined as therapeutic targets with translation potential.
In summary, we found significant changes in colonic mucosa-adherent microbial taxa and clades and the capacity of functional domains of the microbiome in a rat model which mimics the human IBS phenotype. The taxonomic and functional perturbations we describe are largely congruent with patterns of microbiome dysregulation observed in human and animal models of IBS and GI distress. These results contribute to the growing body of research necessary to identify reliable targets and target profiles (microbes, functions, metabolites) which can be further developed as diagnostic and intervention targets.
Materials and methods
Animal husbandry
Adult male Sprague–Dawley rats (weighting 160–180 g), obtained from Charles River Laboratories (Wilmington, MA), were housed in the animal facility that was maintained at 22°C with an automatic 12 hour light/dark cycle. Animals received a standard laboratory diet and tap water ad libitum. Animals were hosted in the animal facility for 5–7 d before the commencement of experiments. At this point animals weighed between 200–220 g. The animals were then randomly grouped and subjected to 10-day water avoidance (WA) stress.5 At the end of the study animals weighed between 300–350 g. The study and experiments were approved by the University of Michigan Committee on Use and Care of Animals following National Institutes of Health guidelines.
Experimental stressor
Thirteen male rats were repeatedly exposed to WA stress as described previously.5 Briefly, the animals were placed on a glass platform in the center of a tank filled with water (25°C) to 1 cm below the height of the platform. The animals were left on the platform for 1 hour (in the morning) each day for 10 consecutive days. Control (sham-stress, n = 13) animals were similarly treated for 10 days, but in a tank without water. The repeated WA procedure has been shown to be a potent psychological stressor, which results in increased serum corticosterone, visceral hypersensitivity, increased colonic permeability, and increased fecal pellet output (altered motility) compared with sham-stressed control animals.43
Sample collection and DNA purification
Animals were killed at the end of the protocol and the colon was immediately dissected out. A one centimeter section of the distal colon was placed in RNAlater® Stabilization Solution (ThermoFisher Scientific) at 4°C overnight before being stored at −80°C until further processing. Prior to DNA extraction the sample was thawed and vortexed for one minute to mechanically separate the mucosa from the tissue section. The colon tissue section was removed and stored at −80°C in RNAlater® Stabilization Solution in a new tube. The cellular composition of the mechanically sloughed cells was confirmed to be epithelial by Diff-Quick staining. Samples were centrifuged and the RNAlater® Stabilization Solution was discarded. The remaining pellet of epithelial cells was processed for DNA using the AllPrep DNA/RNA/miRNA Universal Kit (Qiagen) as per the manufacturer's instructions.
Amplification and high throughput sequencing
The V4 hypervariable domain of the bacterial 16S rRNA gene was amplified by polymerase chain reaction (PCR) using Platinum PCR SuperMix High Fidelity (Invitrogen) with 2µl of template DNA, and primers (F515: 5′-CTGCCAGCMGCCGCGGTAA-3′, R806: 5′-GGACTACHVGGGTWTCTAAT-3′)44 to make up a final reaction volume of 50 μl at a final concentration of 200 nM. Thermal cycling conditions used were as follows: 94°C 2 min initial denaturation; 94°C 30 s, 50°C 30 s, 68°C 60 s for 30 cycles; 68°C 5 min.
Each amplicon was purified using the Agencourt AMPure XP PCR purification process (Beckman Coulter). Amplicon integrity and concentration was determined using the Agilent High Sensitivity DNA kit, which was run on an Agilent 2100 Bioanalyzer (Agilent Technologies).
Amplicons (20 ng) were further prepared using 200bp Ion Xpress Plus Fragment Library kit and each purified amplicon library was individually barcoded for multiplexed sequencing using the Ion Xpress Barcode Adapter kit. Enriched template-positive Ion PI™ Ion Sphere™ Particles were prepared for sequencing using Ion OneTouch™ 200 Template Kit v2 DL. Amplicon libraries were multiplexed for sequencing on separate 316 chips using the Ion Torrent PGM system and Ion PGM™ Sequencing 200 Kit v2. Individual sequence reads, low quality reads, and polyclonal sequences were filtered from sequencing data. The amplicon libraries for 7 animals were loaded onto 2 separate chips and sequenced to examine the reproducibility of the microbial profiles. Correlation (r2) of OTU sequence counts between replicate pairs ranged between 0.85 and 0.96 confirming a high degree of technical replicability of the data (see Supporting Information File 1: Fig. S1).
Microbiome sequence data processing
SecondGenome was contracted to perform data processing using the following procedures. Sequence paired-end reads were merged using USEARCH and the resulting sequences were compared with an in-house strains database using USEARCH (usearch_global). All sequences conforming to a unique strain with ≥ 99% similarity were assigned an Operational Taxonomic Unit (OTU) identifier. To ensure specificity of strain assignment, a difference of ≥ 0.25% between the first and second most likely strain assignment was required. For each OTU one matching sequence was selected as representative and all sequences were subsequently mapped, using USEARCH, against the representative OTU sequences to calculate OTU abundances. Remaining non-strain sequences were quality filtered and de-replicated with USEARCH. Resulting unique sequences were then clustered at 97% sequence similarity by UPARSE (de novo OTU clustering) and a representative consensus sequence per de novo OUT was determined. The UPARSE clustering algorithm identifies and discards likely chimeric OTUs. All non-strain sequences which passed quality filters were mapped to the representative consensus sequences to calculate the abundance of de novo OTUs. Representative OTU sequences were assigned a taxonomic classification via MOTHUR's Bayesian classifier, trained against the Greengenes reference database of 16S rRNA gene sequences at 99% similarity. The OTU list was further filtered to only include OTUs present at least once in 10% (i.e., ≥ 3 samples) of samples. Counts were not rarefied as it has been shown that rarefaction results in high rates of false positives in tests for differential abundance.45
Statistical analysis
Within sample community (α) diversity (i.e., sample richness) was assessed by observed diversity (i.e., sum of unique OTUs per sample), Chao1, Abundance Coverage Estimator (ACE), abundance based richness estimators, which are sensitive to rare OTUs, and Shannon's diversity index, which is more dependent on highly abundant OTUs and less sensitive to rare OTUs, a in RStudio using the R package “vegan” (v 2.3–0) and compared between treatments using a Mann–Whitney U-test. Good's coverage index was calculated as C = 1 –(s/n), where s is the number of OTU singletons and n the numbers of individuals in the sample.46 Sample-based species accumulation curves for each condition were calculated using the exact accumulation method set to a 100 permutations using the package BiodiversityR (Roeland Kindt R).
Divergence in community composition between samples (β-diversity) was assessed by calculating a Bray-Curtis (abundance) and, Jaccard and Sorenson (presence/absence) distance matrices. Ordination was visualized using Principle Coordinates Analysis (PCoA) and hierarchical clustering (Ward's method),47 and compared using the ANOSIM test (999 permutations) in RStudio with the R package “vegan” (v 2.3–0).
Differences in the patterns of the presence and absence of taxa were further examined using a novel application of cladistic analysis modified for the analysis of –omics data.48 The approach is similar to that used in the study of phylogeography49 except here individual animals are treated as geographic isolates and the microbes as the faunal communities. Cladistic analysis, using Maximum Parsimony algorithms, sort individuals in to a hierarchy based on the uniquely shared presence or absence of microbes among individuals (synapomorphies). The agglomerated data table was used to identify robust differences at higher taxonomic levels. First, counts of less than or equal to 3 were converted to zero (minimum threshold for being present), and only taxa with at least one count above the threshold was retained. Redundant taxa were filtered to ensure that higher level taxon clusters were not weighted when represented by only one OTU. This procedure reduced the taxon list to 330 taxa, which were binary coded for presence absence. We assigned a gnotobiotic root to the tree, though permutations with a root based on the median HC or median for all taxa yielded similar tree topographies and synapomorphies as trees using a gnotobiotic root. The data was uploaded to TNT (V1.1)50 and run using default setting for the “New Technology Search” (a rapid heuristic search algorithm for large data sets). The estimated consensus tree was retained and taxa responsible for major clusters were determined from this tree.
Differences in the relative abundance of microbes (at the OTU and higher taxonomic levels) and the abundance of microbial functional domains were performed with the LEfSe (Linear Discriminant Analysis with Effect Size) analysis method (http://huttenhower.sph.harvard.edu/galaxy/), which characterizes the statistical significance, biologic consistency and effect size in identifying differentially abundant taxa.51 An α of 0.05 and effect size of 2 was specified for differentially abundant features to be considered significant and to be retained for further consideration and discussion. Univariate differential abundance of OTUs was also tested using a negative binomial noise model for over dispersion as implemented by the R package “DESeq2” (v 1.11.9).45,52 DESeq2 was run under default settings and q values were calculated using the Benjamini-Hochberg procedure to control for false discovery rates.
The meta-genome was characterized by using both the KEGG 70.1 and BioCyc 18.0 databases as reference genomes. A genome was inferred for each 16S rRNA OTU based on the sequence identity between the OTU's representative sequence and the nearest neighbor 16S rRNA sequence from the genome databases restricted to a minimum identity of 97%. OTU abundance was normalized by 16S rRNA copy numbers, then multiplied by the gene contents of each inferred genome to predict each sample's metagenome. Only KOs seen at least once within 10% of the data set were kept and moved forward to downstream data analysis.
Supplementary Material
Provenance and peer review
Not commissioned; externally peer reviewed.
Ethics approval
All experimental procedures were performed in accordance with US NIH guidelines and were approved by the University Committee on Use and Care of Animals at the University of Michigan.
Data sharing statement
The data sets generated during or analyzed during the current study will be made available in the SRA repository, [http://www.ncbi.nlm.nih.gov/sra].
Disclosure of potential conflicts of interest
No potential conflicts of interest were disclosed.
Acknowledgments
We thank SecondGenome for their role in assisting with data processing and analysis for publication.
Funding
Support was provided by the Division of Intramural Research (to WAH, 1ZIANR000023–01–03 and Intramural Research Training Awards to, SKA, CGM and NHF), National Institutes of Health, Department of Health and Human Services, Bethesda, Maryland, United States of America. The research was also supported by grant R01DK098205 (JWW) and the University of Michigan Center for Gastrointestinal Research (UMCGR) grant 5P30DK034933 from the US National Institutes of Health Pilot Feasibility grant. Grant F014289 (SH) was awarded by the Michigan Gastrointestinal Peptide Research Center.
Author's contributions
NHF, JWW and WAH conceived, led and supervised the study; ALC and SH performed most of animal experiments and sample collection; and NHF analyzed and/or supervised analyses of all data and wrote the manuscript. NHF, DW and ALC designed, optimized and performed the sequencing experiments. SKA participated in the study design. SecondGenome performed the data processing. All authors contributed to writing and editing of the manuscript.
*Note: The opinions expressed herein and the interpretation and reporting of these data are the responsibility of the author(s) and should not be seen as an official recommendation, interpretation, or policy of the National Institutes of Health (NIH) or the United States Government.*
References
- [1].Mayer EA, Collins SM. Evolving pathophysiologic models of functional gastrointestinal disorders. Gastroenterology 2002; 122:2032-48; PMID:12055608; http://dx.doi.org/ 10.1053/gast.2002.33584 [DOI] [PubMed] [Google Scholar]
- [2].Kalmokoff M, Franklin J, Petronella N, Green J, Brooks SP. Phylum level change in the cecal and fecal gut communities of rats fed diets containing different fermentable substrates supports a role for nitrogen as a factor contributing to community structure. Nutrients 2015; 7:3279-99; PMID:25954902; http://dx.doi.org/ 10.3390/nu7053279 [DOI] [PMC free article] [PubMed] [Google Scholar]
- [3].Wos-Oxley ML, Bleich A, Oxley AP, Kahl S, Janus LM, Smoczek A, Nahrstedt H, Pils MC, Taudien S, Platzer M, et al.. Comparative evaluation of establishing a human gut microbial community within rodent models. Gut Microbes 2012; 3:234-49; PMID:22572831; http://dx.doi.org/ 10.4161/gmic.19934 [DOI] [PMC free article] [PubMed] [Google Scholar]
- [4].Jiminez JA, Uwiera TC, Inglis GD, Uwiera RR. Animal models to study acute and chronic intestinal inflammation in mammals. Gut Pathogens 2015; 7:1; PMID:25653718; http://dx.doi.org/ 10.1186/s13099-015-0076-y [DOI] [PMC free article] [PubMed] [Google Scholar]
- [5].Hong S, Fan J, Kemmerer ES, Evans S, Li Y, Wiley JW. Reciprocal changes in vanilloid (TRPV1) and endocannabinoid (CB1) receptors contribute to visceral hyperalgesia in the water avoidance stressed Rat. Gut 2009; 58:202-10; PMID:18936104; http://dx.doi.org/ 10.1136/gut.2008.157594 [DOI] [PMC free article] [PubMed] [Google Scholar]
- [6].Hong S, Zheng G, Wu X, Snider NT, Owyang C, Wiley JW. Corticosterone mediates reciprocal changes in CB 1 and TRPV1 receptors in primary sensory neurons in the chronically stressed Rat. Gastroenterology 2011; 140:627-37.e4; PMID:21070780; http://dx.doi.org/ 10.1053/j.gastro.2010.11.003 [DOI] [PMC free article] [PubMed] [Google Scholar]
- [7].Miranda A, Nordstrom E, Mannem A, Smith C, Banerjee B, Sengupta JN. The role of transient receptor potential vanilloid 1 in mechanical and chemical visceral hyperalgesia following experimental colitis. Neuroscience 2007; 148:1021-32; PMID:17719181; http://dx.doi.org/ 10.1016/j.neuroscience.2007.05.034 [DOI] [PMC free article] [PubMed] [Google Scholar]
- [8].Perez-Burgos A, Wang L, McVey Neufeld K-A, Mao Y-K, Ahmadzai M, Janssen LJ, Stanisz AM, Bienenstock J, Kunze WA. The TRPV1 channel in rodents is a major target for antinociceptive effect of the probiotic Lactobacillus reuteri DSM 17938. J Physiol 2015; 593:3943-57; PMID:26084409; http://dx.doi.org/ 10.1113/JP270229 [DOI] [PMC free article] [PubMed] [Google Scholar]
- [9].Zheng G, Wu SP, Hu Y, Smith DE, Wiley JW, Hong S. Corticosterone mediates stress-related increased intestinal permeability in a region-specific manner. Neurogastroenterol Motil 2013; 25:e127-39; PMID:23336591; http://dx.doi.org/ 10.1111/nmo.12066 [DOI] [PMC free article] [PubMed] [Google Scholar]
- [10].Sun Y, Zhang M, Chen CC, Gillilland Iii M, Sun X, El–Zaatari M, Huffnagle GB, Young VB, Zhang J, Hong SC, et al.. Stress-induced corticotropin-releasing hormone-mediated NLRP6 inflammasome inhibition and transmissible enteritis in Mice. Gastroenterology 2013; 144:1478-87.e8; PMID:23470617; http://dx.doi.org/ 10.1053/j.gastro.2013.02.038 [DOI] [PMC free article] [PubMed] [Google Scholar]
- [11].Leng Y, Yi M, Fan J, Bai Y, Ge Q, Yao G. Effects of acute intra-abdominal hypertension on multiple intestinal barrier functions in rats. Sci Rep 2016; 6:22814; PMID:26980423 [DOI] [PMC free article] [PubMed] [Google Scholar]
- [12].Lecomte V, Kaakoush NO, Maloney CA, Raipuria M, Huinao KD, Mitchell HM, Morris MJ. Changes in gut microbiota in Rats fed a high fat diet correlate with obesity-associated metabolic parameters. PLoS One 2015; 10:e0126931; PMID:25992554; http://dx.doi.org/ 10.1371/journal.pone.0126931 [DOI] [PMC free article] [PubMed] [Google Scholar]
- [13].Cox-York KA, Sheflin AM, Foster MT, Gentile CL, Kahl A, Koch LG, Britton SL, Weir TL. Ovariectomy results in differential shifts in gut microbiota in low versus high aerobic capacity rats. Physiol Rep 2015:3:e12488 PMID:26265751; http://dx.doi.org/ 10.14814/phy2.12488 [DOI] [PMC free article] [PubMed] [Google Scholar]
- [14].Jiang H, Ling Z, Zhang Y, Mao H, Ma Z, Yin Y, Wang W, Tang W, Tan Z, Shi J, et al.. Altered fecal microbiota composition in patients with major depressive disorder. Brain, Behav Immun 2015; 48:186-94; PMID:25882912; http://dx.doi.org/ 10.1016/j.bbi.2015.03.016 [DOI] [PubMed] [Google Scholar]
- [15].Ponnusamy K, Choi JN, Kim J, Lee SY, Lee CH. Microbial community and metabolomic comparison of irritable bowel syndrome faeces. J Med Microbiol 2011; 60:817-27; PMID:21330412; http://dx.doi.org/ 10.1099/jmm.0.028126-0 [DOI] [PMC free article] [PubMed] [Google Scholar]
- [16].Guarner F. The gut microbiome: what do we know? Clin Liver Dis 2015; 5:86-90; http://dx.doi.org/ 10.1002/cld.454 [DOI] [PMC free article] [PubMed] [Google Scholar]
- [17].Le Chatelier E, Nielsen T, Qin J, Prifti E, Hildebrand F, Falony G, Almeida M, Arumugam M, Batto JM, Kennedy S, et al.. Richness of human gut microbiome correlates with metabolic markers. Nature 2013; 500:541-6; PMID:23985870; http://dx.doi.org/ 10.1038/nature12506 [DOI] [PubMed] [Google Scholar]
- [18].Liang X, Bittinger K, Li X, Abernethy DR, Bushman FD, FitzGerald GA. Bidirectional interactions between indomethacin and the murine intestinal microbiota. eLife 2015; 4:e08973; PMID:26701907; http://dx.doi.org/ 10.7554/eLife.08973 [DOI] [PMC free article] [PubMed] [Google Scholar]
- [19].Amir I, Konikoff FM, Oppenheim M, Gophna U, Half EE. Gastric microbiota is altered in oesophagitis and Barrett's oesophagus and further modified by proton pump inhibitors. Environ Microbiol 2014; 16:2905-14; PMID:24112768; http://dx.doi.org/ 10.1111/1462-2920.12285 [DOI] [PubMed] [Google Scholar]
- [20].Kelly DP, McDonald IR, Wood AP. The Family Methylobacteriaceae In: Rosenberg E, DeLong EF, Lory S, Stackebrandt E, Thompson F, eds. The Prokaryotes: Alphaproteobacteria and Betaproteobacteria. Berlin, Heidelberg: Springer Berlin Heidelberg, 2014:313-40. [Google Scholar]
- [21].Kaakoush NO, Day AS, Huinao KD, Leach ST, Lemberg DA, Dowd SE, Mitchell HM. Microbial dysbiosis in pediatric patients with Crohn's disease. J Clin Microbiol 2012; 50:3258-66; PMID:22837318; http://dx.doi.org/ 10.1128/JCM.01396-12 [DOI] [PMC free article] [PubMed] [Google Scholar]
- [22].Nelson TA, Holmes S, Alekseyenko AV, Shenoy M, Desantis T, Wu CH, Andersen GL, Winston J, Sonnenburg J, Pasricha PJ, et al.. PhyloChip microarray analysis reveals altered gastrointestinal microbial communities in a rat model of colonic hypersensitivity. Neurogastroenterol Motil 2011; 23:169-77, e41-2. [DOI] [PMC free article] [PubMed] [Google Scholar]
- [23].Taverniti V, Guglielmetti S. Methodological issues in the study of intestinal microbiota in irritable bowel syndrome. World J Gastroenterol 2014; 20:8821-36; PMID:25083056 [DOI] [PMC free article] [PubMed] [Google Scholar]
- [24].Xu D, Gao J, Gillilland Iii M, Wu X, Song I, Kao JY, Owyang C. Rifaximin alters intestinal bacteria and prevents stress-induced gut inflammation and visceral hyperalgesia in Rats. Gastroenterology 2014; 146:484-96.e4; PMID:24161699 [DOI] [PMC free article] [PubMed] [Google Scholar]
- [25].Nell S, Suerbaum S, Josenhans C. The impact of the microbiota on the pathogenesis of IBD: lessons from mouse infection models. Nat Rev Micro 2010; 8:564-77; http://dx.doi.org/ 10.1038/nrmicro2403 [DOI] [PubMed] [Google Scholar]
- [26].Zhang X, Shen D, Fang Z, Jie Z, Qiu X, Zhang C, Chen Y, Ji L. Human gut microbiota changes reveal the progression of glucose intolerance. PLoS One 2013; 8:e71108; PMID:24013136; http://dx.doi.org/ 10.1371/journal.pone.0071108 [DOI] [PMC free article] [PubMed] [Google Scholar]
- [27].Larsen N, Vogensen FK, van den Berg FWJ, Nielsen DS, Andreasen AS, Pedersen BK, Al-Soud WA, Sørensen SJ, Hansen LH, Jakobsen M. Gut microbiota in human adults with type 2 diabetes differs from non-diabetic adults. PLoS One 2010; 5:e9085; PMID:20140211; http://dx.doi.org/ 10.1371/journal.pone.0009085 [DOI] [PMC free article] [PubMed] [Google Scholar]
- [28].Carroll IM, Ringel-Kulka T, Siddle JP, Ringel Y. Alterations in composition and diversity of the intestinal microbiota in patients with diarrhea-predominant irritable bowel syndrome. Neurogastroenterol Motil 2012; 24:521-30; PMID:22339879; http://dx.doi.org/ 10.1111/j.1365-2982.2012.01891.x [DOI] [PMC free article] [PubMed] [Google Scholar]
- [29].Parthasarathy G, Chen J, Chen X, Chia N, O'Connor HM, Wolf PG, Gaskins HR, Bharucha AE. Relationship between microbiota of the colonic mucosa vs feces and symptoms, colonic transit, and methane production in female patients with chronic constipation. Gastroenterology 2016; 150:367-79.e1; PMID:26460205; http://dx.doi.org/ 10.1053/j.gastro.2015.10.005 [DOI] [PMC free article] [PubMed] [Google Scholar]
- [30].Broadhurst MJ, Ardeshir A, Kanwar B, Mirpuri J, Gundra UM, Leung JM, Wiens KE, Vujkovic-Cvijin I, Kim CC, Yarovinsky F, et al.. Therapeutic helminth infection of macaques with idiopathic chronic diarrhea alters the inflammatory signature and mucosal microbiota of the colon. PLoS Pathog 2012; 8:e1003000; PMID:23166490; http://dx.doi.org/ 10.1371/journal.ppat.1003000 [DOI] [PMC free article] [PubMed] [Google Scholar]
- [31].Schaeffer AJ, Knauss JS, Landis JR, Propert KJ, Alexander RB, Litwin MS, Nickel JC, O'Leary MP, Nadler RB, Pontari MA, et al.. Leukocyte and bacterial counts do not correlate with severity of symptoms in Men with chronic prostatitis: the national institutes of health chronic prostatitis cohort study. J Urol 2002; 168:1048-53; PMID:12187220; http://dx.doi.org/ 10.1016/S0022-5347(05)64572-7 [DOI] [PubMed] [Google Scholar]
- [32].Shoskes DA, Altemus J, Polackwich AS, Tucky B, Wang H, Eng C. The urinary microbiome differs significantly between patients with chronic prostatitis/chronic pelvic pain syndrome and controls as well as between patients with different clinical phenotypes. Urology 2016; 92:26-32; PMID:26970449 [DOI] [PubMed] [Google Scholar]
- [33].Urquhart DM, Zheng Y, Cheng AC, Rosenfeld JV, Chan P, Liew S, Hussain SM, Cicuttini FM. Could low grade bacterial infection contribute to low back pain? A systematic review. BMC Med 2015; 13:1-13; PMID:25609421; http://dx.doi.org/ 10.1186/s12916-015-0267-x [DOI] [PMC free article] [PubMed] [Google Scholar]
- [34].Derrien M, Belzer C, de Vos WM. Akkermansia muciniphila and its role in regulating host functions. Microbial Pathogenesis 2016; [Epub ahead of print] PMID:26875998; http://dx.doi.org/ 10.1016/j.micpath.2016.02.005 [DOI] [PubMed] [Google Scholar]
- [35].Plaza-Diaz J, Fernandez-Caballero JA, Chueca N, Garcia F, Gomez-Llorente C, Saez-Lara MJ, Fontana L, Gil Á. Pyrosequencing analysis reveals changes in intestinal microbiota of healthy adults who received a daily dose of immunomodulatory probiotic strains. Nutrients 2015; 7:3999-4015; PMID:26016655; http://dx.doi.org/ 10.3390/nu7063999 [DOI] [PMC free article] [PubMed] [Google Scholar]
- [36].Kverka M, Zakostelska Z, Klimesova K, Sokol D, Hudcovic T, Hrncir T, Rossmann P, Mrazek J, Kopecny J, Verdu EF, et al.. Oral administration of Parabacteroides distasonis antigens attenuates experimental murine colitis through modulation of immunity and microbiota composition. Clin Exp Immunol 2011; 163:250-9; PMID:21087444; http://dx.doi.org/ 10.1111/j.1365-2249.2010.04286.x [DOI] [PMC free article] [PubMed] [Google Scholar]
- [37].Tana C, Umesaki Y, Imaoka A, Handa T, Kanazawa M, Fukudo S. Altered profiles of intestinal microbiota and organic acids may be the origin of symptoms in irritable bowel syndrome. Neurogastroenterol Motil 2010; 22:512-9, e114-5. [DOI] [PubMed] [Google Scholar]
- [38].Le Gall G, Noor SO, Ridgway K, Scovell L, Jamieson C, Johnson IT, Colquhoun IJ, Kemsley EK, Narbad A. Metabolomics of fecal extracts detects altered metabolic activity of gut microbiota in ulcerative colitis and irritable bowel syndrome. J Proteome Res 2011; 10:4208-18; PMID:21761941; http://dx.doi.org/ 10.1021/pr2003598 [DOI] [PubMed] [Google Scholar]
- [39].Jeffery IB, Claesson MJ, O'Toole PW. Intestinal microbiota, alterations in irritable bowel syndrome In: Highlander SK, Rodriguez-Valera F, White BA, eds. Encyclopedia of Metagenomics: Environmental Metagenomics. Boston, MA: Springer US, 2015:295-9. [Google Scholar]
- [40].Major G, Spiller R. Irritable bowel syndrome, inflammatory bowel disease and the microbiome. Curr Opin Endocrinol Diabetes Obes 2014; 21:15-21; PMID:24296462; http://dx.doi.org/ 10.1097/MED.0000000000000032 [DOI] [PMC free article] [PubMed] [Google Scholar]
- [41].Carbonero F, Benefiel AC, Alizadeh-Ghamsari AH, Gaskins HR. Microbial pathways in colonic sulfur metabolism and links with health and disease. Front Physiol 2012; 3:448; PMID:23226130; http://dx.doi.org/ 10.3389/fphys.2012.00448 [DOI] [PMC free article] [PubMed] [Google Scholar]
- [42].Medani M, Collins D, Docherty NG, Baird AW, O'Connell PR, Winter DC. Emerging role of hydrogen sulfide in colonic physiology and pathophysiology. Inflammatory Bowel Dis 2011; 17:1620-5; PMID:21674719; http://dx.doi.org/ 10.1002/ibd.21528 [DOI] [PubMed] [Google Scholar]
- [43].Zheng G, Hong S, Hayes JM, Wiley JW. Chronic stress and peripheral pain: Evidence for distinct, region-specific changes in visceral and somatosensory pain regulatory pathways. Exp Neurol 2015; 273:301-11; PMID:26408049; http://dx.doi.org/ 10.1016/j.expneurol.2015.09.013 [DOI] [PMC free article] [PubMed] [Google Scholar]
- [44].Caporaso JG, Lauber CL, Walters WA, Berg-Lyons D, Lozupone CA, Turnbaugh PJ, Fierer N, Knight R. Global patterns of 16S rRNA diversity at a depth of millions of sequences per sample. Proc Natl Acad Sci U S A 2011; 108 Suppl 1:4516-22; PMID:20534432; http://dx.doi.org/ 10.1073/pnas.1000080107 [DOI] [PMC free article] [PubMed] [Google Scholar]
- [45].McMurdie PJ, Holmes S. Waste not, want not: why rarefying microbiome data is inadmissible. PLoS Comput Biol 2014; 10:e1003531; PMID:24699258; http://dx.doi.org/ 10.1371/journal.pcbi.1003531 [DOI] [PMC free article] [PubMed] [Google Scholar]
- [46].Good IJ. The population frequencies of species and the estimation of population parameters. Biometrika 1953; 40:237-64; http://dx.doi.org/ 10.1093/biomet/40.3-4.237 [DOI] [Google Scholar]
- [47].Ward JH. Hierarchical grouping to optimize an objective function. J Am Stat Assoc 1963; 58:236-44; http://dx.doi.org/ 10.1080/01621459.1963.10500845 [DOI] [Google Scholar]
- [48].Abu-Asab MS, Chaouchi M, Alesci S, Galli S, Laassri M, Cheema AK, Atouf F, VanMeter J, Amri H. Biomarkers in the age of omics: time for a systems biology approach. OMICS 2011; 15:105-12; PMID:21319991; http://dx.doi.org/ 10.1089/omi.2010.0023 [DOI] [PMC free article] [PubMed] [Google Scholar]
- [49].Myers AA, Giller P. Analytical biogeography: an integrated approach to the study of animal and plant distributions. Springer Science & Business Media, 2013. [Google Scholar]
- [50].Goloboff PA. Analyzing large data sets in reasonable times: solutions for composite optima. Cladistics 1999; 15:415-28; http://dx.doi.org/ 10.1111/j.1096-0031.1999.tb00278.x [DOI] [PubMed] [Google Scholar]
- [51].Segata N, Izard J, Waldron L, Gevers D, Miropolsky L, Garrett W, Huttenhower C. Metagenomic biomarker discovery and explanation. Genome Biol 2011; 12:1-18; http://dx.doi.org/ 10.1186/gb-2011-12-S1-I1 [DOI] [PMC free article] [PubMed] [Google Scholar]
- [52].Love MI, Huber W, Anders S. Moderated estimation of fold change and dispersion for RNA-seq data with DESeq2. Genome Biol 2014; 15:550; PMID:25516281; http://dx.doi.org/ 10.1186/s13059-014-0550-8 [DOI] [PMC free article] [PubMed] [Google Scholar]
Associated Data
This section collects any data citations, data availability statements, or supplementary materials included in this article.


