

ABSTRACT
Intestinal dysbiosis is thought to confer susceptibility to inflammatory bowel disease (IBD), but it is unknown whether dynamic changes in the microbiome contribute to fluctuations in disease activity. We explored this question using mice with intestine-specific deletion of C1galt1 (also known as T-synthase) (Tsyn mice). These mice develop spontaneous microbiota-dependent colitis with a remitting/relapsing course due to loss of mucin core-1 derived O-glycans. 16S rRNA sequencing and untargeted metabolomics demonstrated age-specific perturbations in the intestinal microbiome and metabolome of Tsyn mice compare with littermate controls at weeks 3 (disease onset), 5 (during remission), and 9 (after relapse). Colitis remission corresponded to increased levels of FoxP3+RORγt+CD4+ T cells in the colonic lamina propria that were positively correlated with operational taxonomic units (OTUs) in the S24–7 family and negatively correlated with OTUs in the Clostridiales order. Relapse was characterized by marked expansion of FoxP3-RORγt+CD4+ T cells expressing IFNγ and IL17A, which were associated with Clostridiales OTUs distinct from those negatively correlated with FoxP3+RORγt+CD4+ T cells. Our findings suggest that colitis remission and relapse in the Tsyn model may reflect alterations in the microbiome due to reduced core-1 O-glycosylation that shift the balance of regulatory and pro-inflammatory T cell subsets. We investigated whether genetic variation in C1galt1 correlated with the microbiome in a cohort of 78 Crohn's disease patients and 101 healthy controls. Polymorphisms near C1galt1 (rs10486157) and its molecular chaperone, Cosmc (rs4825729), were associated with altered composition of the colonic mucosal microbiota, supporting the relevance of core-1 O-glycosylation to host regulation of the microbiome.
KEYWORDS: C1galt1, core-1 O-glycans, colitis, microbiome, T-synthase
Introduction
IBD, consisting of Crohn's disease and ulcerative colitis, is a chronic inflammatory disease of the gastrointestinal tract believed to arise from a combination of genetic susceptibility and environmental factors. A prominent role for the intestinal microbiome in the pathogenesis of IBD has been proposed based upon the resistance of germ-free mice to experimental colitis and the transmissibility of experimental colitis via the microbiome.1-3 IBD patients have reduced microbial diversity and alterations in the composition and function of the intestinal microbiome compare with healthy controls.4-7 While it has been speculated that this intestinal dysbiosis could contribute to disease development, it is unclear whether IBD-associated microbes incite disease or merely respond to the mucosal changes caused by inflammation. It is also unclear whether fluctuations in the composition of the microbiome could be related to changes in disease activity in IBD, which clinically is characterized by episodic flares.
The mechanisms of disease remission and relapse in IBD patients have been difficult to study due to the paucity of models that replicate this disease behavior. Spontaneous disease remission with subsequent relapse has been consistently observed in a model of distal-predominant colitis induced by intestinal epithelial cell deficiency of T-synthase (Tsyn; also known as core 1 β1,3 galactosyltransferase, C1galt1).8 Tsyn mice develop transient colitis immediately after weaning (3 weeks of age) which resolves by week 6 but reoccurs by week 8. Broad spectrum antibiotic treatment of Tsyn mice with vancomycin, neomycin, ampicillin, and metronizadole reduces disease severity, indicating a role for the gut microbiota. Interestingly, these disease phases are lost in the absence of adaptive immunity, replaced by monophasic colitis starting at the time of weaning. Monophasic colitis can also be induced in adult mice by inducible deletion of Tsyn in epithelial cells. This variant of the Tsyn colitis model is microbiome-dependent as colitis fails to develop under germ-free conditions and is attenuated with broad-spectrum antibiotic treatment.8,9 Monoassociation of germ-free Tsyn mice with Bacteroides thetaiotaomicron but not Bacteroides sartorii or Lactobacillus johnsonii was sufficient to restore colitis, demonstrating that colitis induction depends on specific members of the intestinal microbiome.9 A second group independently generated mice with inducible intestinal epithelial cell deletion of Tsyn that failed to develop colitis.10 This was attributed to differences in the microbiome of their facility compare with that of the initial group, highlighting the importance of microbial composition for Tsyn colitis.
It is unclear how intestinal microbes interact with the Tsyn-deficient epithelium to trigger colitis. Deficiency of core 1 O-glycans in Tsyn mice results in loss of the inner mucus gel layer, reduced Muc2 in the mucus barrier, and increased intestinal permeability to FITC-dextran prior to disease onset.8 The altered mucosal barrier may not only allow increased access to the epithelium by intestinal microbes but also shape the composition and function of the microbiome. This would be consistent with the growing literature on genetically encoded host mechanisms for gardening the microbiome.11,12 Fucosylation of mucin by α1–2 fucosyltransferase (Fut2) represents an existing precedent for gardening of the microbiome through modulation of host mucus glycosylation. Fucose is utilized as a nutrient source by some bacteria, most notably B. thetaiotaomicron, and can be scavenged from mucus by pathogens such as E. coli and Salmonella typhimurium early during infection.13-15 In addition, fucosylated mucins have been shown to serve as an attachment site for pathogens such as norovirus and Campylobacter jejuni.16,17 Fucosylation is a microbiota-dependent process that requires host sensing of microbial products via Toll-like receptors followed by secretion of IL22 by activated innate lymphoid cells, and IL22-dependent epithelial cell production of Fut2.18,19 In humans, deficiency of FUT2 – which occurs in around 20% of individuals, termed “non-secretors” – is associated with shifts in microbial composition in the colonic mucosa, feces, and bile.20-23 Tsyn deficiency could similarly affect microbial composition by altering nutrient sources and disrupting attachment sites for the intestinal microbiota.
Two groups have used pyrosequencing of luminal content from the cecum, distal colon, and feces of mice with inducible deletion of Tsyn in epithelial cells to assess for genotype-specific effects on the microbiome. Both showed subtle alterations in intestinal microbes, with one reporting 8 differential OTUs and the other only 1.9,10 However, the microbiome of mice with constitutive Tsyn deletion has not been characterized and is of interest as dynamic shifts in microbial composition after weaning could account for the distinctive disease states in this model. We performed an analysis of the microbiome, metabolome, and mucosal T cell phenotype during disease onset, remission, and relapse. Remission and subsequent relapse were associated with fluctuations in the intestinal microbiome that may shift the balance of regulatory and pro-inflammatory T cells.
Results
Disease phases of Tsyn colitis are associated with shifts in CD4+ T cell subsets
We selected 3 time points to represent the stages of Tsyn colitis: disease onset (week 3), remission (week 5), and relapse (week 9). Histologic analysis was performed on distal colons of mice at each of these time points to confirm that the kinetics reported in the initial description of the Tsyn model were reproducible in our barrier facility. The colons of mice with intestinal specific deletion of Tsyn at week 3 were characterized by surface ulceration, loss of goblet cells, and infiltration with polymorphonuclear leukocytes (Fig. 1A). At week 5, the epithelium of Tsyn mice had mostly normalized, with a histologic score that was not significantly different from that of littermate controls lacking the Cre recombinase required for intestinal specific deletion (Fig. 1A-B). By week 9, Tsyn mice had recurrent colitis characterized by deep ulceration, loss of goblet cells, crypt hyperplasia, infiltration with polymorphonuclear leukocytes, and expansion of the lamina propria with mononuclear cells.
Figure 1.

Tsyn mice have a remitting/relapsing colitis course. (A) Hematoxylin and eosin staining of sections of distal colon from Tsyn and Cre-negative littermate controls (“control”) mice at weeks 3 (onset), 5 (remission), and 9 (relapse). 20x magnification. (B) Line graphs showing the histologic score of Tsyn and control mice at weeks 3, 5, and 9. Mean +/− SEM (standard error of the mean). Significance was determined using a 2-tailed t-test. ***p < 0.0005.
It has previously been reported that these disease phases are dependent on adaptive immunity.8 This raised the possibility that regulatory T cells mediate transient remission. To investigate the immunologic mechanisms of remission and relapse further, we characterized expression of FoxP3 and RORγt by CD4+ T cells in the colonic lamina propria. These two transcription factors have been used to define regulatory and pro-inflammatory T helper subsets.24,25 3-week old Tsyn mice had a mild increase in FoxP3+RORγt+ cells, which have recently been reported to represent microbiota-induced regulatory T cells in the colon (Fig. 2A, C).26,27 Tsyn mice had an equivalent frequency of FoxP3-RORγt+CD4+ T cells as controls, but cytokine staining revealed an increased frequency of expression by these cells of the pro-inflammatory cytokines IFNγ and IL17A (Fig. 2A-D). At week 5, Tsyn mice continued to have an increased frequency of FoxP3+RORγt+ regulatory T cells but equivalent IFNγ and IL17A production by RORγt+ T cells as controls. By week 9, Tsyn mice showed a striking expansion of FoxP3-RORγt+CD4+ T cells, predominantly expressing IFNγ or both IFNγ and IL17A, with a concomitant decrease in FoxP3+RORγt+CD4+ T cells.
Figure 2.

Colitis onset, remission, and relapse in the Tsyn model are characterized by shifts in the FoxP3+ and FoxP3- subsets of RORγt+CD4+ (T)cells. (A) Flow cytometry plots showing intracellular for the transcription factors FoxP3 and RORγt in CD4+ T cells isolated from the colonic lamina propria. (B) Flow cytometry plots showing intracellular staining for IFNγ and IL17A in RORγt+CD4+ T cells isolated from the colonic lamina propria. (C) Line graphs showing the % of CD4+ T cells that are FoxP3+RORγt-, FoxP3+RORγt+, or FoxP3-RORγt+. Mean +/− SEM. Significance was determined using a 2-tailed t-test. * p < 0.05,** p < 0.01 (D) Line graphs showing the % of RORγt+CD4+ T cells that are IFNγ+IL17A-, IFNγ+IL17A+, or IL17A+IFNγ-.
Tsyn mice have age-specific alterations in the luminal and mucosal microbiome of the colon
We undertook deep 16S rRNA sequencing (median sequence depth 573,982 sequences/sample) of the luminal and mucosal microbiome to assess whether these observed shifts in T cell subsets corresponded to altered microbial composition. Weeks 3, 5, and 9 each had distinct microbial composition (Fig. 3A). The microbiome was also strongly influenced by sample type (mucosal vs. luminal) and sample site (distal colon, proximal colon, cecum, ileum). Tsyn genotype had a statistically significant effect on overall composition (p = 0.0003) across all samples. A stratified analysis was then performed to assess the Tsyn genotype effect at each time point within the mucosal and luminal compartments. Tsyn had a statistically significant effect on both the mucosal and luminal microbiota at weeks 3, 5, and 9 (Fig. 3B). Tsyn did not influence microbial diversity at weeks 5 and 9, though there was a decrease in the number of observed species (but not the Shannon index) in Tsyn mice at week 3 (data not shown).
Figure 3.

Tsyn deficiency is associated with shifts in the colonic mucosal and luminal microbiome during both active colitis and remission. (A) Principal coordinates analysis (PCoA) plots for microbial samples from Tsyn and control mice at weeks 3 (onset), 5 (remission), and 9 (relapse). Samples are colored by age, type (lumen vs. mucosa), location (Dis Col = distal colon, Pr Col = proximal colon, Cec = cecum, Ileum), and genotype. P-values for differences in β diversity were calculated by Adonis. (B) PCoA plots stratified by lumen vs. mucosa for samples from weeks 3, 5, and 9.
We then performed multivariate analysis to identify specific differentially abundant microbes in Tsyn mice compare with controls at each of the 3 time points. Week 3 was associated with change in 341 luminal and 416 mucosal OTUs, week 5 with 301 luminal and 271 mucosal OTUs, and week 9 with 553 luminal and 221 mucosal OTUs (Fig. 4A). The large number of differential OTUs at week 5 suggested that the Tsyn microbial signature was not solely secondary to colitis but also reflected an effect of the altered mucus barrier on the microbiome. Week 5 Tsyn mice had both increased and decreased abundance of many Clostridiales OTUs as well as highly abundant S24–7, Lachnospiraceae, and Oscillospira OTUs. The microbiome of these mice was enriched in Mollicutes, Lactobacillus, Anaeroplasma, Mucispirillium schaedleri, and [Ruminococcus] gnavus OTUs and depleted in Haemophilus parainfluenzae, Neisseria subflava, Streptococcus, and Acinetobacter OTUs (Fig. 4B). Week 3 Tsyn mice had increased abundance of [Eubacterium] dolichum, Sutterella, S24–7, and Proteus (shared with week 9) OTUs and decreased abundance of Clostridiales, Ruminococcaceae, Lachnospiraceae, Ruminococcus, and [Ruminococcus] gnavus OTUs (Fig. 4C). Week 9, in contrast, resembled week 5 in showing both increased and decreased abundance of many Clostridiales, S24–7, and Lachnospiraceae OTUs. There were fewer Tsyn associated Mollicutes OTUs compare with week 5 and a wider range of depleted genera, which included a number of pathobiont-associated genera such as Klebsiella, Neisseria, Fusobacterium, Acinetobacter, Pseudomonas, and Mycoplasma.
Figure 4.
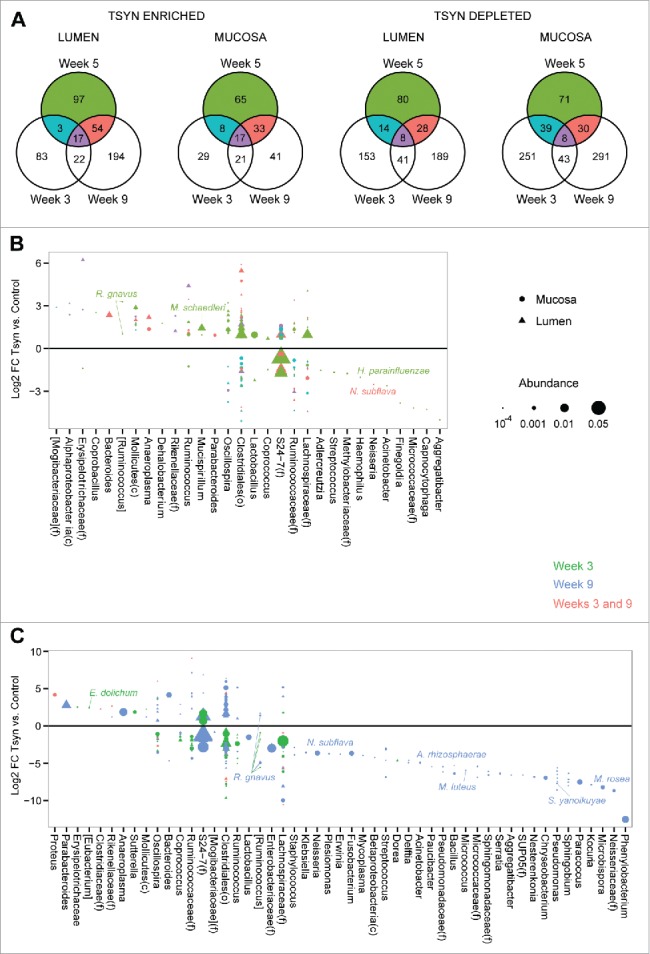
Distinct OTU shifts are seen in Tsyn mice at disease onset, remission, and relapse. (A) Venn diagrams show the number of OTUs enriched or depleted in the colonic lumen or mucosa of Tsyn vs. control mice, comparing weeks 3, 5, and 9. Differential abundance was determined from multivariate models adjusting for location (distal colon, proximal colon, cecum), and genotype. (B) Log2 fold changes (FC) for OTUs with a statistically significant difference in abundance between Tsyn and control mice at week 5 and mean normalized abundance > 10−4 in either the mucosa (dot) or lumen (triangle). Colors correspond to the Venn diagrams in panel A. Symbol size corresponds to OTU abundance. OTUs are grouped by genus or by family (f), order (o), or class (c) if they did not have an assigned genus. OTUs putatively identified at the species level are annotated. (C) Log2 FC for OTUs with a statistically significant difference in abundance between Tsyn and control mice at weeks 3 or 9 (but not week 5) and mean normalized abundance > 10−4 in either the mucosa or lumen.
Tsyn deficiency affects the intestinal metabolome
We evaluated the functional consequences of the shifts in microbial composition at weeks 3, 5, and 9 using untargeted metabolomics. As with microbial composition, metabolomics profiles were affected predominantly by time point and secondarily by sample site (Fig. 5A). The effect of genotype on the metabolome was significant when analyzing all the samples together (p = 0.01) and when all 3 time points were analyzed separately (Fig. 5B). Week 3 was associated with change in 60 metabolites, week 5 with 120 metabolites, and week 9 with 88 metabolites (Fig. 5C). There was overlap of 24 metabolites between weeks 5 and 9 but minimal overlap between week 3 and either of the 2 other time points. Week 3 was characterized by increased levels of metabolites putatively identified as arachidonate and one of its bioactive derivatives, leukotriene F4, and reduced purine metabolites putatively identified as inosine and aminoimidazole ribotide (Fig. 5D). Shifts in putative bile acids included increased taurocholate, decreased cholic acid, and decreased 3α,7α,12α−Trihydroxy−5β−cholestanoate at week 5 and decreased chenodeoxycholate and cholic acid at week 9. Omega 6-fatty acids were also affected, with increased linoleate at week 5 and decreased docosatetraenoic acid and docosapentaenoic acid at weeks 5 and 9.
Figure 5.

Tsyn mice have age-dependent alterations in the colonic metabolome. (A) PCoA plots for metabolomics data from Tsyn and control mice at weeks 3 (disease onset), 5 (remission), and 9 (relapse). Samples are colored by age, location, and genotype. P-values for the difference in metabolomics profiles across all groups were calculated by Adonis. (B) PCoA plots for metabolomics data stratified by age. (C) Venn diagrams show the number of metabolites enriched or depleted in Tsyn vs. control mice, comparing weeks 3, 5, and 9. Differential abundance was determined from multivariate models adjusting for location (distal colon, cecum) and genotype. (D) Log2 FC for metabolites with a statistically significant difference in abundance between Tsyn and control mice at week 3, 5, or 9. Metabolites overlapping between weeks are plotted based upon FC at week 9. The lower panel shows the density of detected spectral features by retention time. Metabolites with a putative identification based upon m/z are annotated.
Clostridiales and S24–7 OTUs are associated with the FoxP3+RORγt+ and RORγt+FoxP3- CD4+ T cell subsets
We then investigated whether shifts in the intestinal microbiome and metabolome in Tsyn mice were associated with CD4+ T cell immunophenotype during the 3 time points. We constructed correlation networks with nodes representing luminal microbes, mucosal microbes, and metabolites that were differentially abundant by Tsyn genotype at week 5 in multivariate models (Fig. 6A). Microbes and metabolites were only included in the network if they also correlated with the frequency of FoxP3+RORγt+ CD4+ T cells across all 3 time points after adjustment for age, sample location, and Tsyn genotype. Edges represent statistically significant correlations of the residuals of microbes and metabolites from multivariate models incorporating age, sample site, and genotype. The correlation network highlighted an association of FoxP3+RORγt+ CD4+ T cells with a co-correlated set of 8 S24–7 OTUs that were reduced in Tsyn mice at week 5 compare with controls (Fig. 6A). These OTUs were inversely correlated with 3 metabolites - including 2 putatively identified as 4,8-dihydroxyquinoline - that had increased abundance in Tsyn mice at week 5. FoxP3+RORγt+ T cells were negatively associated with Clostridiales and Ruminococcaceae, of which 7 out of 10 Clostridiales and 3 out of 4 Ruminococcaceae had increased abundance in Tsyn mice at week 5.
Figure 6.
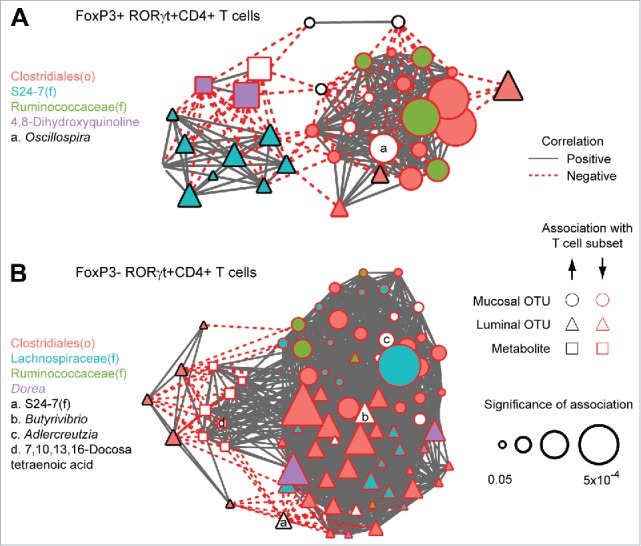
FoxP3+ and FoxP3- RORγt+CD4+ (T) cells are associated with the abundance of Clostridiales and S24–7 OTUs. (A) Nodes represent luminal OTUs, mucosal OTUs, and metabolites that are differentially abundant in Tsyn mice at week 5 and significantly associated with the frequency of FoxP3+RORγt+CD4+ T cells after adjustment for time point, genotype, and location. Node size reflects the significance of association (q-values). Edges represent statistically significant correlations (q<0.05) between nodes after adjustment for time point, genotype, and location. Microbial taxa and metabolites are labeled by fill color or letters. (B) Network depicting microbes and metabolites that are differentially abundant in Tsyn mice at weeks 3 and/or 9 (but not week 5) associated with FoxP3-RORγt+CD4+ T cells.
A second correlation network was constructed for luminal microbes, mucosal microbes, and metabolites that were associated with Tsyn colitis at weeks 3 and 9 but was not associated with Tsyn genotype at week 5 (Fig. 6B). Microbes and metabolites were included if they correlated with the frequency of FoxP3-RORγt+ CD4+ T cells across all 3 time points after adjustment for time point, sample location, and gender. FoxP3-RORγt+ T cells were positively correlated with 5 luminal Clostridiales OTUs that had increased abundance in Tsyn mice compare with controls. The remaining microbes, including many other Clostridiales OTUs, and metabolites (including one identified as docosatetraenoic acid) were negatively correlated with RORγt+ T cells. These negatively associated microbes had reduced or unaffected abundance in Tsyn mice at week 9.
Single nucleotide polymorphisms (SNPs) near Tsyn and its molecular chaperone, Cosmc, are associated with colonic mucosal microbiome composition in humans
Our findings of altered microbial composition in mice lacking epithelial Tsyn led us to investigate whether genetic variation in Tsyn was associated with the composition of the colonic microbiome in humans. We investigated this using the previously described MLI cohort, consisting of colonic mucosal samples from 78 patients with Crohn's disease and 101 healthy controls genotyped using the Immunochip.28 We evaluated the association with the microbiome of a SNP near the Tsyn gene, rs10486157 on chromosome 7, with a minor allele frequency (G) in Crohn's disease patients of 0.31 and in healthy controls of 0.28. We also studied a SNP, rs4825729 on the X chromosome, near the gene for Cosmc (core-1 β1,3 galactosyltransferase–specific chaperone 1, C1galt1C1), an endoplasmic reticulum chaperone required for Tsyn expression.29 The minor allele frequency (A) of the Cosmc SNP in Crohn's patients was 0.21 and in healthy controls was 0.44. Each SNP was found to have a statistically significant association with the composition of the colonic mucosal microbiome in both Crohn's disease patients and healthy controls (Fig. 7A). Homozygote or heterozygote healthy carriers of the Tsyn minor allele were found to have increased levels of the butyrate producing bacteria Faecalibacterium prausnitzii and Roseburia faecis and decreased levels of Veillonella species and Haemophilus parainfluenzae (Fig. 7B). Healthy Cosmc carriers had increased levels of Enterobacteriaceae, Lachnospiraceae, Eggerthella lenta, [Ruminococcus] gnavus, Serratia marcescens, Enterobacter hormaechei, Veillonella parvula, and Haemophilus parainfluenza. There was little overlap in the specific microbes associated with the minor alleles of the Tsyn and Cosmc SNPs, suggesting that each had distinct functional consequences.
Figure 7.

Common SNPs near the Tsyn and Cosmc loci are associated with alterations in the colonic mucosal microbiome of Crohn's disease patients and healthy controls. (A) PCoA plots are shown for colonic mucosal samples from patients with Crohn's disease and healthy controls, colored by genotype for SNPs located near the Tsyn and Cosmc loci. Homozygous refers to having 2 copies of the minor allele, or one copy of the X-linked Cosmc SNP in males. P-values were calculated by Adonis. (B) Log2 FC in healthy controls between Tsyn and Cosmc homozygotes and non-carriers of the minor allele for OTUs with q<0.05. OTUs are only shown if they also had a statistically significant difference in abundance between heterozygotes and non-carriers and had mean normalized abundance > 10−4. Dot size corresponds to OTU abundance.
Discussion
We found that disease onset, remission, and relapse in the Tsyn colitis model were characterized by genotype-related and temporal fluctuations in the microbiome, in particular in unclassified members of the Clostridiales order. Tsyn mice in remission at week 5 had an expanded population of FoxP3+ RORγt+ regulatory T cells that may mediate remission. However, these mice also had decreased levels of S24–7 and Clostridiales OTUs associated with FoxP3+ RORγt+ T cells. This alteration in the microbiome may have contributed to the normalization of the FoxP3+ RORγt+ colonic regulatory T cell subset by week 9. Disease relapse in week 9 Tsyn mice corresponded to a dramatic increase in IFNγ- and IL17A-expressing FoxP3-RORγt+CD4+ T cells. These cells were correlated with a subset of Clostridiales that were elevated at week 9 and inversely correlated with other Clostridiales OTUs that were depleted at week 9. It is possible that Tsyn-mediated changes in the unclassified Clostridiales OTUs associated with weeks 5 and 9 affect T cell phenotype, in particular altering the balance between differentiation of the FoxP3+ regulatory and FoxP3- pro-inflammatory subsets of RORγt+ T cells. This is in line with evidence that Clostridia from the mouse and human intestines induce regulatory T cells.30,31 Clostridiales OTUs that were positively correlated with RORγt+CD4+ T cells may induce IL17A-producing RORγt+CD4+ T cells in a similar manner as another group of Clostridiales - segmented filamentous bacteria.32 It has recently been shown that induction of IL17A-producing RORγt+CD4+ T cells is mediated by epithelial adhesion.33 Negatively correlated Clostridiales may compete with these microbes for the same niche. These suggestive associations warrant further investigation in gnotobiotic mouse models to determine if selective colonization with these unclassified members of the Clostridiales order can influence T cell phenotype and disease severity in Tsyn mice. Interestingly, week 9 Tsyn mice had reduced levels of genera associated with pathobionts including Klebsiella, Neisseria, Fusobacterium, Acinetobacter, Pseudomonas, and Mycoplasma, perhaps due to mucosal gardening by the expanded population of FoxP3-RORγt+ CD4+ T cells. This highlights the need to interpret microbiome data in the context of host immune system-microbiome interactions rather than simply by levels of suspected pathobionts.
Metabolite shifts were seen in the colonic lumen at each phase of Tsyn colitis. The vast majority of detected metabolites could not be identified – including most of those associated with FoxP3+RORγt+ regulatory T cells or FoxP3-RORγt+CD4+ T cells. Unknown signals similarly dominated the results of a prior mouse cecal metabolomics study and may represent novel microbial products, highlighting the need for further characterization of the tremendous chemical diversity of the bacterial metabolome.34,35 Many of the putatively identified metabolites associated with Tsyn status are of host origin, possibly modulated by microbial signals. For instance, arachidonate, elevated in the colon of week 3 Tsyn mice, is produced via phospholipase A2 in response to bacteria.36 Bile acid levels have recently been shown to be influenced by intestinal microbes through their direct metabolism of primary bile acids and consequent modulation of intestinal FXR signaling.37 Tsyn mice had a primary bile acid profile (increased taurocholic acid at week 5 and decreased cholic acid at weeks 5 and 9) that mirrored changes in mice treated with antibiotics.37 This may reflect reduced metabolic activity of host glycan-scavenging microbes that are deprived of substrate in Tsyn mice due to mucus barrier deficiency. However, the specific metabolic signature of these microbes is challenging to identify as microbial metabolism differs greatly between monocultures and complex in vivo ecosystems.38 Existing metabolomics studies of humans with expansion of mucolytic organisms such as Akkermansia have not shown consistent metabolite signatures.39,40
Although the Tsyn and Cosmc SNPs described here were not found to be associated with IBD in a large meta-analysis of Immunochip data, the SNP-associated changes in the colonic mucosal microbiome are reminiscent of changes seen in IBD patients.41 In particular, Cosmc minor allele carriers had changes paralleling IBD including increased Enterobacteriaceae, Veillonella parvula, and H. parainfluenzae.6 While these microbial changes in and of themselves do not predispose to IBD, they suggest that genetic variation in the mucosal barrier may recapitulate some of the microbial shifts that occur in IBD patients. Tsyn minor allele carriers had opposite shifts in the microbiome as IBD patients, who have decreased F. prausnitzii and Roseburia and increased Veillonella parvula and H. parainfluenzae.6 This could potentially represent microbial gardening by this Tsyn variant that promotes a beneficial ecosystem. It will be of great interest in future genetic meta-analyses to assess whether genetic variants affecting mucin O-glycosylation influence risk for other microbiome-related diseases such as obesity, diabetes, and metabolic syndrome.42
Remission and relapse in IBD patients may be induced by fluctuations in microbial populations that affect mucosal T cell activity analogous to what we have observed in Tsyn mice. Microbial perturbations could arise due to dietary changes, use of antibiotics, and other lifestyle disruptions such as jet lag.43-45 Our results in the Tsyn model provide preclinical evidence that fluctuations in microbiota may be related to mucosal immunophenotype and disease activity. This warrants follow-up translational studies to assess mucosal immune populations, microbial composition, and intestinal metabolites in longitudinally followed IBD patients. Fluctuating microbial populations and metabolites that skew T cells to a regulatory or inflammatory phenotype could be used as biomarkers for risk of disease flares as well as potential therapeutic targets.
Materials and methods
Animal experiments
Mice homozygous for floxed T-synthase on the C57BL/6 background with or without one copy of the villin-Cre transgene were bred in a specific pathogen free barrier facility at UCLA. Cre-expressing offspring (referred to as “Tsyn” mice) and Cre-negative littermates (“Control” mice) were co-housed by litter and sex. Mice were sacrificed at 3, 5, and 9 weeks of age. Each time point contained 4–6 mice per group. This research was performed under UCLA ARC protocol 2003–014.
Mucosal-luminal interface (MLI) cohort
The MLI cohort consists of 78 patients with known Crohn's disease in clinical remission undergoing colonoscopy and 101 healthy controls presenting for screening colonoscopy. Informed consent was obtained prior to colonoscopy. Mucosal washes using deionized water were obtained from the cecum and sigmoid colon of subjects as previously described.28 Lavaged material was then centrifuged at 5000 g for 15 minutes. The pelleted material was used for 16S rRNA sequencing. DNA extracted from peripheral blood was applied to the Immunochip, a custom platform containing nearly 200,000 single nucleotide polymorphisms near genes related to immune function and inflammatory disease.46 Two SNPs of interest were identified and analyzed further: rs10486157, located on chromosome 7 (hg19 position 7350683) in an intergenic region between C1GALT1 and COL28A1, and rs4825729, located on chromosome X (hg19 position 119789954) in an intergenic region between C1GALT1C1 and CT47.13. This study was performed under UCLA IRB protocol 11–002093.
Mucosal and luminal microbial collection
The small intestine and colon were dissected from sacrificed mice then divided into regions (cecum, proximal colon, distal colon, ileum). A 0.5 cm fragment of each was placed in formalin for subsequent paraffin embedding and hematoxylin/eosin (H&E) staining. Each region was then cut into 1 cm fragments that were lavaged repeatedly with 1 mL deionized water. Lavaged material was spun at maximum speed in a microcentrifuge for 2 minutes. The supernatant was collected then frozen at −80°C for metabolomics and the pellet frozen for future DNA extraction (representing luminal microbiota). Tissue fragments after lavage were placed in DMEM + 10% fetal calf serum (D10F) then cut lengthwise to release residual luminal content. After removal of visible luminal content, the intestinal fragments were washed 3 times in D10F then placed in D10F with 1mM DTT (D0632, Sigma-Aldrich) for 40 minutes in an incubator shaker at 37°C. After incubation, tissue fragments were vortexed to release epithelial cells and the cell suspension was passed through a 70 micron cell strainer. The filtrate was then centrifuged at 5000 g for 15 minutes to pellet epithelial cells and mucus. The supernatant was removed and the cells resuspended in buffer (200 mM Tris-HCl pH 8.0, 200 mM NaCl, 20 mM EDTA) then frozen at −80°C for future DNA extraction (representing mucosal microbiota).
Colonic lamina propria lymphocyte isolation
Colonic tissue was processed as described earlier to isolate mucosal microbial samples. After vortexing, DTT treated tissue fragments were minced with a razor, rinsed with D10F, and incubated in D10F with 0.5 mg/mL collagenase D (11088882001, Sigma-Aldrich), DNase I (04716728001, Roche), and dispase (17105041, Gibco) for 40 minutes in an incubator shaker at 37°C. The digestion media was then passed through a 70 micron cell strainer. Collected tissue fragments were mechanically disrupted with a syringe plunger, then rinsed with D10F to release cells. The cell suspension was pelleted, resuspended with 40% Percoll (GE17–0891, Sigma-Aldrich) in DMEM, then layered carefully over 80% Percoll. Tubes containing the Percoll gradients were centrifuged at 2500 rpm in a Sorvall Legend X1 (Thermo, Waltham, MA) for 30 minutes. The interphase layer was then aspirated using a transfer pipette, diluted with D10F, spun down, and resuspended in D10F.
Flow cytometry
Two thirds of the colonic lamina propria cells were then incubated in a humidified 37°C CO2 incubator for 4 hours in D10F supplemented with leukocyte activation cocktail (550583, BD) at a concentration of 2 μL per mL media. The restimulated cells and the remaining one third of the sample that remained unstimulated were stained with antibodies against CD3 (15–0031, eBioscience), CD19 (47–0193, eBioscience), and CD4 (17–0041, eBioscience). T cells were identified as having a CD3+CD19- phenotype. The cells then underwent fixation/permeabilization using a kit (00–5523, eBioscience) followed by intracellular staining with antibodies against IL-17A (12–7177, eBioscience) and IFNγ (53–7311, eBioscience) for restimulated cells or FoxP3 (53–4774, eBioscience) and RORγt (12–6981, eBioscience) for unstimulated cells. Multicolor flow cytometry data was acquired using the LSRII (BD, Franklin Lakes, NJ).
Histologic scoring
H&E stained sections from the distal colon were numerically coded and scored by a single blinded investigator. The histology score was calculated from the sum of 4 metrics (total scale 0–12). Mucin depletion: 0 = normal number of goblet cells, 1 = patchy foci of reduced goblet cells, 2 = widespread loss of goblet cells. Epithelial reactivity: 0 = normal, 1 = rare foci of hyperplasia or atypia (< 5% of the epithelial surface), 2 = moderate epithelial reactivity (5–25%), 3 = widespread reactive changes (> 25%). Inflammation: 0 = normal, 1 = rare scattered inflammatory foci without ulceration, 2 = patchy ulceration and inflammatory foci affecting <25% of the colonic surface, 3 = ulceration or inflammatory foci affecting 25–50% of the colonic surface, 4 = ulceration or inflammatory foci affecting >50% of the colonic surface. Depth of inflammation: 0 = no ulceration or inflammatory foci, 1 = mucosal, 2 = submucosal, 3 = muscularis propria or transmural.
16S rRNA gene sequencing
Genomic DNA extraction, amplification of the V4 region of 16S rRNA (rRNA) genes, and single-end sequencing on an Illumina HiSeq 2000 were performed as described previously.47 The 101 base pair reads were processed using QIIME v1.7.0 with default parameters.48 For the 200 mouse samples, the number of reads per sample ranged from 83,846 to 1,016,824, with a median of 573,982. For the 357 MLI samples, the number of reads per sample ranged from 56,334 to 1,034,462, with a median of 601,470. Sequence data has been submitted to NCBI under BioProject PRJNA318692. Operational taxonomic units were picked against the May 2013 version of the Greengenes database (http://greengenes.secondgenome.com), pre-filtered at 97% identity. α and β diversity were assessed using data rarefied to 165,075 (for analyses using mouse data), or 126,884 (for MLI analysis) sequences. Principal coordinates analysis (PCoA) was performed with distance matrices calculated using unweighted UniFrac.49 Adonis with 100,000 permutations was used to assess statistical significance of differences in β diversity.
Ultra-performance liquid chromatography/time of flight mass spectrometry (UPLC/ToFMS)
The lavage supernatants were diluted 1:5 in 55% acetonitrile/water then centrifuged at 16000 g for 10 minutes to isolate the protein pellet. The supernatants were transferred to new glass tubes, dried under a gentle stream of N2, and resuspended in 100 μL of water and 0.1% formic acid (solvent A). The MS analysis was performed by injecting 2 μL aliquots of each sample into a reverse-phase 50 × 2.1 mm H-class UPLC Acquity 1.7-μM BEH C18 column coupled to ToFMS. The mobile phase consisted of solvent A, 100% acetonitrile (solvent B), and isopropanol/acetonitrile (90:10 v:v) with 10 mM ammonium formate (solvent C). The Xevo G2-S mass spectrometer (Waters Corp, Milford, MA) was operated in the positive and negative electrospray ionization modes scanning a 50–1200 m/z range. The following 13 minute gradient was used: 95%/5% solvent A/solvent B at 0.45 ml/min for 8 minutes, 2%/98% solvent A/solvent B for 1 minute, 2%/98% solvent B/solvent C for 1.5 minutes, 50%/50% solvent A/solvent B for 1.5 minutes, and 95%/5% solvent A/solvent B for the remaining half a minute. The lock-spray consisted of leucine-enkephalin (556.2771 [M+H]+ and 554.2615 [M-H]−). The MS data were acquired in centroid mode and processed using MassLynx software (Waters Corp) to construct a data matrix consisting of the retention time, m/z, and abundance value (via the peak area normalized to protein concentration) for each ion. A total of 2246 ions in the positive mode and 2733 ions in the negative mode were detected. PCoA of ion abundance data was performed with distance matrices calculated using the square root of the Jensen-Shannon divergence. Our in-house statistical analysis program was used to putatively identify ions from m/z values with a mass error of 20 ppm (ppm) or less, utilizing the Kyoto Encyclopedia of Genes and Genomes database.
Differential abundance testing
16S sequence data and UPLC-ToFMS metabolomics data were filtered to remove OTUs and spectral features present in less than 10% of samples. The resulting filtered data sets were analyzed using the DESeq2 algorithm, which employs an empirical Bayesian approach to shrink dispersion.50 Log fold changes were fitted to a general linear model under a negative binomial model. Covariates included age, sample location, and genotype for Tsyn experiments and sample site, gender, obesity (obese vs. overweight vs. normal weight), and genotype for the MLI cohort. P-values for variables in the linear models (e.g. genotype) were converted to q-values to correct for multiple hypothesis testing.51 Q-values below 0.05 were considered significant.
Network analysis
Spearman correlation coefficients were calculated between the percentage of CD4+ T cells with the phenotype of interest (FoxP3+RORγt+ or RORγt+FoxP3-) and the abundance of Tsyn-associated OTUs and spectral features. These correlations were obtained using the residuals of multivariate models incorporating age, sample location, and genotype. P-values were computed for Spearman correlation coefficients based upon the asymptotic t approximation and were then converted to q-values. OTUs and metabolites with a q-value less than 0.05 were used as nodes to construct networks. Edges represented statistically significant Spearman correlation coefficients between 2 nodes using residuals from multivariate models. Networks were visualized and annotated in Cytoscape 3.2.1 (http://cytoscape.org).
Disclosure of potential conflicts of interest
No potential conflicts of interest were disclosed.
Funding
This work was funded by NIH/NIDDK R01DK085691. J.P.J. was supported by NIH/NIDDK T32DK07180–39. D.P.B.M. was supported by The European Union, The Joshua L. and Lisa Z. Greer Chair in IBD Genetics, and NIH grants DK062413, DK046763–19, AI067068, and HS021747. The research described was supported by NIH/National Center for Advancing Translational Science (NCATS) UCLA CTSI Grant Number UL1TR001881.
Authors' contributions
J.P.J., J.Br., and L.X. designed the study. J.P.J. and L.L. collected mouse samples and performed flow cytometry. D.P.B.M. recruited MLI subjects and performed genetic analysis. M.G. and A.F. performed metabolomics. P.R. and J.Bo. performed 16S rRNA sequencing. J.P.J. performed bioinformatic analysis. J.P.J. and J.Br. prepared the manuscript.
References
- [1].Sellon RK, Tonkonogy S, Schultz M, Dieleman LA, Grenther W, Balish E, Rennick DM, Sartor RB. Resident enteric bacteria are necessary for development of spontaneous colitis and immune system activation in interleukin-10-deficient mice. Infect Immunity 1998; 66(11):5224-31. Epub 1998/October/24; PMID:9784526 [DOI] [PMC free article] [PubMed] [Google Scholar]
- [2].Garrett WS, Lord GM, Punit S, Lugo-Villarino G, Mazmanian SK, Ito S, Glickman JN, Glimcher LH. Communicable ulcerative colitis induced by T-bet deficiency in the innate immune system. Cell 2007; 131(1):33-45. Epub 2007/October/10; PMID:17923086; http://dx.doi.org/ 10.1016/j.cell.2007.08.017 [DOI] [PMC free article] [PubMed] [Google Scholar]
- [3].Elinav E, Strowig T, Kau AL, Henao-Mejia J, Thaiss CA, Booth CJ, Peaper DR, Bertin J, Eisenbarth SC, Gordon JI, et al.. NLRP6 inflammasome regulates colonic microbial ecology and risk for colitis. Cell 2011; 145(5):745-57. Epub 2011/May/14; PMID:21565393; http://dx.doi.org/ 10.1016/j.cell.2011.04.022 [DOI] [PMC free article] [PubMed] [Google Scholar]
- [4].Willing BP, Dicksved J, Halfvarson J, Andersson AF, Lucio M, Zheng Z, Järnerot G, Tysk C, Jansson JK, Engstrand L. A pyrosequencing study in twins shows that gastrointestinal microbial profiles vary with inflammatory bowel disease phenotypes. Gastroenterol 2010; 139(6):1844-54 e1. Epub 2010/September/08; PMID:20816835; http://dx.doi.org/ 10.1053/j.gastro.2010.08.049 [DOI] [PubMed] [Google Scholar]
- [5].Morgan XC, Tickle TL, Sokol H, Gevers D, Devaney KL, Ward DV, Reyes JA, Shah SA, LeLeiko N, Snapper SB, et al.. Dysfunction of the intestinal microbiome in inflammatory bowel disease and treatment. Genome Biol 2012; 13(9):R79. Epub 2012/September/28; PMID:23013615; http://dx.doi.org/ 10.1186/gb-2012-13-9-r79 [DOI] [PMC free article] [PubMed] [Google Scholar]
- [6].Gevers D, Kugathasan S, Denson LA, Vazquez-Baeza Y, Van Treuren W, Ren B, Schwager E, Knights D, Song SJ, Yassour M, et al.. The treatment-naive microbiome in new-onset Crohn's disease. Cell Host Microbe 2014; 15(3):382-92. Epub 2014/March/19; PMID:24629344; http://dx.doi.org/ 10.1016/j.chom.2014.02.005 [DOI] [PMC free article] [PubMed] [Google Scholar]
- [7].Lewis JD, Chen EZ, Baldassano RN, Otley AR, Griffiths AM, Lee D, Bittinger K, Bailey A, Friedman ES, et al.. Inflammation, antibiotics, and diet as environmental stressors of the gut microbiome in pediatric Crohn's Disease. Cell Host Microbe 2015; 18(4):489-500; PMID:26468751; http://dx.doi.org/ 10.1016/j.chom.2015.09.008 [DOI] [PMC free article] [PubMed] [Google Scholar]
- [8].Fu J, Wei B, Wen T, Johansson ME, Liu X, Bradford E, Thomsson KA, McGee S, Mansour L, Tong M, et al.. Loss of intestinal core 1-derived O-glycans causes spontaneous colitis in mice. J Clin Invest 2011; 121(4):1657-66. Epub 2011/March/09; PMID:21383503; http://dx.doi.org/ 10.1172/JCI45538 [DOI] [PMC free article] [PubMed] [Google Scholar]
- [9].Perez-Munoz ME, Bergstrom K, Peng V, Schmaltz R, Jimenez-Cardona R, Marsteller N, McGee S, Clavel T, Ley R, Fu J, et al.. Discordance between changes in the gut microbiota and pathogenicity in a mouse model of spontaneous colitis. Gut Microbes 2014; 5(3):286-95; PMID:24662098; http://dx.doi.org/ 10.4161/gmic.28622 [DOI] [PMC free article] [PubMed] [Google Scholar]
- [10].Sommer F, Adam N, Johansson ME, Xia L, Hansson GC, Backhed F. Altered mucus glycosylation in core 1 O-glycan-deficient mice affects microbiota composition and intestinal architecture. PloS One 2014; 9(1):e85254; PMID:24416370; http://dx.doi.org/ 10.1371/journal.pone.0085254 [DOI] [PMC free article] [PubMed] [Google Scholar]
- [11].Jacobs J, Braun J. Host genes and their effect on the intestinal microbiome garden. Genome Med 2014; 6(12):119; PMID:25593597; http://dx.doi.org/ 10.1186/s13073-014-0119-x [DOI] [PMC free article] [PubMed] [Google Scholar]
- [12].Jacobs JP, Braun J. Immune and genetic gardening of the intestinal microbiome. FEBS Letters 2014; 588(22):4102-11; PMID:24613921; http://dx.doi.org/ 10.1016/j.febslet.2014.02.052 [DOI] [PMC free article] [PubMed] [Google Scholar]
- [13].Martens EC, Lowe EC, Chiang H, Pudlo NA, Wu M, McNulty NP, Abbott DW, Henrissat B, Gilbert HJ, Bolam DN, et al.. Recognition and degradation of plant cell wall polysaccharides by two human gut symbionts. PLoS Biology 2011; 9(12):e1001221. Epub 2011/December/30; PMID:22205877; http://dx.doi.org/ 10.1371/journal.pbio.1001221 [DOI] [PMC free article] [PubMed] [Google Scholar]
- [14].Pacheco AR, Curtis MM, Ritchie JM, Munera D, Waldor MK, Moreira CG, Sperandio V. Fucose sensing regulates bacterial intestinal colonization. Nature 2012; 492(7427):113-7. Epub 2012/November/20; PMID:23160491; http://dx.doi.org/ 10.1038/nature11623 [DOI] [PMC free article] [PubMed] [Google Scholar]
- [15].Ng KM, Ferreyra JA, Higginbottom SK, Lynch JB, Kashyap PC, Gopinath S, Naidu N, Choudhury B, Weimer BC, Monack DM, et al.. Microbiota-liberated host sugars facilitate post-antibiotic expansion of enteric pathogens. Nature 2013; 502(7469):96-9. Epub 2013/September/03; PMID:23995682; http://dx.doi.org/ 10.1038/nature12503 [DOI] [PMC free article] [PubMed] [Google Scholar]
- [16].Lindesmith L, Moe C, Marionneau S, Ruvoen N, Jiang X, Lindblad L, Stewart P, LePendu J, Baric R. Human susceptibility and resistance to Norwalk virus infection. Nat Med 2003; 9(5):548-53. Epub 2003/April/15; PMID:12692541; http://dx.doi.org/ 10.1038/nm860 [DOI] [PubMed] [Google Scholar]
- [17].Ruiz-Palacios GM, Cervantes LE, Ramos P, Chavez-Munguia B, Newburg DS. Campylobacter jejuni binds intestinal H(O) antigen (Fuc alpha 1, 2Gal beta 1, 4GlcNAc), and fucosyloligosaccharides of human milk inhibit its binding and infection. J Biol Chem 2003; 278(16):14112-20. Epub 2003/February/04; PMID:12562767; http://dx.doi.org/ 10.1074/jbc.M207744200 [DOI] [PubMed] [Google Scholar]
- [18].Pickard JM, Maurice CF, Kinnebrew MA, Abt MC, Schenten D, Golovkina TV, Bogatyrev SR, Ismagilov RF, Pamer EG, Turnbaugh PJ, et al.. Rapid fucosylation of intestinal epithelium sustains host-commensal symbiosis in sickness. Nature 2014; 514(7524):638-41; PMID:25274297; http://dx.doi.org/ 10.1038/nature13823 [DOI] [PMC free article] [PubMed] [Google Scholar]
- [19].Goto Y, Obata T, Kunisawa J, Sato S, Ivanov II, Lamichhane A, Takeyama N, Kamioka M, Sakamoto M, Matsuki T, et al.. Innate lymphoid cells regulate intestinal epithelial cell glycosylation. Science 2014; 345(6202):1254009; PMID:25214634; http://dx.doi.org/ 10.1126/science.1254009 [DOI] [PMC free article] [PubMed] [Google Scholar]
- [20].Rausch P, Rehman A, Kunzel S, Hasler R, Ott SJ, Schreiber S, Rosenstiel P, Franke A, Baines JF. Colonic mucosa-associated microbiota is influenced by an interaction of Crohn disease and FUT2 (Secretor) genotype. Proc Natl Acad Sci U S A 2011; 108(47):19030-5. Epub 2011/November/10; PMID:22068912; http://dx.doi.org/ 10.1073/pnas.1106408108 [DOI] [PMC free article] [PubMed] [Google Scholar]
- [21].Wacklin P, Makivuokko H, Alakulppi N, Nikkila J, Tenkanen H, Rabina J, Partanen J, Aranko K, Mättö J. Secretor genotype (FUT2 gene) is strongly associated with the composition of Bifidobacteria in the human intestine. PloS One 2011; 6(5):e20113. Epub 2011/June/01; PMID:21625510; http://dx.doi.org/ 10.1371/journal.pone.0020113 [DOI] [PMC free article] [PubMed] [Google Scholar]
- [22].Folseraas T, Melum E, Rausch P, Juran BD, Ellinghaus E, Shiryaev A, Laerdahl JK, Ellinghaus D, Schramm C, Weismüller TJ, et al.. Extended analysis of a genome-wide association study in primary sclerosing cholangitis detects multiple novel risk loci. J Hepatol 2012; 57(2):366-75. Epub 2012/April/24; PMID:22521342; http://dx.doi.org/ 10.1016/j.jhep.2012.03.031 [DOI] [PMC free article] [PubMed] [Google Scholar]
- [23].Tong M, McHardy I, Ruegger P, Goudarzi M, Kashyap PC, Haritunians T, Li X, Graeber TG, Schwager E, Huttenhower C, et al.. Reprograming of gut microbiome energy metabolism by the FUT2 Crohn's disease risk polymorphism. ISME J 2014; 8(11):2193-206; PMID:24781901; http://dx.doi.org/ 10.1038/ismej.2014.64 [DOI] [PMC free article] [PubMed] [Google Scholar]
- [24].Burzyn D, Benoist C, Mathis D. Regulatory T cells in nonlymphoid tissues. Nat Immunol 2013; 14(10):1007-13; PMID:24048122; http://dx.doi.org/ 10.1038/ni.2683 [DOI] [PMC free article] [PubMed] [Google Scholar]
- [25].Zuniga LA, Jain R, Haines C, Cua DJ. Th17 cell development: from the cradle to the grave. Immunol Rev 2013; 252(1):78-88; PMID:23405896; http://dx.doi.org/ 10.1111/imr.12036 [DOI] [PubMed] [Google Scholar]
- [26].Sefik E, Geva-Zatorsky N, Oh S, Konnikova L, Zemmour D, McGuire AM, Burzyn D, Ortiz-Lopez A, Lobera M, Yang J, et al.. MUCOSAL IMMUNOLOGY. Individual intestinal symbionts induce a distinct population of RORgamma(+) regulatory T cells. Science 2015; 349(6251):993-7; PMID:26272906; http://dx.doi.org/ 10.1126/science.aaa9420 [DOI] [PMC free article] [PubMed] [Google Scholar]
- [27].Ohnmacht C, Park JH, Cording S, Wing JB, Atarashi K, Obata Y, Gaboriau-Routhiau V, Marques R, Dulauroy S, Fedoseeva M, et al.. MUCOSAL IMMUNOLOGY. The microbiota regulates type 2 immunity through RORgammat(+) T cells. Science 2015; 349(6251):989-93; PMID:26160380. [DOI] [PubMed] [Google Scholar]
- [28].McHardy IH, Goudarzi M, Tong M, Ruegger PM, Schwager E, Weger JR, Graeber TG, Sonnenburg JL, Horvath S, Huttenhower C, et al.. Integrative analysis of the microbiome and metabolome of the human intestinal mucosal surface reveals exquisite inter-relationships. Microbiome 2013; 1(1):17. Epub 2014/January/24; PMID:24450808; http://dx.doi.org/ 10.1186/2049-2618-1-17 [DOI] [PMC free article] [PubMed] [Google Scholar]
- [29].Ju T, Aryal RP, Stowell CJ, Cummings RD. Regulation of protein O-glycosylation by the endoplasmic reticulum-localized molecular chaperone Cosmc. J Cell Biol 2008; 182(3):531-42; PMID:18695044; http://dx.doi.org/ 10.1083/jcb.200711151 [DOI] [PMC free article] [PubMed] [Google Scholar]
- [30].Atarashi K, Tanoue T, Shima T, Imaoka A, Kuwahara T, Momose Y, Cheng G, Yamasaki S, Saito T, Ohba Y, et al.. Induction of colonic regulatory T cells by indigenous Clostridium species. Science 2011; 331(6015):337-41. Epub 2011/January/06; PMID:21205640; http://dx.doi.org/ 10.1126/science.1198469 [DOI] [PMC free article] [PubMed] [Google Scholar]
- [31].Atarashi K, Tanoue T, Oshima K, Suda W, Nagano Y, Nishikawa H, Fukuda S, Saito T, Narushima S, Hase K, et al.. Treg induction by a rationally selected mixture of Clostridia strains from the human microbiota. Nature 2013; 500(7461):232-6. Epub 2013/July/12; PMID:23842501; http://dx.doi.org/ 10.1038/nature12331 [DOI] [PubMed] [Google Scholar]
- [32].Ivanov II, Atarashi K, Manel N, Brodie EL, Shima T, Karaoz U, Wei D, Goldfarb KC, Santee CA, Lynch SV, et al.. Induction of intestinal Th17 cells by segmented filamentous bacteria. Cell 2009; 139(3):485-98. Epub 2009/October/20; PMID:19836068; http://dx.doi.org/ 10.1016/j.cell.2009.09.033 [DOI] [PMC free article] [PubMed] [Google Scholar]
- [33].Atarashi K, Tanoue T, Ando M, Kamada N, Nagano Y, Narushima S, Suda W, Imaoka A, Setoyama H, Nagamori T, et al.. Th17 cell induction by adhesion of microbes to intestinal epithelial cells. Cell 2015; 163(2):367-80; PMID:26411289; http://dx.doi.org/ 10.1016/j.cell.2015.08.058 [DOI] [PMC free article] [PubMed] [Google Scholar]
- [34].Donia MS, Fischbach MA. HUMAN MICROBIOTA. Small molecules from the human microbiota. Science 2015; 349(6246):1254766; PMID:26206939. [DOI] [PMC free article] [PubMed] [Google Scholar]
- [35].Walker A, Pfitzner B, Neschen S, Kahle M, Harir M, Lucio M, Moritz F, Tziotis D, Witting M, Rothballer M, et al.. Distinct signatures of host-microbial meta-metabolome and gut microbiome in two C57BL/6 strains under high-fat diet. ISME J 2014; 8(12):2380-96; PMID:24906017; http://dx.doi.org/ 10.1038/ismej.2014.79 [DOI] [PMC free article] [PubMed] [Google Scholar]
- [36].Svensson U, Houweling M, Holst E, Sundler R. Phosphorylation and activation of the arachidonate-mobilizing phospholipase A2 in macrophages in response to bacteria. Eur J Biochem 1993; 213(1):81-6; PMID:8386632; http://dx.doi.org/ 10.1111/j.1432-1033.1993.tb17736.x [DOI] [PubMed] [Google Scholar]
- [37].Sayin SI, Wahlstrom A, Felin J, Jantti S, Marschall HU, Bamberg K, Angelin B, Hyötyläinen T, Orešič M, Bäckhed F. Gut microbiota regulates bile acid metabolism by reducing the levels of tauro-beta-muricholic acid, a naturally occurring FXR antagonist. Cell Metab 2013; 17(2):225-35. Epub 2013/February/12; PMID:23395169; http://dx.doi.org/ 10.1016/j.cmet.2013.01.003 [DOI] [PubMed] [Google Scholar]
- [38].Wissenbach DK, Oliphant K, Rolle-Kampczyk U, Yen S, Hoke H, Baumann S, Haange SB, Verdu EF, Allen-Vercoe E, von Bergen M. Optimization of metabolomics of defined in vitro gut microbial ecosystems. Int J Med Microbiol 2016; 306(5):280-9; PMID: 27020116; http://dx.doi.org/ 10.1016/j.ijmm.2016.03.007 [DOI] [PubMed] [Google Scholar]
- [39].Tursi A, Mastromarino P, Capobianco D, Elisei W, Miccheli A, Capuani G, Tomassini A, Campagna G, Picchio M, Giorgetti G, et al.. Assessment of fecal microbiota and fecal metabolome in symptomatic uncomplicated diverticular disease of the Colon. J Clin Gastroenterol 2016; 50 Suppl 1:S9-S12; PMID:27622378; http://dx.doi.org/ 10.1097/MCG.0000000000000626 [DOI] [PubMed] [Google Scholar]
- [40].Stewart CJ, Skeath T, Nelson A, Fernstad SJ, Marrs EC, Perry JD, Perry JD, Cummings SP, Berrington JE, Embleton ND. Preterm gut microbiota and metabolome following discharge from intensive care. Scientific Reports 2015; 5:17141; PMID: 26598071; http://dx.doi.org/ 10.1038/srep17141 [DOI] [PMC free article] [PubMed] [Google Scholar]
- [41].Liu JZ, van Sommeren S, Huang H, Ng SC, Alberts R, Takahashi A, Ripke S, Lee JC, Jostins L, Shah T, et al.. Association analyses identify 38 susceptibility loci for inflammatory bowel disease and highlight shared genetic risk across populations. Nat Genetics 2015; 47(9):979-86; PMID: 26192919; http://dx.doi.org/ 10.1038/ng.3359 [DOI] [PMC free article] [PubMed] [Google Scholar]
- [42].Marchesi JR, Adams DH, Fava F, Hermes GD, Hirschfield GM, Hold G, Quraishi MN, Kinross J, Smidt H, Tuohy KM, et al.. The gut microbiota and host health: a new clinical frontier. Gut 2016; 65(2):330-9; PMID:26338727; http://dx.doi.org/ 10.1136/gutjnl-2015-309990 [DOI] [PMC free article] [PubMed] [Google Scholar]
- [43].David LA, Maurice CF, Carmody RN, Gootenberg DB, Button JE, Wolfe BE, Ling AV, Devlin AS, Varma Y, Fischbach MA, et al.. Diet rapidly and reproducibly alters the human gut microbiome. Nature 2014; 505(7484):559-63; PMID:24336217; http://dx.doi.org/ 10.1038/nature12820 [DOI] [PMC free article] [PubMed] [Google Scholar]
- [44].Dethlefsen L, Relman DA. Incomplete recovery and individualized responses of the human distal gut microbiota to repeated antibiotic perturbation. Proc Natl Acad Sci U S A 2011; 108 Suppl 1:4554-61; PMID:20847294; http://dx.doi.org/ 10.1073/pnas.1000087107 [DOI] [PMC free article] [PubMed] [Google Scholar]
- [45].Thaiss CA, Zeevi D, Levy M, Zilberman-Schapira G, Suez J, Tengeler AC, Abramson L, Katz MN, Korem T, Zmora N, et al.. Transkingdom control of microbiota diurnal oscillations promotes metabolic homeostasis. Cell 2014; 159(3):514-29; PMID:25417104; http://dx.doi.org/ 10.1016/j.cell.2014.09.048 [DOI] [PubMed] [Google Scholar]
- [46].Jostins L, Ripke S, Weersma RK, Duerr RH, McGovern DP, Hui KY, Lee JC, Schumm LP, Sharma Y, Anderson CA, et al.. Host-microbe interactions have shaped the genetic architecture of inflammatory bowel disease. Nature 2012; 491(7422):119-24. Epub 2012/November/07; PMID:23128233; http://dx.doi.org/ 10.1038/nature11582 [DOI] [PMC free article] [PubMed] [Google Scholar]
- [47].Tong M, Jacobs JP, McHardy IH, Braun J. Sampling of intestinal microbiota and targeted amplification of bacterial 16S rRNA genes for microbial ecologic analysis. Curr Protocols Immunol / edited by John E Coligan [et al] 2014; 107:7 41 1-7 11. Epub 2014/November/05; PMID:25367129. [DOI] [PMC free article] [PubMed] [Google Scholar]
- [48].Caporaso JG, Kuczynski J, Stombaugh J, Bittinger K, Bushman FD, Costello EK, Fierer N, Peña AG, Goodrich JK, Gordon JI, et al.. QIIME allows analysis of high-throughput community sequencing data. Nat Methods 2010; 7(5):335-6. Epub 2010/April/13; PMID:20383131; http://dx.doi.org/ 10.1038/nmeth.f.303 [DOI] [PMC free article] [PubMed] [Google Scholar]
- [49].Lozupone C, Knight R. UniFrac: a new phylogenetic method for comparing microbial communities. Applied Environmental Microbiol 2005; 71(12):8228-35. Epub 2005/December/08. PMID:16332807; http://dx.doi.org/ 10.1128/AEM.71.12.8228-8235.2005 [DOI] [PMC free article] [PubMed] [Google Scholar]
- [50].Love MI, Huber W, Anders S. Moderated estimation of fold change and dispersion for RNA-seq data with DESeq2. Genome Biol 2014; 15(12):550. Epub 2014/December/18; PMID:25516281; http://dx.doi.org/ 10.1186/s13059-014-0550-8 [DOI] [PMC free article] [PubMed] [Google Scholar]
- [51].Storey JD, Tibshirani R. Statistical significance for genomewide studies. Proc Natl Acad Sci U S A 2003; 100(16):9440-5. Epub 2003/July/29; PMID:12883005; http://dx.doi.org/ 10.1073/pnas.1530509100 [DOI] [PMC free article] [PubMed] [Google Scholar]